Las Vegas, NV Investment Properties for Sale
Browse homes for sale and investment properties in Las Vegas, NV. Refine your search by price, property type, or more.
Best cash flowing properties in Las Vegas, NV
Active
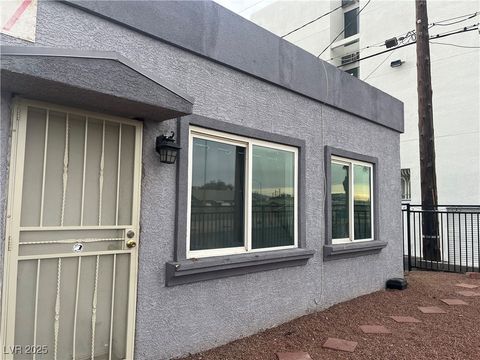
$310,000
2
bds
|
1
ba
|
884
sqft
|
built
1951
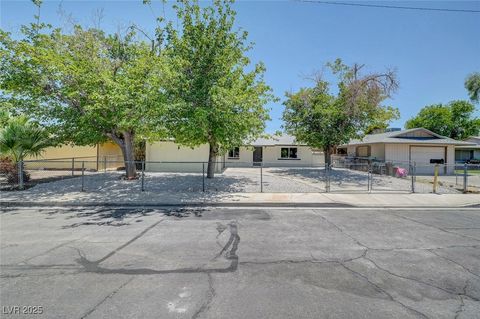
1925 Franklin Ave, Las Vegas, NV 89104
$-677
Cash flow
-11.4%
Cash-on-Cash Return
3.6%
Cap rate
0.5%
Rent to Value Ratio
Active
$445,000
3
bds
|
2
ba
|
1,708
sqft
|
built
1961
1660 Izabella Ave, Las Vegas, NV 89169
$-680
Cash flow
-8.0%
Cash-on-Cash Return
4.4%
Cap rate
0.6%
Rent to Value Ratio
6,291 out of 6,426 properties for sale in Las Vegas, NV
Limited Results Shown
Create a free account, or log in to reveal all property listings and enjoy the complete experience.
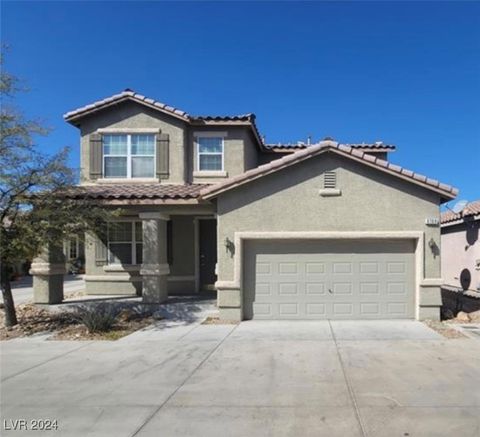
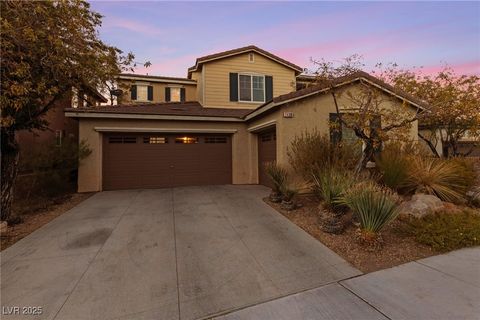
Active
$399,900
3
bds
|
2
ba
|
1,396
sqft
|
built
2004
5017 Hadley Meadow Ct, Las Vegas, NV 89131
$-894
Cash flow
-11.7%
Cash-on-Cash Return
3.6%
Cap rate
0.5%
Rent to Value Ratio
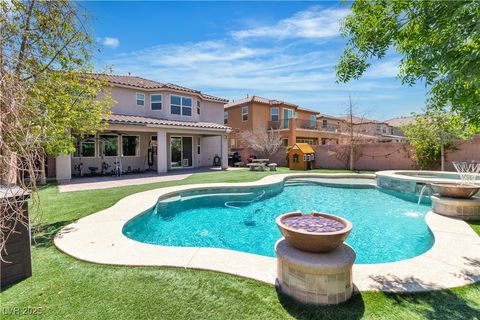
Active
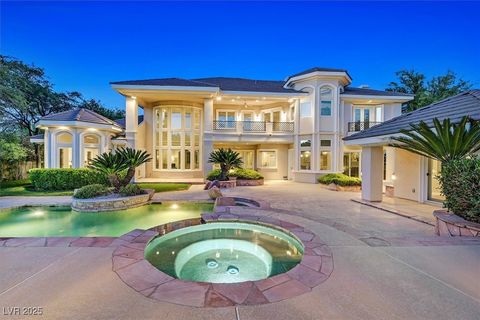
$4,300,000
4
bds
|
6
ba
|
6,372
sqft
|
built
2020
3740 Caesars Cir, Las Vegas, NV 89120
$-17,355
Cash flow
-21.1%
Cash-on-Cash Return
1.4%
Cap rate
0.2%
Rent to Value Ratio
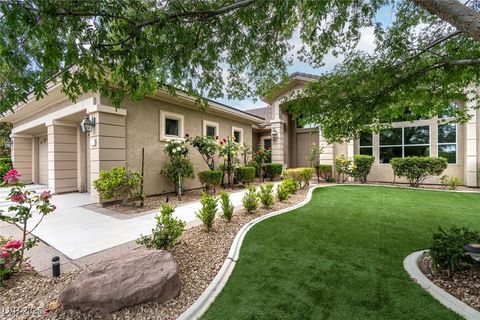
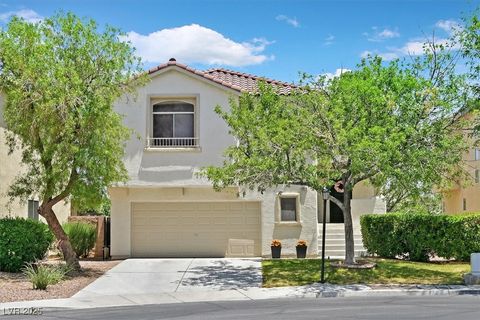
Active
$699,900
5
bds
|
5
ba
|
3,304
sqft
|
built
2008
8564 Mayport Dr, Las Vegas, NV 89131
$-1,834
Cash flow
-13.7%
Cash-on-Cash Return
3.1%
Cap rate
0.5%
Rent to Value Ratio
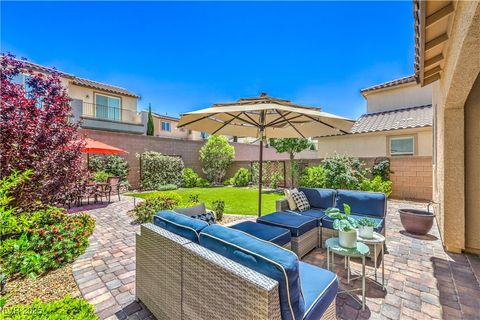
Active
$445,000
3
bds
|
2
ba
|
1,708
sqft
|
built
1961
1660 Izabella Ave, Las Vegas, NV 89169
$-680
Cash flow
-8.0%
Cash-on-Cash Return
4.4%
Cap rate
0.6%
Rent to Value Ratio
Active
$310,000
2
bds
|
1
ba
|
884
sqft
|
built
1951
1925 Franklin Ave, Las Vegas, NV 89104
$-677
Cash flow
-11.4%
Cash-on-Cash Return
3.6%
Cap rate
0.5%
Rent to Value Ratio
Active
$410,000
4
bds
|
3
ba
|
1,542
sqft
|
built
1989
5984 Emerald Canyon Dr, Las Vegas, NV 89142
$-856
Cash flow
-10.9%
Cash-on-Cash Return
3.8%
Cap rate
0.5%
Rent to Value Ratio
Active
$950,000
5
bds
|
5
ba
|
3,998
sqft
|
built
2006
9992 Sky Parlor Rd, Las Vegas, NV 89178
$-3,096
Cash flow
-17.0%
Cash-on-Cash Return
2.4%
Cap rate
0.4%
Rent to Value Ratio
Active
$989,900
4
bds
|
3
ba
|
3,024
sqft
|
built
1986
7664 Angel Crest Cir, Las Vegas, NV 89117
$-3,760
Cash flow
-19.8%
Cash-on-Cash Return
1.7%
Cap rate
0.3%
Rent to Value Ratio
Active
$499,900
3
bds
|
2
ba
|
1,398
sqft
|
built
2001
5607 W Dewey Dr, Las Vegas, NV 89118
$-1,632
Cash flow
-17.0%
Cash-on-Cash Return
2.3%
Cap rate
0.3%
Rent to Value Ratio

Active
$424,900
3
bds
|
2
ba
|
1,494
sqft
|
built
2001
5112 Foggia Ave, Las Vegas, NV 89130
$-975
Cash flow
-12.0%
Cash-on-Cash Return
3.5%
Cap rate
0.5%
Rent to Value Ratio
Active
$529,000
4
bds
|
3
ba
|
2,144
sqft
|
built
2003
9513 Perennial View Ave, Las Vegas, NV 89148
$-1,571
Cash flow
-15.5%
Cash-on-Cash Return
2.7%
Cap rate
0.4%
Rent to Value Ratio
Active
$399,000
3
bds
|
3
ba
|
1,503
sqft
|
built
2014
7704 Classy Cashmere Ct, Las Vegas, NV 89149
$-969
Cash flow
-12.7%
Cash-on-Cash Return
3.4%
Cap rate
0.5%
Rent to Value Ratio
Active
$419,500
3
bds
|
2
ba
|
1,208
sqft
|
built
2001
7949 Long Beach St, Las Vegas, NV 89139
$-1,042
Cash flow
-13.0%
Cash-on-Cash Return
3.3%
Cap rate
0.5%
Rent to Value Ratio
Active
$525,000
3
bds
|
2
ba
|
1,667
sqft
|
built
2000
10342 Spider Rock Ave, Las Vegas, NV 89135
$-1,511
Cash flow
-15.0%
Cash-on-Cash Return
2.8%
Cap rate
0.4%
Rent to Value Ratio
Active
$424,900
3
bds
|
2
ba
|
1,608
sqft
|
built
1964
4424 Sunrise Ave, Las Vegas, NV 89110
$-1,029
Cash flow
-12.6%
Cash-on-Cash Return
3.4%
Cap rate
0.4%
Rent to Value Ratio
Active
$390,000
3
bds
|
2
ba
|
1,183
sqft
|
built
2004
2633 Spider Cactus Ct, Las Vegas, NV 89106
$-1,118
Cash flow
-15.0%
Cash-on-Cash Return
2.8%
Cap rate
0.4%
Rent to Value Ratio
Active
$509,000
5
bds
|
3
ba
|
2,127
sqft
|
built
2004
7083 Somera Way, Las Vegas, NV 89113
$-1,418
Cash flow
-14.5%
Cash-on-Cash Return
2.9%
Cap rate
0.4%
Rent to Value Ratio
Active
$599,900
2
bds
|
0
ba
|
2,138
sqft
|
built
1949
817 Stewart Ave, Las Vegas, NV 89101
$-2,290
Cash flow
-19.9%
Cash-on-Cash Return
1.7%
Cap rate
0.2%
Rent to Value Ratio

Active
$547,400
3
bds
|
3
ba
|
2,674
sqft
|
built
2006
9173 Whitekirk Pl, Las Vegas, NV 89145
$-1,752
Cash flow
-16.7%
Cash-on-Cash Return
2.4%
Cap rate
0.5%
Rent to Value Ratio
Active
$434,900
4
bds
|
3
ba
|
1,847
sqft
|
built
2006
6709 Brick House Ave, Las Vegas, NV 89122
$-1,067
Cash flow
-12.8%
Cash-on-Cash Return
3.3%
Cap rate
0.5%
Rent to Value Ratio
Active
$915,000
6
bds
|
4
ba
|
4,213
sqft
|
built
2013
7545 Fontera Ct, Las Vegas, NV 89139
$-2,675
Cash flow
-15.3%
Cash-on-Cash Return
2.8%
Cap rate
0.4%
Rent to Value Ratio
Active
$1,494,900
3
bds
|
4
ba
|
3,502
sqft
|
built
1999
801 Aquitaine Ct, Las Vegas, NV 89145
$-5,885
Cash flow
-20.5%
Cash-on-Cash Return
1.5%
Cap rate
0.3%
Rent to Value Ratio
Active
$1,050,000
5
bds
|
4
ba
|
4,549
sqft
|
built
2001
253 White Willow Ave, Las Vegas, NV 89123
$-2,912
Cash flow
-14.5%
Cash-on-Cash Return
2.9%
Cap rate
0.5%
Rent to Value Ratio
Active
$389,900
3
bds
|
3
ba
|
1,524
sqft
|
built
1998
8453 Vast Horizon Ave, Las Vegas, NV 89129
$-972
Cash flow
-13.0%
Cash-on-Cash Return
3.3%
Cap rate
0.5%
Rent to Value Ratio

Active
$330,000
2
bds
|
2
ba
|
1,168
sqft
|
built
1996
601 Harvest Run Dr, Las Vegas, NV 89145
$-871
Cash flow
-13.8%
Cash-on-Cash Return
3.1%
Cap rate
0.6%
Rent to Value Ratio
Active
$1,000,000
5
bds
|
4
ba
|
4,861
sqft
|
built
2005
7538 Mustang St, Las Vegas, NV 89131
$-2,889
Cash flow
-15.1%
Cash-on-Cash Return
2.8%
Cap rate
0.4%
Rent to Value Ratio
Active
$549,900
4
bds
|
3
ba
|
2,250
sqft
|
built
1995
8355 Cabin Peak St, Las Vegas, NV 89123
$-1,111
Cash flow
-10.5%
Cash-on-Cash Return
3.8%
Cap rate
0.5%
Rent to Value Ratio
Active
$529,888
3
bds
|
3
ba
|
1,485
sqft
|
built
1992
2212 Warm Walnut Dr, Las Vegas, NV 89134
$-1,510
Cash flow
-14.9%
Cash-on-Cash Return
2.8%
Cap rate
0.4%
Rent to Value Ratio
Active
$768,500
4
bds
|
4
ba
|
2,926
sqft
|
built
1997
9272 W Viking Rd, Las Vegas, NV 89147
$-1,474
Cash flow
-10.0%
Cash-on-Cash Return
4.0%
Cap rate
0.5%
Rent to Value Ratio
Active
$1,590,000
4
bds
|
4
ba
|
4,016
sqft
|
built
2001
3042 Hammerwood Dr, Las Vegas, NV 89135
$-3,818
Cash flow
-12.5%
Cash-on-Cash Return
3.4%
Cap rate
0.5%
Rent to Value Ratio
Active
$659,900
3
bds
|
3
ba
|
2,684
sqft
|
built
2001
8208 Flowing Rapids Ct, Las Vegas, NV 89131
$-1,813
Cash flow
-14.3%
Cash-on-Cash Return
3.0%
Cap rate
0.4%
Rent to Value Ratio
Active
$4,380,000
5
bds
|
6
ba
|
6,503
sqft
|
built
1997
1809 White Hawk Ct, Las Vegas, NV 89134
$-18,143
Cash flow
-21.6%
Cash-on-Cash Return
1.3%
Cap rate
0.2%
Rent to Value Ratio
Active
$745,000
4
bds
|
3
ba
|
3,217
sqft
|
built
2006
7438 Desertscape Ave, Las Vegas, NV 89178
$-1,808
Cash flow
-12.7%
Cash-on-Cash Return
3.4%
Cap rate
0.5%
Rent to Value Ratio
Active
$495,000
3
bds
|
3
ba
|
1,930
sqft
|
built
2001
11022 Saint Rafael St, Las Vegas, NV 89141
$-1,359
Cash flow
-14.3%
Cash-on-Cash Return
3.0%
Cap rate
0.4%
Rent to Value Ratio
Active
$535,000
3
bds
|
3
ba
|
1,716
sqft
|
built
2020
12286 Silvana St, Las Vegas, NV 89141
$-1,496
Cash flow
-14.6%
Cash-on-Cash Return
2.9%
Cap rate
0.5%
Rent to Value Ratio
Active
$1,950,000
3
bds
|
4
ba
|
3,720
sqft
|
built
2006
3955 W Jo Rae Ave, Las Vegas, NV 89141
$-5,912
Cash flow
-15.8%
Cash-on-Cash Return
2.6%
Cap rate
0.4%
Rent to Value Ratio
Active
$699,999
4
bds
|
2
ba
|
2,274
sqft
|
built
1976
5858 El Parque Ave, Las Vegas, NV 89146
$-998
Cash flow
-7.4%
Cash-on-Cash Return
4.6%
Cap rate
0.6%
Rent to Value Ratio
Active
$499,900
4
bds
|
3
ba
|
1,970
sqft
|
built
1997
2037 Merano Ct, Las Vegas, NV 89123
$-1,280
Cash flow
-13.4%
Cash-on-Cash Return
3.2%
Cap rate
0.4%
Rent to Value Ratio
Active
$1,399,000
4
bds
|
4
ba
|
3,769
sqft
|
built
1990
2101 Diamond Bar Dr, Las Vegas, NV 89117
$-5,198
Cash flow
-19.4%
Cash-on-Cash Return
1.8%
Cap rate
0.3%
Rent to Value Ratio
Active
$535,000
4
bds
|
3
ba
|
2,080
sqft
|
built
1992
9409 Kayla Ct, Las Vegas, NV 89134
$-1,331
Cash flow
-13.0%
Cash-on-Cash Return
3.3%
Cap rate
0.5%
Rent to Value Ratio