Las Vegas, NV Investment Properties for Sale
Browse homes for sale and investment properties in Las Vegas, NV. Refine your search by price, property type, or more.
Best cash flowing properties in Las Vegas, NV

Active
$187,500
1
bds
|
1
ba
|
720
sqft
|
built
1988
2451 N Rainbow Blvd, Las Vegas, NV 89108
$-518
Cash flow
-14.4%
Cash-on-Cash Return
3.0%
Cap rate
0.6%
Rent to Value Ratio

Pending
$219,000
1
bds
|
1
ba
|
863
sqft
|
built
1972
737 Oakmont Ave, Las Vegas, NV 89109
$-528
Cash flow
-12.6%
Cash-on-Cash Return
3.4%
Cap rate
0.7%
Rent to Value Ratio
5,424 out of 5,551 properties for sale in Las Vegas, NV
Limited Results Shown
Create a free account, or log in to reveal all property listings and enjoy the complete experience.

Active
$345,000
2
bds
|
2
ba
|
1,186
sqft
|
built
1998
10553 Pine Pointe Ave, Las Vegas, NV 89144
$-862
Cash flow
-13.0%
Cash-on-Cash Return
3.3%
Cap rate
0.5%
Rent to Value Ratio
Active
$395,000
3
bds
|
2
ba
|
1,254
sqft
|
built
1997
4381 Coyote Crest Ct, Las Vegas, NV 89147
$-859
Cash flow
-11.3%
Cash-on-Cash Return
3.7%
Cap rate
0.5%
Rent to Value Ratio
Active
$545,000
3
bds
|
3
ba
|
2,480
sqft
|
built
2003
5859 Noble Stand St, Las Vegas, NV 89148
$-1,145
Cash flow
-11.0%
Cash-on-Cash Return
3.8%
Cap rate
0.5%
Rent to Value Ratio

Active
$439,000
3
bds
|
3
ba
|
1,853
sqft
|
built
2007
9019 Winchester Ridge St, Las Vegas, NV 89139
$-1,163
Cash flow
-13.8%
Cash-on-Cash Return
3.1%
Cap rate
0.5%
Rent to Value Ratio

Active
$484,988
4
bds
|
3
ba
|
2,101
sqft
|
built
2005
2691 Rimpacific Cir, Las Vegas, NV 89146
$-1,266
Cash flow
-13.6%
Cash-on-Cash Return
3.2%
Cap rate
0.5%
Rent to Value Ratio
Active under contract
$529,999
4
bds
|
3
ba
|
2,206
sqft
|
built
1998
3750 Morning Canyon St, Las Vegas, NV 89147
$-1,421
Cash flow
-14.0%
Cash-on-Cash Return
3.1%
Cap rate
0.4%
Rent to Value Ratio
Active
$360,000
3
bds
|
2
ba
|
1,408
sqft
|
built
1980
6325 Miraloma St, Las Vegas, NV 89108
$-762
Cash flow
-11.0%
Cash-on-Cash Return
3.7%
Cap rate
0.5%
Rent to Value Ratio

Active
$268,800
2
bds
|
2
ba
|
943
sqft
|
built
2002
7159 S Durango Dr, Las Vegas, NV 89113
$-681
Cash flow
-13.2%
Cash-on-Cash Return
3.2%
Cap rate
0.6%
Rent to Value Ratio

Active
$360,000
2
bds
|
2
ba
|
1,473
sqft
|
built
2003
2781 Dunstan Way, Las Vegas, NV 89123
$-781
Cash flow
-11.3%
Cash-on-Cash Return
3.7%
Cap rate
0.5%
Rent to Value Ratio

Active
$325,000
2
bds
|
2
ba
|
1,248
sqft
|
built
2001
10525 Pine Glen Ave, Las Vegas, NV 89144
$-861
Cash flow
-13.8%
Cash-on-Cash Return
3.1%
Cap rate
0.5%
Rent to Value Ratio
Active
$258,000
2
bds
|
2
ba
|
1,023
sqft
|
built
1995
7950 W Flamingo Rd, Las Vegas, NV 89147
$-646
Cash flow
-13.1%
Cash-on-Cash Return
3.3%
Cap rate
0.5%
Rent to Value Ratio
Pending
$219,000
1
bds
|
1
ba
|
863
sqft
|
built
1972
737 Oakmont Ave, Las Vegas, NV 89109
$-528
Cash flow
-12.6%
Cash-on-Cash Return
3.4%
Cap rate
0.7%
Rent to Value Ratio
Active
$279,900
2
bds
|
2
ba
|
1,136
sqft
|
built
1991
7964 Rim Rock Way, Las Vegas, NV 89128
$-637
Cash flow
-11.9%
Cash-on-Cash Return
3.6%
Cap rate
0.6%
Rent to Value Ratio

Active
$350,000
4
bds
|
2
ba
|
1,230
sqft
|
built
1955
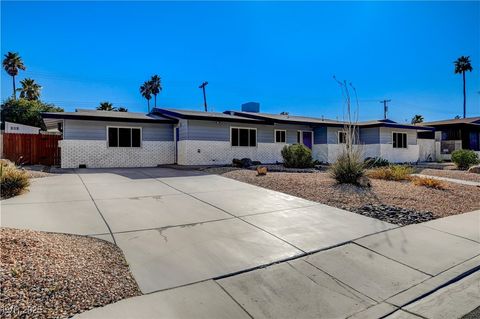
1331 Smoke Tree Ave, Las Vegas, NV 89108
$-660
Cash flow
-9.8%
Cash-on-Cash Return
4.0%
Cap rate
0.5%
Rent to Value Ratio
Active
$239,000
2
bds
|
2
ba
|
1,141
sqft
|
built
1984
4083 Nook Way, Las Vegas, NV 89103
$-543
Cash flow
-11.9%
Cash-on-Cash Return
3.6%
Cap rate
0.6%
Rent to Value Ratio
Active
$259,900
2
bds
|
2
ba
|
1,136
sqft
|
built
1990
905 Rockview Dr, Las Vegas, NV 89128
$-616
Cash flow
-12.4%
Cash-on-Cash Return
3.4%
Cap rate
0.6%
Rent to Value Ratio

Active
$244,990
2
bds
|
2
ba
|
1,016
sqft
|
built
1995
8450 Alta Dr, Las Vegas, NV 89145
$-575
Cash flow
-12.2%
Cash-on-Cash Return
3.5%
Cap rate
0.6%
Rent to Value Ratio

Active
$225,815
2
bds
|
2
ba
|
1,128
sqft
|
built
1988
2451 N Rainbow Blvd, Las Vegas, NV 89108
$-592
Cash flow
-13.7%
Cash-on-Cash Return
3.1%
Cap rate
0.6%
Rent to Value Ratio
Active
$285,900
2
bds
|
2
ba
|
1,185
sqft
|
built
1979
4213 Park Ct, Las Vegas, NV 89110
$-616
Cash flow
-11.2%
Cash-on-Cash Return
3.7%
Cap rate
0.6%
Rent to Value Ratio
Active
$199,900
1
bds
|
1
ba
|
700
sqft
|
built
1982
5295 Indian River Dr, Las Vegas, NV 89103
$-613
Cash flow
-16.0%
Cash-on-Cash Return
2.6%
Cap rate
0.5%
Rent to Value Ratio

Active
$445,990
3
bds
|
2
ba
|
1,413
sqft
|
built
1980
3425 Irv Marcus Dr, Las Vegas, NV 89108
$-743
Cash flow
-8.7%
Cash-on-Cash Return
4.3%
Cap rate
0.6%
Rent to Value Ratio
Active
$385,000
3
bds
|
2
ba
|
1,274
sqft
|
built
1963
721 Carpenter Dr, Las Vegas, NV 89107
$-841
Cash flow
-11.4%
Cash-on-Cash Return
3.7%
Cap rate
0.5%
Rent to Value Ratio
Active
$410,000
3
bds
|
2
ba
|
1,800
sqft
|
built
1977
2532 Whippoorwill Ln, Las Vegas, NV 89121
$-749
Cash flow
-9.5%
Cash-on-Cash Return
4.1%
Cap rate
0.6%
Rent to Value Ratio

Active
$510,000
4
bds
|
4
ba
|
2,222
sqft
|
built
1977
4474 Dawley Ct, Las Vegas, NV 89104
$-765
Cash flow
-7.8%
Cash-on-Cash Return
4.5%
Cap rate
0.6%
Rent to Value Ratio
Active
$620,000
5
bds
|
5
ba
|
3,046
sqft
|
built
2015
11048 Prairie Grove Rd, Las Vegas, NV 89179
$-1,801
Cash flow
-15.2%
Cash-on-Cash Return
2.8%
Cap rate
0.5%
Rent to Value Ratio

Active
$649,900
5
bds
|
3
ba
|
3,205
sqft
|
built
2012
10511 Loma Portal Ave, Las Vegas, NV 89166
$-1,695
Cash flow
-13.6%
Cash-on-Cash Return
3.2%
Cap rate
0.5%
Rent to Value Ratio
Active
$777,000
4
bds
|
3
ba
|
2,953
sqft
|
built
2002
5310 Esparon Ave, Las Vegas, NV 89141
$-1,802
Cash flow
-12.1%
Cash-on-Cash Return
3.5%
Cap rate
0.5%
Rent to Value Ratio
Active
$678,500
4
bds
|
3
ba
|
2,271
sqft
|
built
1992
9416 Rolling Ridge Ln, Las Vegas, NV 89134
$-1,759
Cash flow
-13.5%
Cash-on-Cash Return
3.2%
Cap rate
0.5%
Rent to Value Ratio
Active
$462,500
2
bds
|
2
ba
|
1,624
sqft
|
built
1993
2133 Desert Pines St, Las Vegas, NV 89134
$-924
Cash flow
-10.4%
Cash-on-Cash Return
3.9%
Cap rate
0.5%
Rent to Value Ratio
Active
$187,500
1
bds
|
1
ba
|
720
sqft
|
built
1988
2451 N Rainbow Blvd, Las Vegas, NV 89108
$-518
Cash flow
-14.4%
Cash-on-Cash Return
3.0%
Cap rate
0.6%
Rent to Value Ratio
Active
$264,000
2
bds
|
2
ba
|
1,136
sqft
|
built
1988
2704 Otter Creek Ct, Las Vegas, NV 89117
$-649
Cash flow
-12.8%
Cash-on-Cash Return
3.3%
Cap rate
0.6%
Rent to Value Ratio
Active
$229,887
2
bds
|
1
ba
|
949
sqft
|
built
1987
5006 S Rainbow Blvd, Las Vegas, NV 89118
$-592
Cash flow
-13.4%
Cash-on-Cash Return
3.2%
Cap rate
0.6%
Rent to Value Ratio
Active
$380,000
3
bds
|
3
ba
|
1,533
sqft
|
built
1977
508 Purcell Dr, Las Vegas, NV 89107
$-726
Cash flow
-10.0%
Cash-on-Cash Return
4.0%
Cap rate
0.5%
Rent to Value Ratio
Active
$365,000
3
bds
|
4
ba
|
1,686
sqft
|
built
2006
4777 Manderston Ct, Las Vegas, NV 89130
$-722
Cash flow
-10.3%
Cash-on-Cash Return
3.9%
Cap rate
0.5%
Rent to Value Ratio
Active
$570,000
3
bds
|
2
ba
|
2,170
sqft
|
built
1964
1631 Ottawa Dr, Las Vegas, NV 89169
$-961
Cash flow
-8.8%
Cash-on-Cash Return
4.3%
Cap rate
0.5%
Rent to Value Ratio
Active
$167,000
1
bds
|
1
ba
|
660
sqft
|
built
1989
220 Mission Newport Ln, Las Vegas, NV 89107
$-546
Cash flow
-17.1%
Cash-on-Cash Return
2.4%
Cap rate
0.7%
Rent to Value Ratio

Active
$272,000
2
bds
|
2
ba
|
1,070
sqft
|
built
2004
9000 Las Vegas Blvd S, Las Vegas, NV 89123
$-727
Cash flow
-13.9%
Cash-on-Cash Return
3.1%
Cap rate
0.6%
Rent to Value Ratio
Active
$420,000
3
bds
|
3
ba
|
2,028
sqft
|
built
1985
3821 Dream St, Las Vegas, NV 89108
$-752
Cash flow
-9.3%
Cash-on-Cash Return
4.1%
Cap rate
0.5%
Rent to Value Ratio
Active
$160,000
2
bds
|
1
ba
|
863
sqft
|
built
1971
1405 Vegas Valley Dr, Las Vegas, NV 89169
$-568
Cash flow
-18.5%
Cash-on-Cash Return
2.0%
Cap rate
0.6%
Rent to Value Ratio
Active
$419,000
4
bds
|
3
ba
|
2,024
sqft
|
built
2003
5031 Naff Ridge Dr, Las Vegas, NV 89131
$-655
Cash flow
-8.2%
Cash-on-Cash Return
4.4%
Cap rate
0.6%
Rent to Value Ratio