Las Vegas, NV Investment Properties for Sale
Browse homes for sale and investment properties in Las Vegas, NV. Refine your search by price, property type, or more.
Best cash flowing properties in Las Vegas, NV
Active
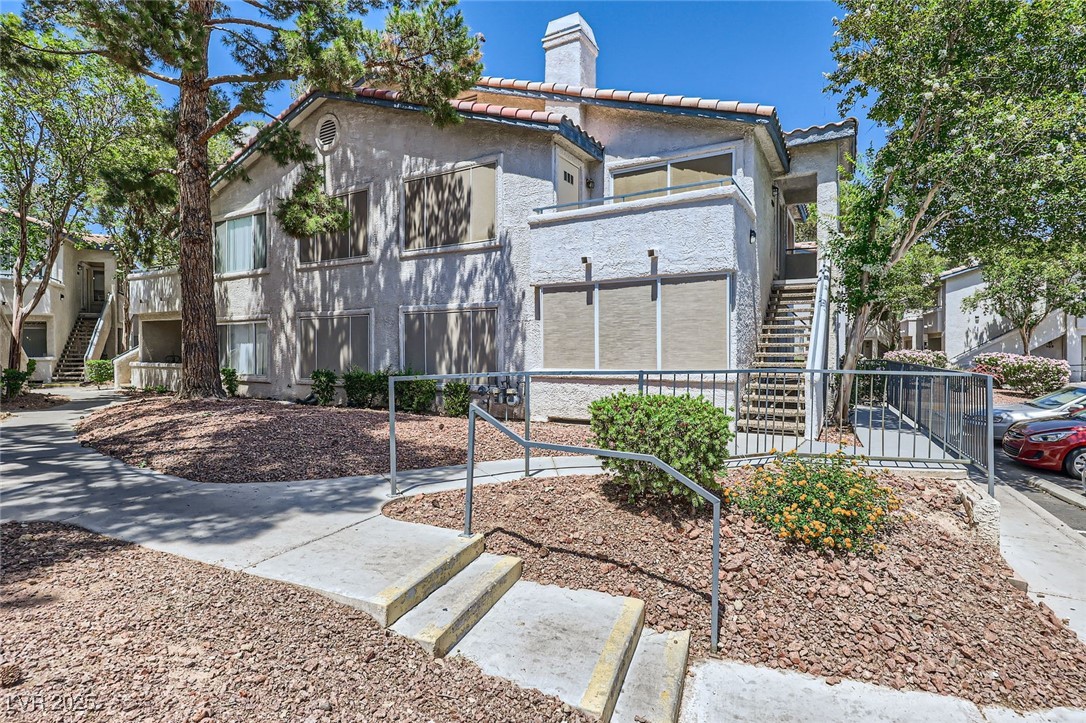
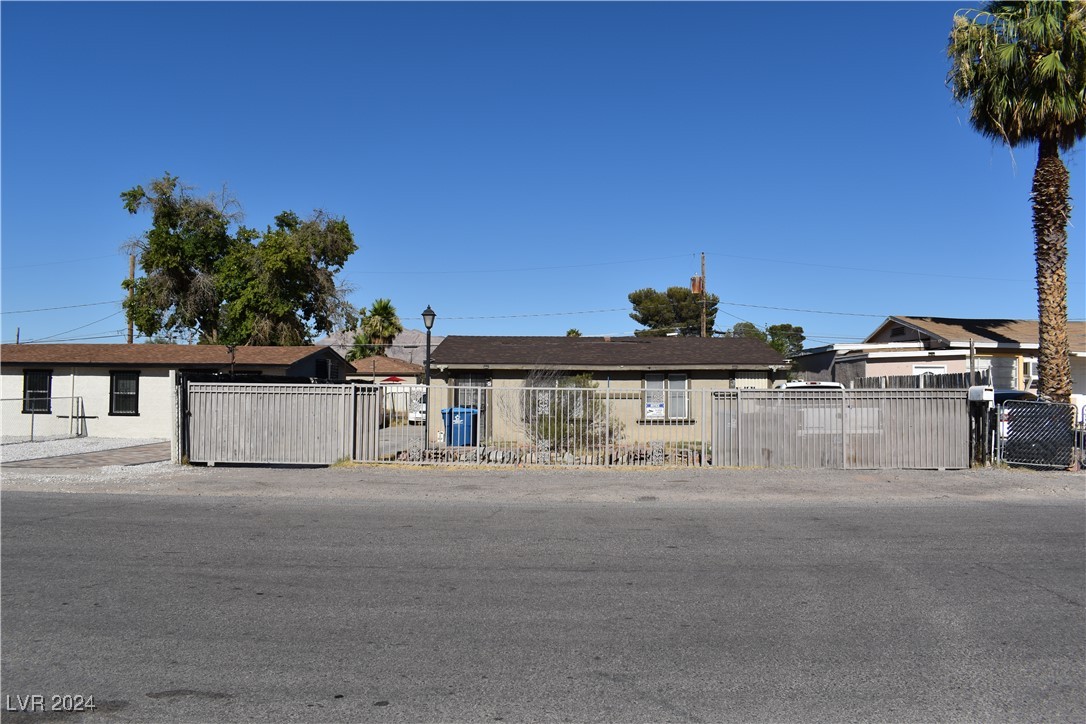
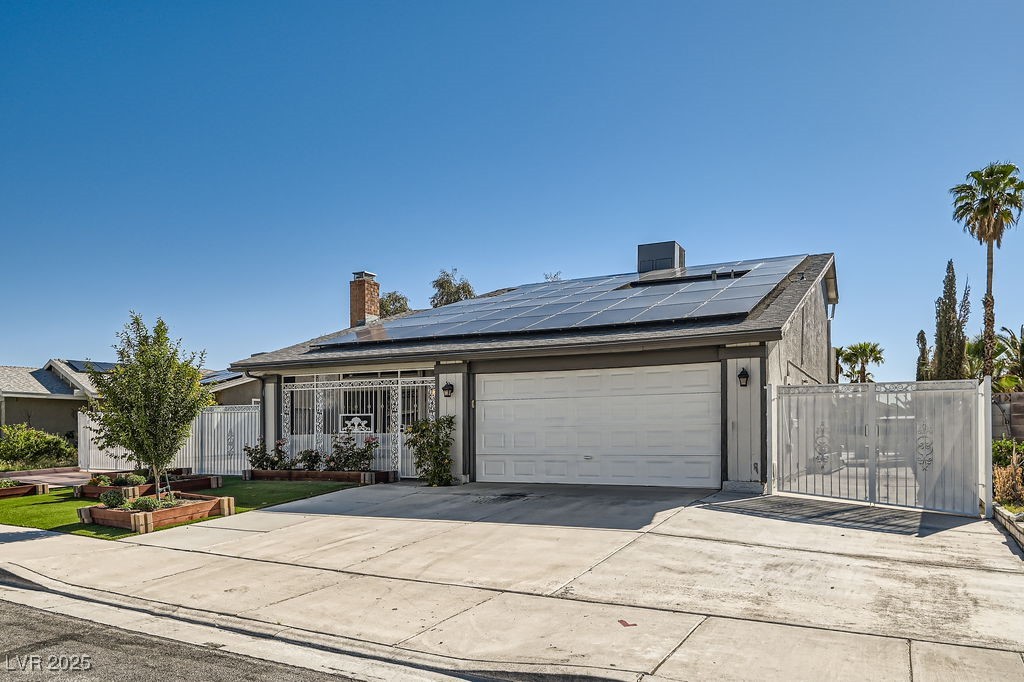
$245,000
3
bds
|
2
ba
|
1,190
sqft
|
built
1993
5241 Caspian Springs Dr, Las Vegas, NV 89120
$-569
Cash flow
-12.1%
Cash-on-Cash Return
3.5%
Cap rate
0.7%
Rent to Value Ratio
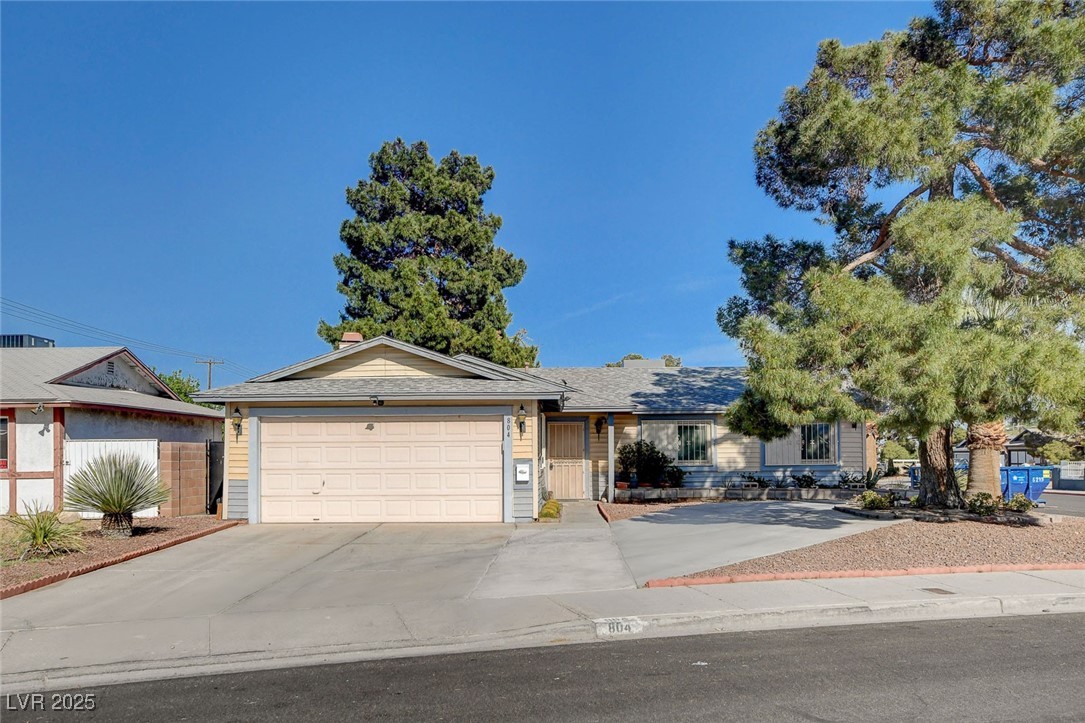
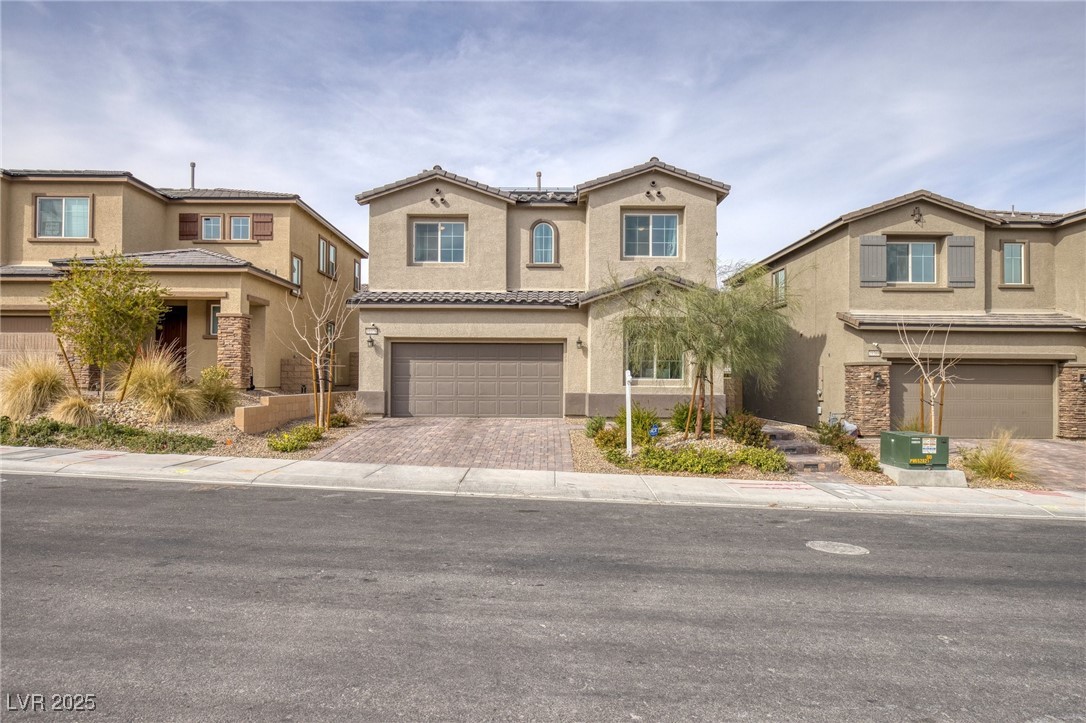
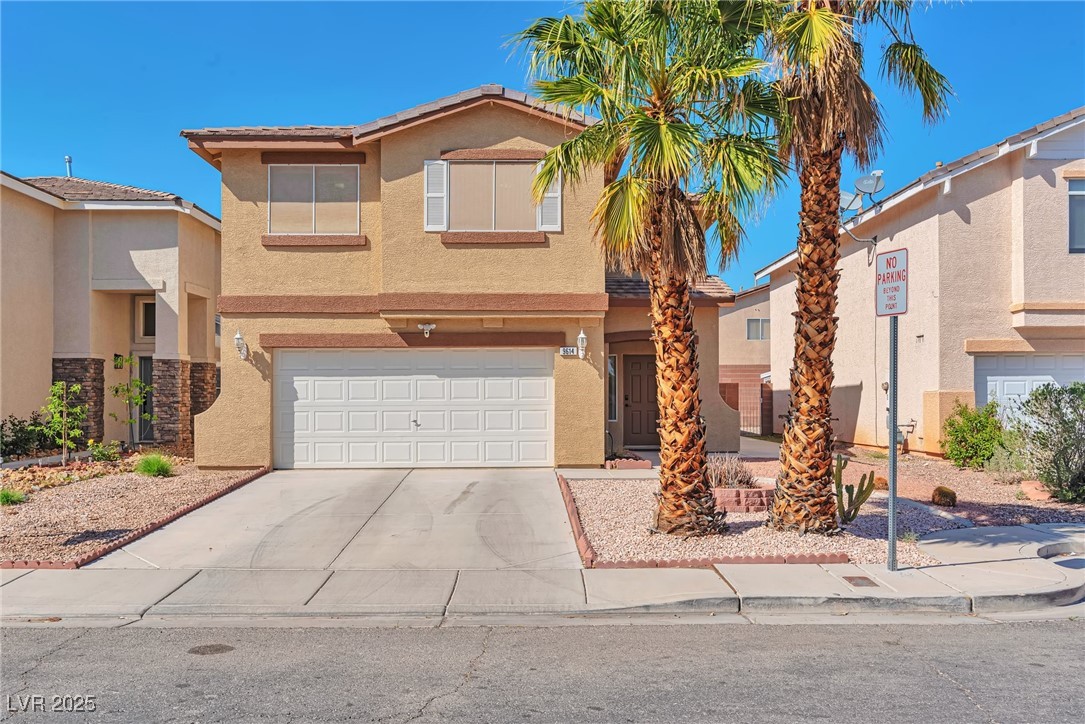
Active
$360,000
3
bds
|
2
ba
|
1,446
sqft
|
built
1981
804 S Mallard St, Las Vegas, NV 89107
$-659
Cash flow
-9.6%
Cash-on-Cash Return
4.1%
Cap rate
0.5%
Rent to Value Ratio
5,507 out of 5,638 properties for sale in Las Vegas, NV
Limited Results Shown
Create a free account, or log in to reveal all property listings and enjoy the complete experience.
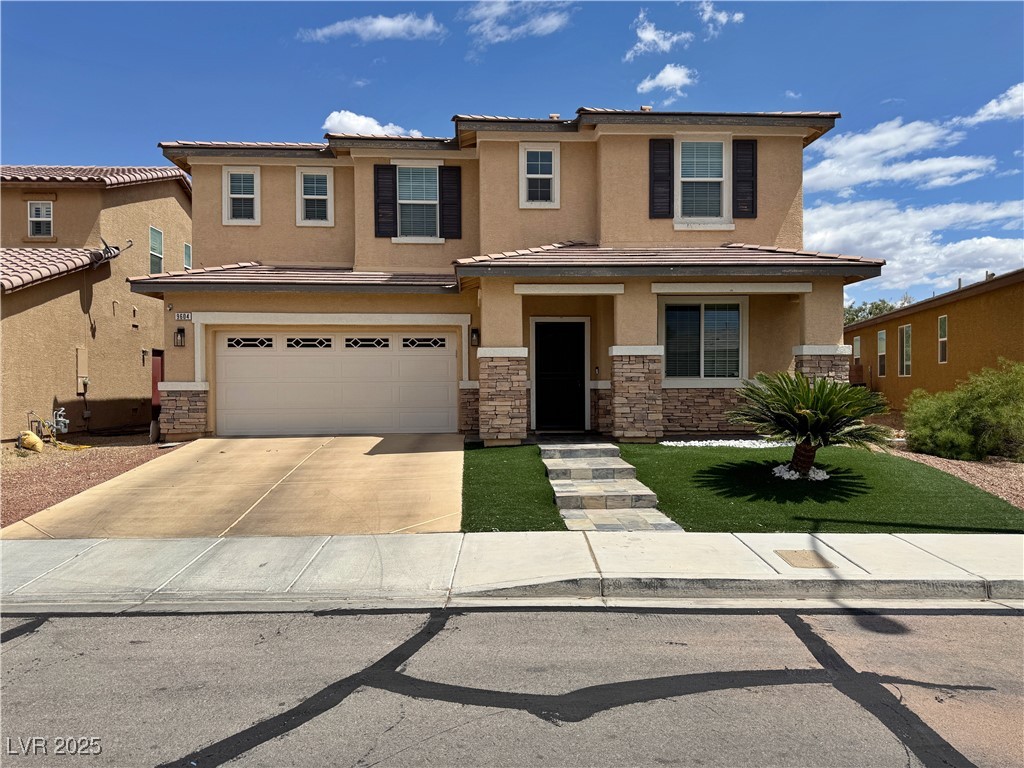
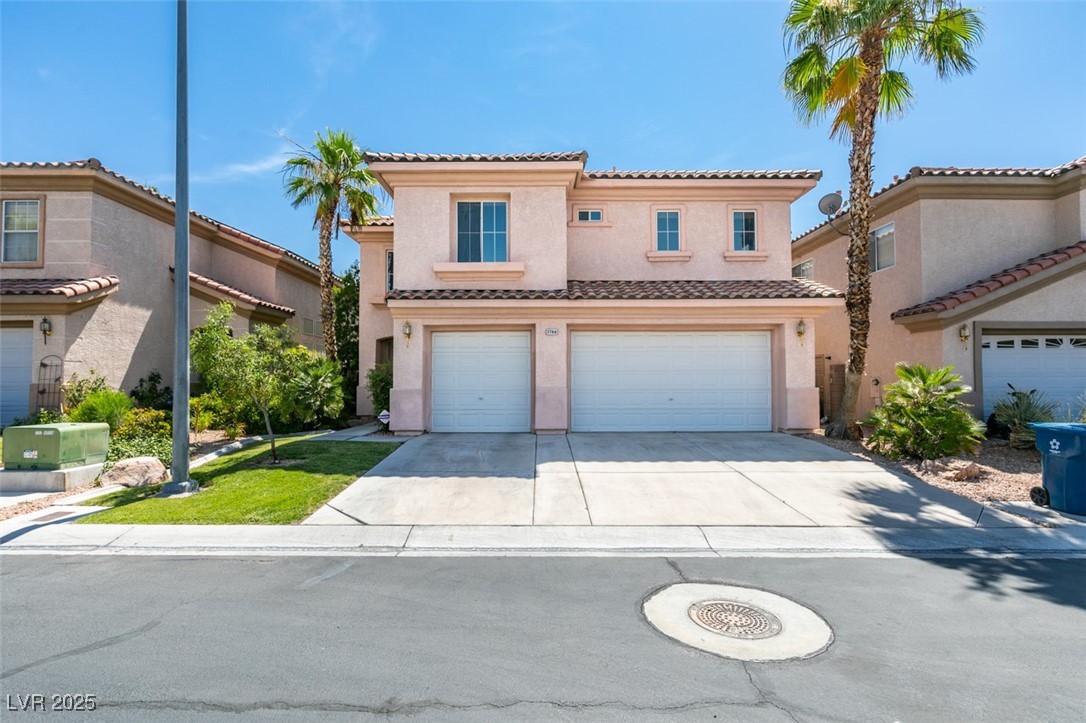
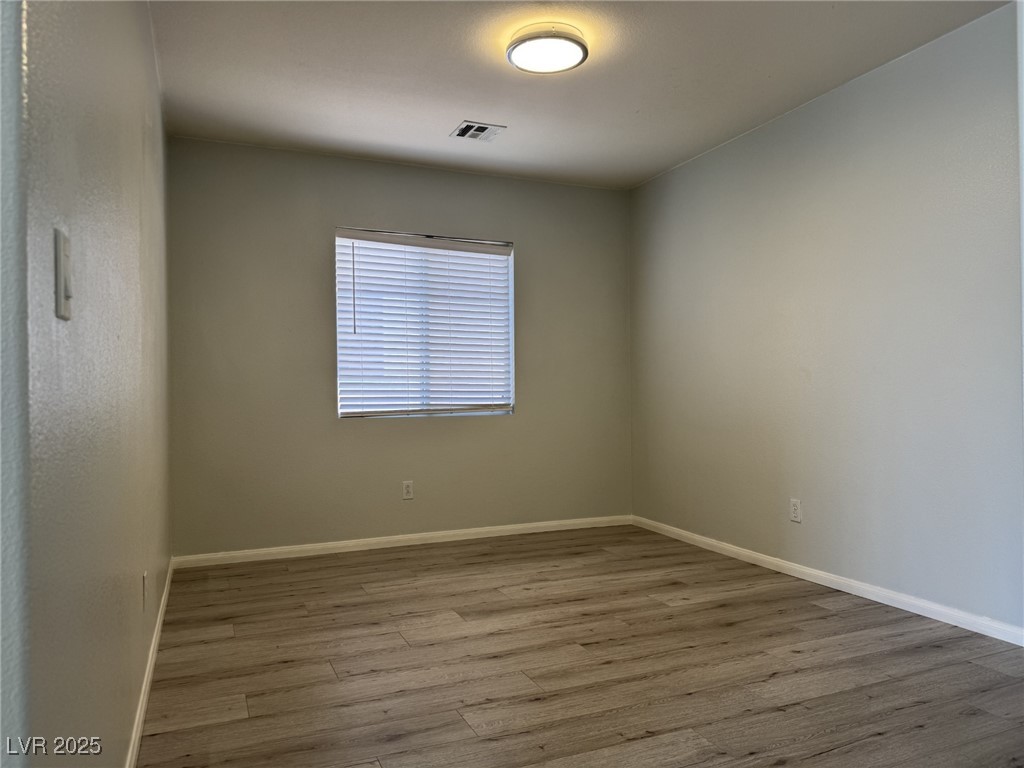
Active
$605,000
5
bds
|
3
ba
|
2,656
sqft
|
built
2013
9604 Vital Crest St, Las Vegas, NV 89123
$-1,582
Cash flow
-13.6%
Cash-on-Cash Return
3.1%
Cap rate
0.4%
Rent to Value Ratio
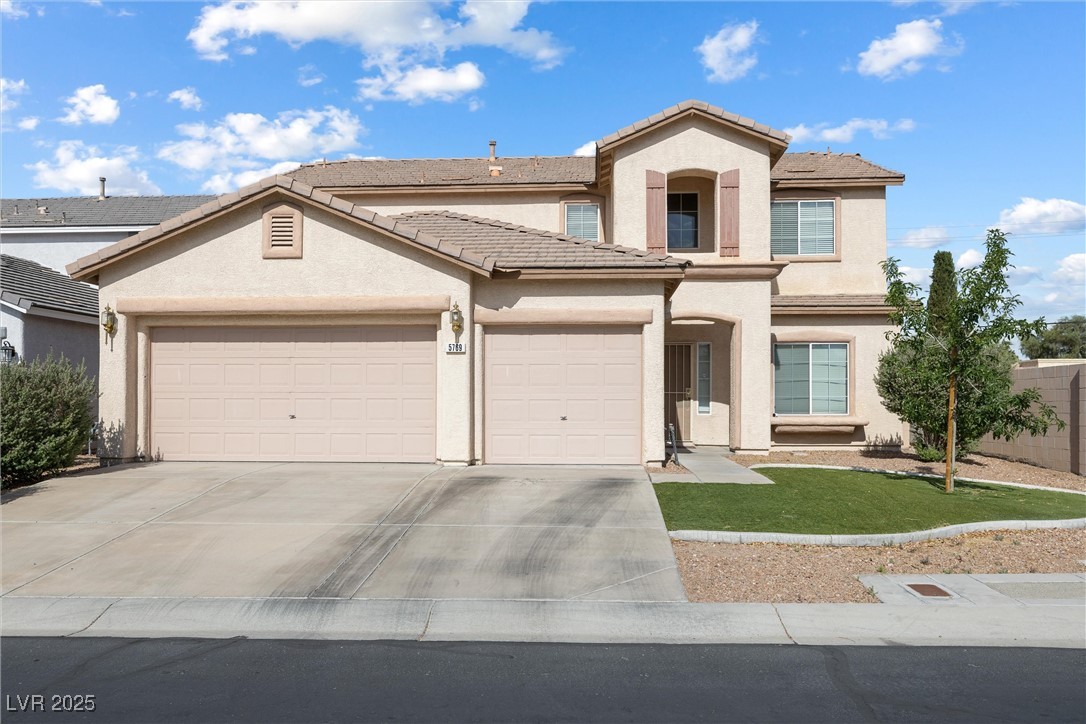
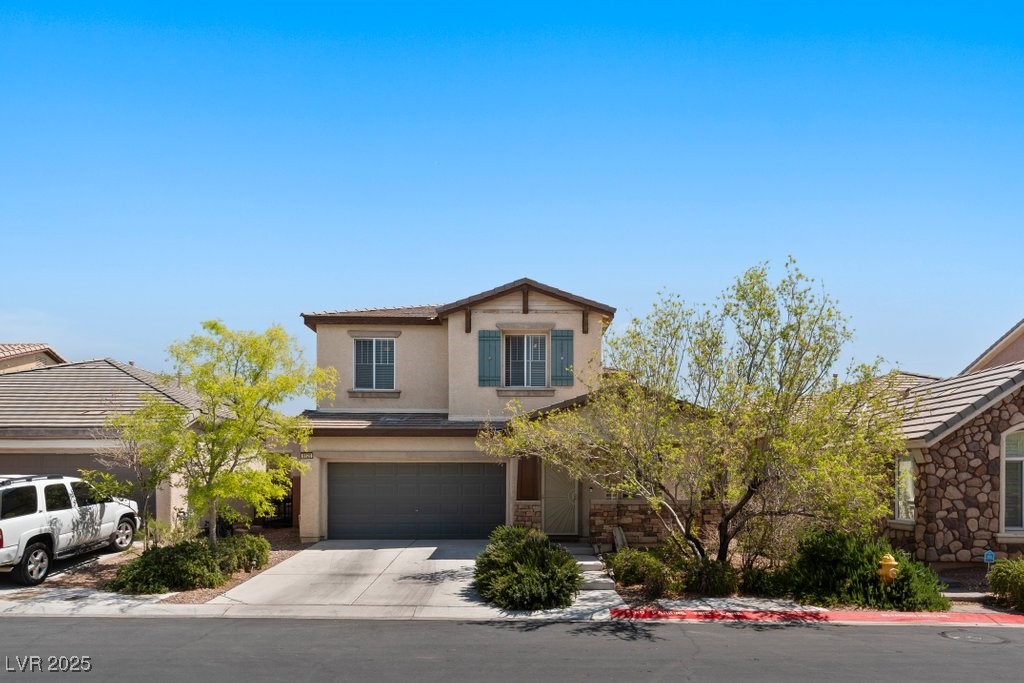
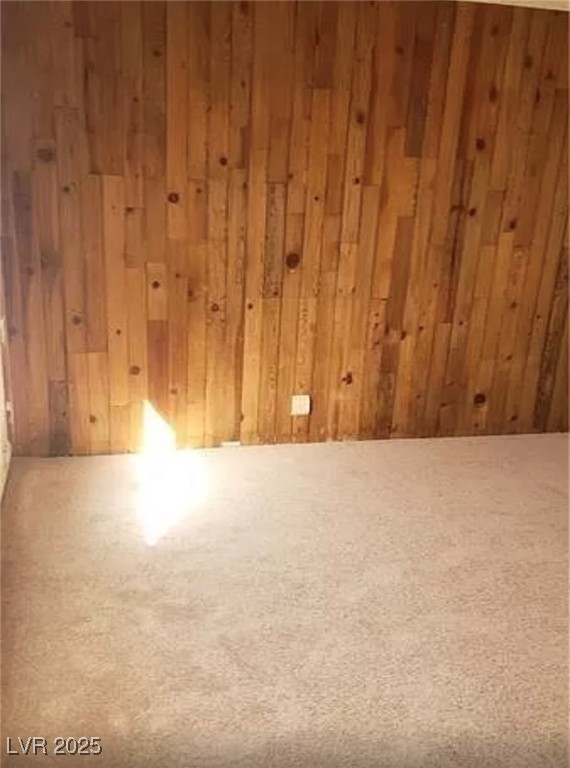
Active
$560,000
4
bds
|
3
ba
|
2,441
sqft
|
built
2003
5769 Larkdale St, Las Vegas, NV 89120
$-1,490
Cash flow
-13.9%
Cash-on-Cash Return
3.1%
Cap rate
0.4%
Rent to Value Ratio

Active
$349,900
2
bds
|
3
ba
|
1,614
sqft
|
built
2002
7270 Sheared Cliff Ln, Las Vegas, NV 89149
$-962
Cash flow
-14.3%
Cash-on-Cash Return
3.0%
Cap rate
0.6%
Rent to Value Ratio
Active
$299,900
2
bds
|
0
ba
|
910
sqft
|
built
1951
1140 Laurel Ave, Las Vegas, NV 89104
$-1,128
Cash flow
-19.6%
Cash-on-Cash Return
1.8%
Cap rate
0.2%
Rent to Value Ratio
Active
$519,999
4
bds
|
3
ba
|
2,109
sqft
|
built
2022
10376 Sadie Blake Ave, Las Vegas, NV 89166
$-1,578
Cash flow
-15.8%
Cash-on-Cash Return
2.6%
Cap rate
0.5%
Rent to Value Ratio
Active
$579,000
5
bds
|
4
ba
|
3,036
sqft
|
built
2001
3766 Port Ritchey St, Las Vegas, NV 89147
$-1,532
Cash flow
-13.8%
Cash-on-Cash Return
3.1%
Cap rate
0.5%
Rent to Value Ratio
Active
$515,000
3
bds
|
3
ba
|
2,428
sqft
|
built
2007
6620 Macdoogle St, Las Vegas, NV 89166
$-1,349
Cash flow
-13.7%
Cash-on-Cash Return
3.1%
Cap rate
0.5%
Rent to Value Ratio
Pending
$530,000
4
bds
|
2
ba
|
1,714
sqft
|
built
1983
4302 Newhaven Dr, Las Vegas, NV 89147
$-1,012
Cash flow
-10.0%
Cash-on-Cash Return
4.0%
Cap rate
0.5%
Rent to Value Ratio

Active
$685,000
3
bds
|
4
ba
|
1,857
sqft
|
built
2022
11551 Earth Stone Ave, Las Vegas, NV 89138
$-1,227
Cash flow
-9.3%
Cash-on-Cash Return
4.1%
Cap rate
0.6%
Rent to Value Ratio
Active
$475,000
3
bds
|
3
ba
|
1,951
sqft
|
built
2000
9614 Orchard Oasis Ct, Las Vegas, NV 89147
$-1,191
Cash flow
-13.1%
Cash-on-Cash Return
3.3%
Cap rate
0.4%
Rent to Value Ratio
Active
$515,000
3
bds
|
3
ba
|
1,683
sqft
|
built
2002
11029 Meadow Leaf Ave, Las Vegas, NV 89144
$-1,327
Cash flow
-13.4%
Cash-on-Cash Return
3.2%
Cap rate
0.5%
Rent to Value Ratio
Active
$779,900
3
bds
|
2
ba
|
2,719
sqft
|
built
1972
7990 Firethorn Ln, Las Vegas, NV 89123
$-2,302
Cash flow
-15.4%
Cash-on-Cash Return
2.7%
Cap rate
0.4%
Rent to Value Ratio
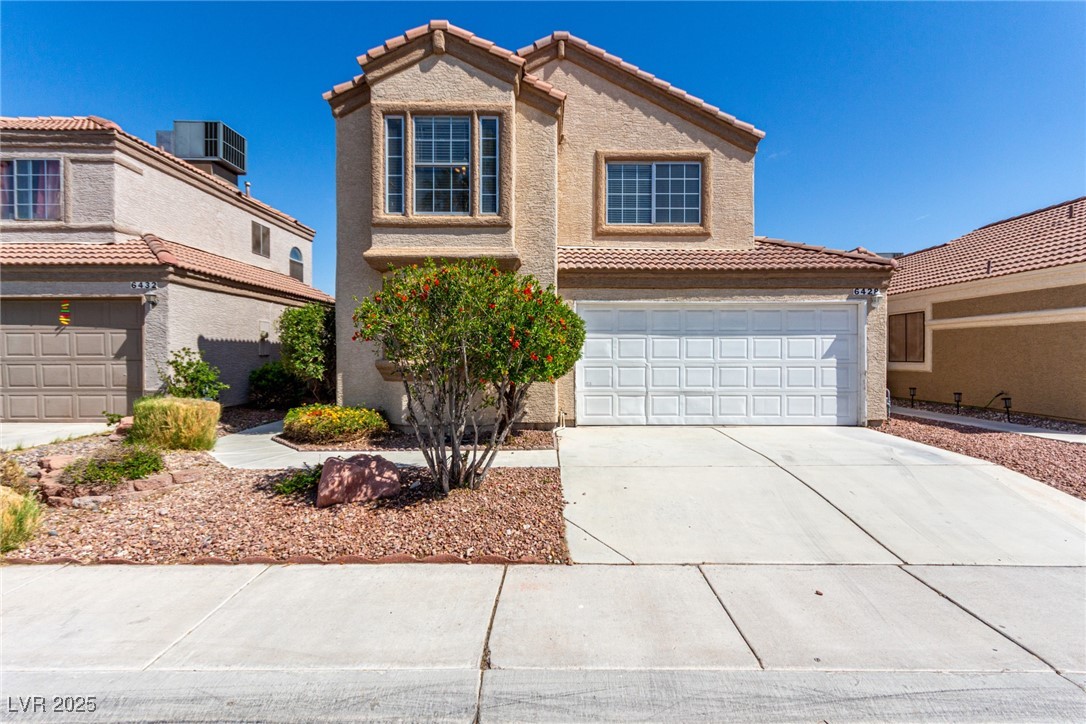
Active
$425,000
3
bds
|
2
ba
|
1,763
sqft
|
built
1989
6428 Yarmouth Dr, Las Vegas, NV 89108
$-1,058
Cash flow
-13.0%
Cash-on-Cash Return
3.3%
Cap rate
0.5%
Rent to Value Ratio
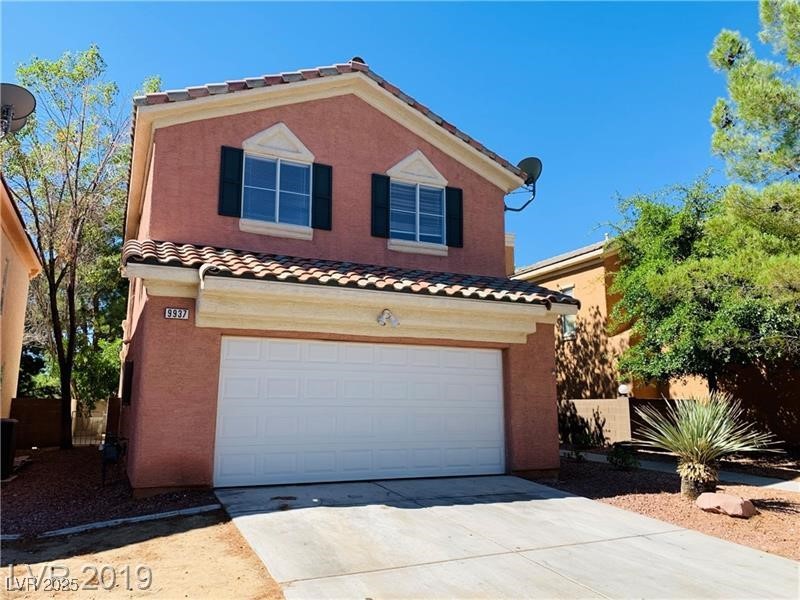
Active
$469,900
3
bds
|
3
ba
|
1,461
sqft
|
built
1997
9937 La Paca Ave, Las Vegas, NV 89117
$-1,451
Cash flow
-16.1%
Cash-on-Cash Return
2.6%
Cap rate
0.4%
Rent to Value Ratio
Active
$267,900
2
bds
|
2
ba
|
1,013
sqft
|
built
1985
6671 W Tropicana Ave, Las Vegas, NV 89103
$-950
Cash flow
-18.5%
Cash-on-Cash Return
2.0%
Cap rate
0.4%
Rent to Value Ratio
Active
$933,600
5
bds
|
4
ba
|
3,668
sqft
|
built
1996
8925 Rio Verde Ave, Las Vegas, NV 89147
$-2,435
Cash flow
-13.6%
Cash-on-Cash Return
3.2%
Cap rate
0.5%
Rent to Value Ratio

Active
$399,900
3
bds
|
3
ba
|
1,604
sqft
|
built
1991
5325 Sandstone Dr, Las Vegas, NV 89142
$-960
Cash flow
-12.5%
Cash-on-Cash Return
3.4%
Cap rate
0.5%
Rent to Value Ratio
Active
$629,900
5
bds
|
4
ba
|
3,765
sqft
|
built
2005
3608 Tundra Swan St, Las Vegas, NV 89122
$-1,548
Cash flow
-12.8%
Cash-on-Cash Return
3.3%
Cap rate
0.5%
Rent to Value Ratio
Active
$569,400
4
bds
|
2
ba
|
2,345
sqft
|
built
1999
5824 Kane Holly St, Las Vegas, NV 89130
$-1,426
Cash flow
-13.1%
Cash-on-Cash Return
3.3%
Cap rate
0.5%
Rent to Value Ratio
Active
$848,000
5
bds
|
4
ba
|
2,917
sqft
|
built
2014
12243 Pacific Cruise Ave, Las Vegas, NV 89138
$-3,006
Cash flow
-18.5%
Cash-on-Cash Return
2.0%
Cap rate
0.4%
Rent to Value Ratio
Active
$900,000
4
bds
|
3
ba
|
2,806
sqft
|
built
2004
11550 Velicata Ct, Las Vegas, NV 89138
$-2,412
Cash flow
-14.0%
Cash-on-Cash Return
3.1%
Cap rate
0.4%
Rent to Value Ratio
Active
$280,000
2
bds
|
2
ba
|
1,035
sqft
|
built
1995
8032 Astrology Ct, Las Vegas, NV 89128
$-738
Cash flow
-13.8%
Cash-on-Cash Return
3.1%
Cap rate
0.6%
Rent to Value Ratio
Active
$245,000
3
bds
|
2
ba
|
1,190
sqft
|
built
1993
5241 Caspian Springs Dr, Las Vegas, NV 89120
$-569
Cash flow
-12.1%
Cash-on-Cash Return
3.5%
Cap rate
0.7%
Rent to Value Ratio

Active
$900,000
4
bds
|
3
ba
|
3,043
sqft
|
built
1999
4722 Blue Mesa Way, Las Vegas, NV 89129
$-2,415
Cash flow
-14.0%
Cash-on-Cash Return
3.1%
Cap rate
0.4%
Rent to Value Ratio
Active
$375,000
2
bds
|
2
ba
|
1,002
sqft
|
built
2006
9431 Borough Park St, Las Vegas, NV 89178
$-956
Cash flow
-13.3%
Cash-on-Cash Return
3.2%
Cap rate
0.5%
Rent to Value Ratio

Active
$385,900
3
bds
|
2
ba
|
1,384
sqft
|
built
1999
8120 Backpacker Ct, Las Vegas, NV 89131
$-791
Cash flow
-10.7%
Cash-on-Cash Return
3.8%
Cap rate
0.5%
Rent to Value Ratio
Active
$584,900
5
bds
|
3
ba
|
2,552
sqft
|
built
2005
9161 Dutch Oven Ct, Las Vegas, NV 89178
$-1,874
Cash flow
-16.7%
Cash-on-Cash Return
2.4%
Cap rate
0.4%
Rent to Value Ratio
Active
$349,900
2
bds
|
2
ba
|
904
sqft
|
built
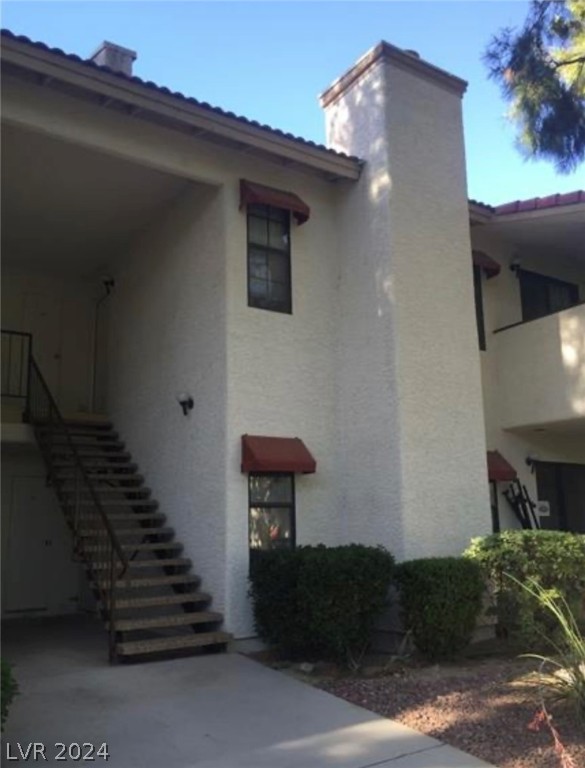
1982
8813 Pavia Dr, Las Vegas, NV 89117
$-793
Cash flow
-11.8%
Cash-on-Cash Return
3.6%
Cap rate
0.5%
Rent to Value Ratio
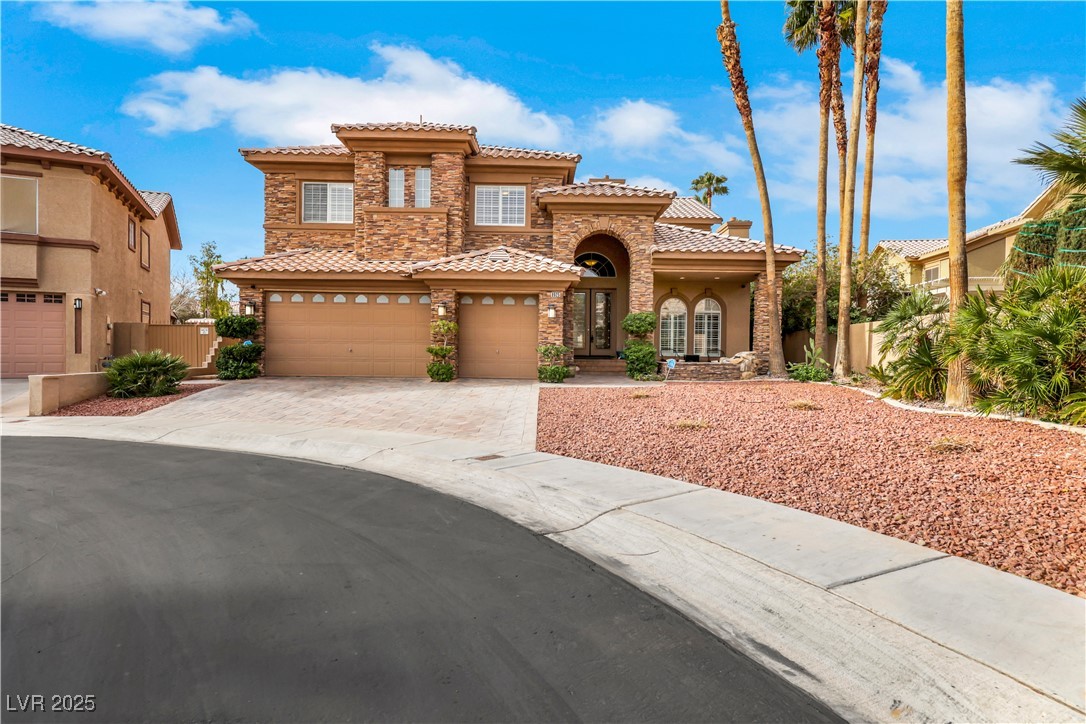
Active
$875,000
3
bds
|
3
ba
|
2,871
sqft
|
built
1986
4941 Tierra Del Sol Dr, Las Vegas, NV 89113
$-2,058
Cash flow
-12.3%
Cash-on-Cash Return
3.5%
Cap rate
0.6%
Rent to Value Ratio
Active
$360,000
3
bds
|
2
ba
|
1,446
sqft
|
built
1981
804 S Mallard St, Las Vegas, NV 89107
$-659
Cash flow
-9.6%
Cash-on-Cash Return
4.1%
Cap rate
0.5%
Rent to Value Ratio
Active
$640,000
4
bds
|
3
ba
|
2,238
sqft
|
built
1988
9704 Falling Star Ave, Las Vegas, NV 89117
$-1,878
Cash flow
-15.3%
Cash-on-Cash Return
2.8%
Cap rate
0.4%
Rent to Value Ratio
Active
$699,900
4
bds
|
3
ba
|
2,214
sqft
|
built
2003
9843 Wonderful Day Dr, Las Vegas, NV 89148
$-1,867
Cash flow
-13.9%
Cash-on-Cash Return
3.1%
Cap rate
0.4%
Rent to Value Ratio
Active
$305,000
2
bds
|
2
ba
|
940
sqft
|
built
1999
2615 W Gary Ave, Las Vegas, NV 89123
$-947
Cash flow
-16.2%
Cash-on-Cash Return
2.6%
Cap rate
0.5%
Rent to Value Ratio
Active
$738,500
3
bds
|
3
ba
|
2,470
sqft
|
built
2006
617 Apricot Rose Pl, Las Vegas, NV 89138
$-2,293
Cash flow
-16.2%
Cash-on-Cash Return
2.6%
Cap rate
0.4%
Rent to Value Ratio

Active
$669,999
3
bds
|
3
ba
|
2,450
sqft
|
built
2018
8405 Canyon Crevasse St, Las Vegas, NV 89166
$-1,974
Cash flow
-15.4%
Cash-on-Cash Return
2.7%
Cap rate
0.5%
Rent to Value Ratio
Active
$529,999
3
bds
|
3
ba
|
2,232
sqft
|
built
1992
8432 Apple Hill Ct, Las Vegas, NV 89128
$-1,385
Cash flow
-13.6%
Cash-on-Cash Return
3.1%
Cap rate
0.5%
Rent to Value Ratio
Active
$589,000
4
bds
|
4
ba
|
2,745
sqft
|
built
2023
10376 Joaquin Fire St, Las Vegas, NV 89141
$-1,664
Cash flow
-14.7%
Cash-on-Cash Return
2.9%
Cap rate
0.5%
Rent to Value Ratio
Active
$829,000
5
bds
|
4
ba
|
3,662
sqft
|
built
2016
8797 Pinley Spring St, Las Vegas, NV 89113
$-1,787
Cash flow
-11.2%
Cash-on-Cash Return
3.7%
Cap rate
0.5%
Rent to Value Ratio

Active under contract
$600,000
1
bds
|
1
ba
|
843
sqft
|
built
2007
3726 Las Vegas Blvd S, Las Vegas, NV 89158
$-2,395
Cash flow
-20.8%
Cash-on-Cash Return
1.5%
Cap rate
0.5%
Rent to Value Ratio
Active
$775,000
3
bds
|
3
ba
|
2,363
sqft
|
built
2023
8929 Cassia Winds St, Las Vegas, NV 89166
$-2,151
Cash flow
-14.5%
Cash-on-Cash Return
3.0%
Cap rate
0.5%
Rent to Value Ratio