Las Vegas, NV Investment Properties for Sale
Browse homes for sale and investment properties in Las Vegas, NV. Refine your search by price, property type, or more.
Best cash flowing properties in Las Vegas, NV
Active
$150,000
1
bds
|
1
ba
|
700
sqft
|
built
1982
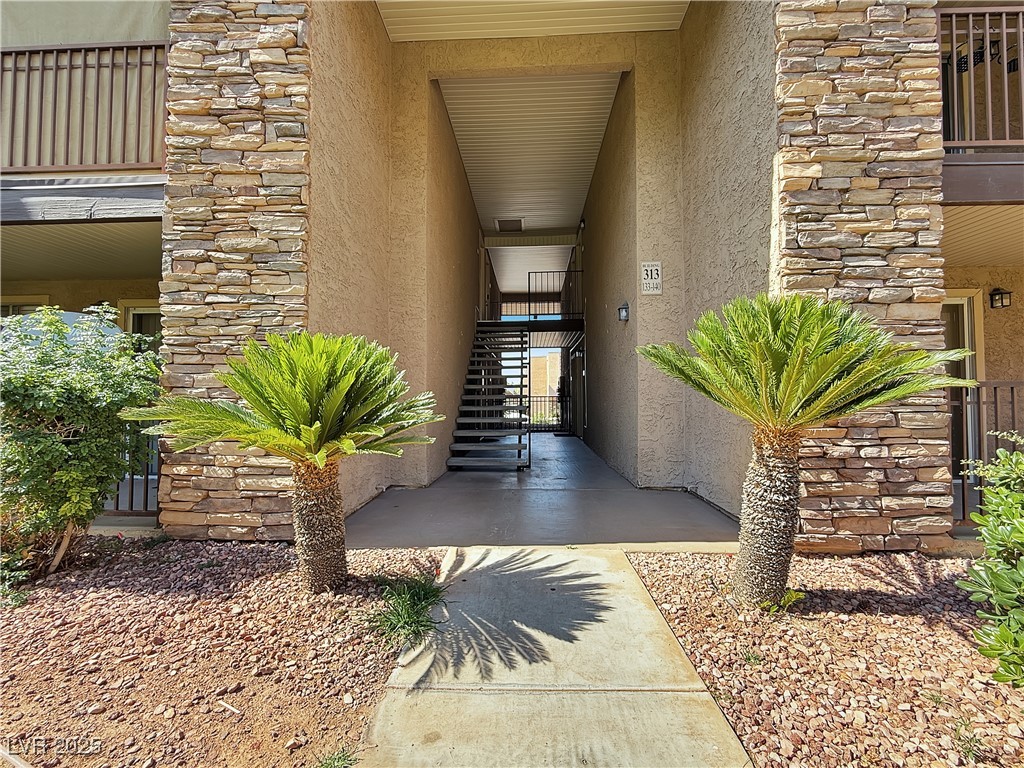
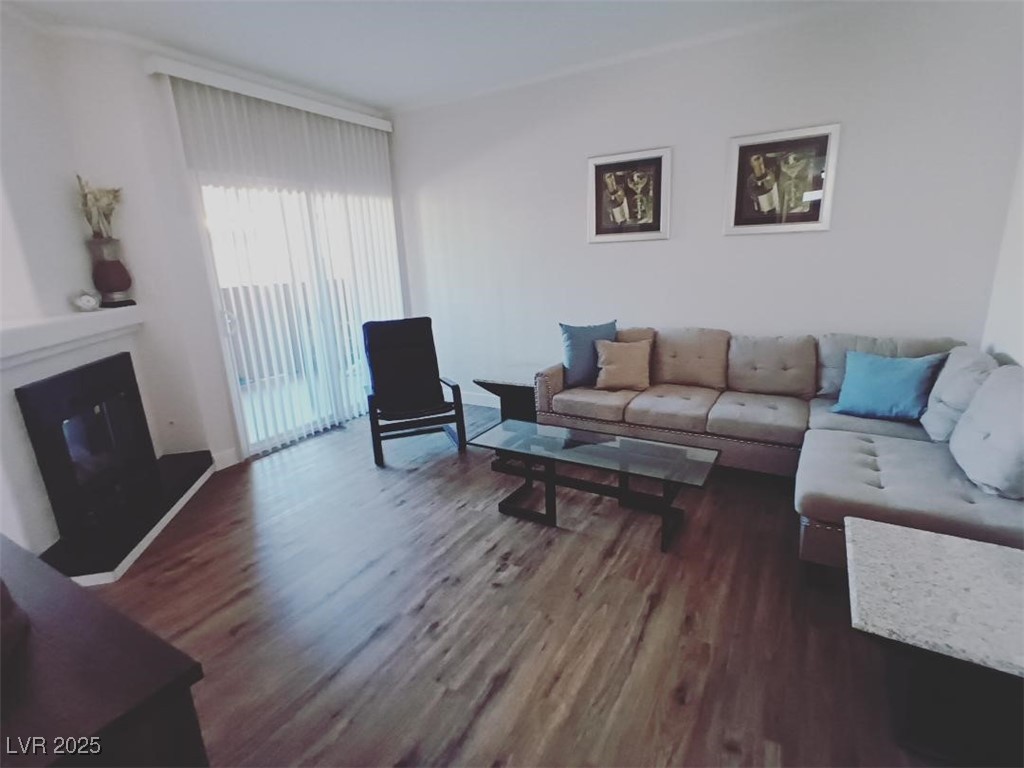
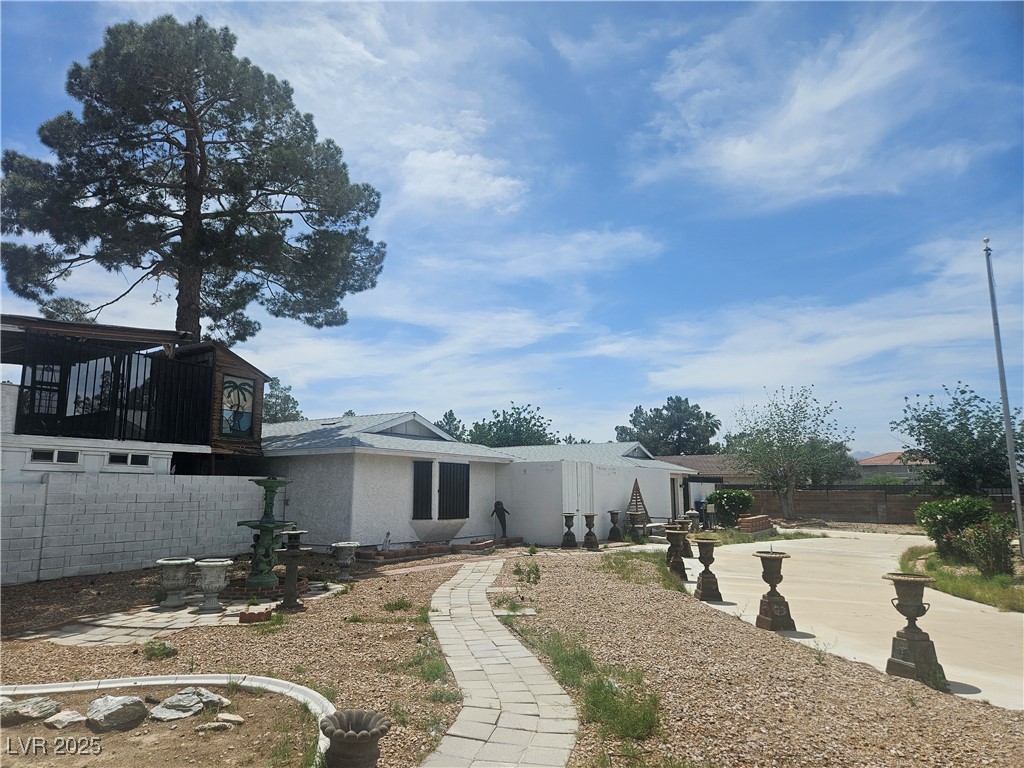
4943 Indian River Dr, Las Vegas, NV 89103
$-170
Cash flow
-5.9%
Cash-on-Cash Return
4.3%
Cap rate
0.8%
Rent to Value Ratio
Active
$285,000
2
bds
|
2
ba
|
1,131
sqft
|
built
1996
9000 Las Vegas Blvd S, Las Vegas, NV 89123
$-371
Cash flow
-6.8%
Cash-on-Cash Return
4.1%
Cap rate
0.7%
Rent to Value Ratio
5,558 out of 5,689 properties for sale in Las Vegas, NV
Limited Results Shown
Create a free account, or log in to reveal all property listings and enjoy the complete experience.
Active
$534,888
4
bds
|
3
ba
|
2,328
sqft
|
built
2019
6442 Kobe Knoll Ct, Las Vegas, NV 89141
$-1,498
Cash flow
-14.6%
Cash-on-Cash Return
2.3%
Cap rate
0.4%
Rent to Value Ratio
Active
$699,000
2
bds
|
2
ba
|
1,856
sqft
|
built
1974
3111 Bel Air Dr, Las Vegas, NV 89109
$-2,690
Cash flow
-20.1%
Cash-on-Cash Return
1.1%
Cap rate
0.4%
Rent to Value Ratio
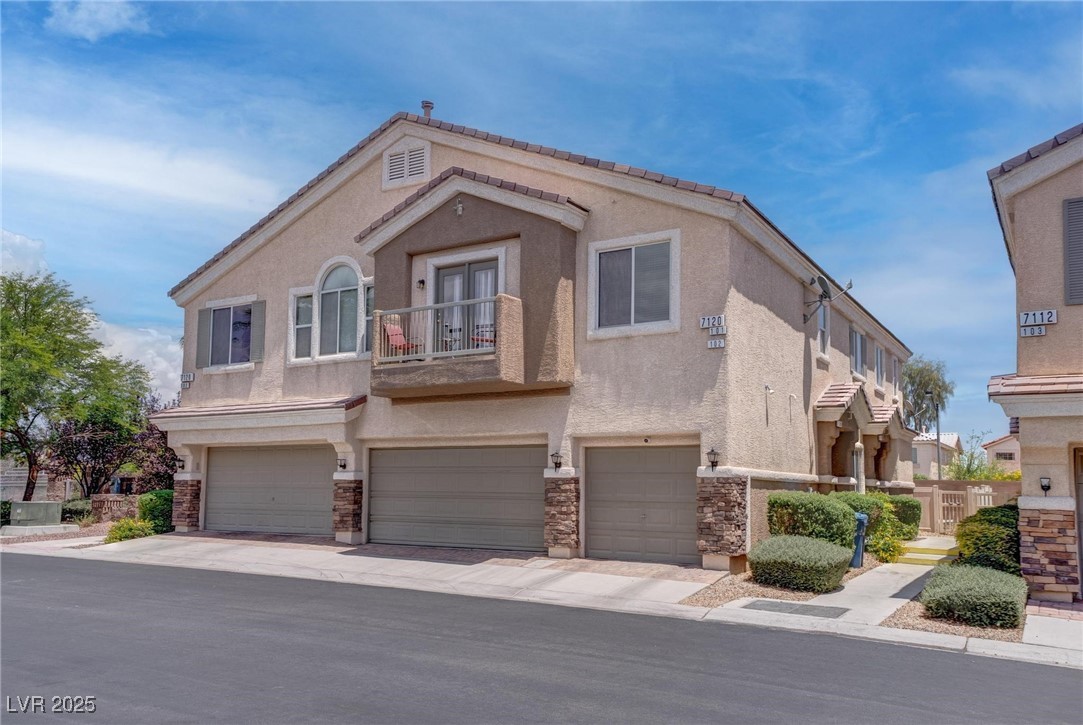
Active
$307,500
2
bds
|
2
ba
|
1,183
sqft
|
built
2006
7120 Bear Paw Creek St, Las Vegas, NV 89149
$-602
Cash flow
-10.2%
Cash-on-Cash Return
3.3%
Cap rate
0.5%
Rent to Value Ratio
Active
$799,000
5
bds
|
3
ba
|
4,448
sqft
|
built
2006
8093 Luna Sera Ave, Las Vegas, NV 89178
$-2,019
Cash flow
-13.2%
Cash-on-Cash Return
2.6%
Cap rate
0.4%
Rent to Value Ratio
Active
$550,000
7
bds
|
4
ba
|
3,749
sqft
|
built
2005
3689 Bufflehead St, Las Vegas, NV 89122
$-932
Cash flow
-8.8%
Cash-on-Cash Return
3.6%
Cap rate
0.5%
Rent to Value Ratio
Active under contract
$337,000
3
bds
|
2
ba
|
1,244
sqft
|
built
1995
5528 Morningcross St, Las Vegas, NV 89130
$-544
Cash flow
-8.4%
Cash-on-Cash Return
3.7%
Cap rate
0.5%
Rent to Value Ratio
Active
$549,000
3
bds
|
3
ba
|
2,105
sqft
|
built
1978
6215 Darby Ave, Las Vegas, NV 89146
$-863
Cash flow
-8.2%
Cash-on-Cash Return
3.8%
Cap rate
0.5%
Rent to Value Ratio
Active
$675,000
4
bds
|
3
ba
|
2,597
sqft
|
built
2022
10300 Stroma Ave, Las Vegas, NV 89166
$-2,025
Cash flow
-15.7%
Cash-on-Cash Return
2.1%
Cap rate
0.4%
Rent to Value Ratio

Active
$574,900
3
bds
|
3
ba
|
2,475
sqft
|
built
1996
2033 Summer Spruce Pl, Las Vegas, NV 89134
$-1,676
Cash flow
-15.2%
Cash-on-Cash Return
2.2%
Cap rate
0.4%
Rent to Value Ratio
Active
$410,000
3
bds
|
3
ba
|
2,071
sqft
|
built
2007
9312 Gold Dove Ct, Las Vegas, NV 89178
$-843
Cash flow
-10.7%
Cash-on-Cash Return
3.2%
Cap rate
0.5%
Rent to Value Ratio
Active
$385,000
3
bds
|
3
ba
|
1,626
sqft
|
built
2005
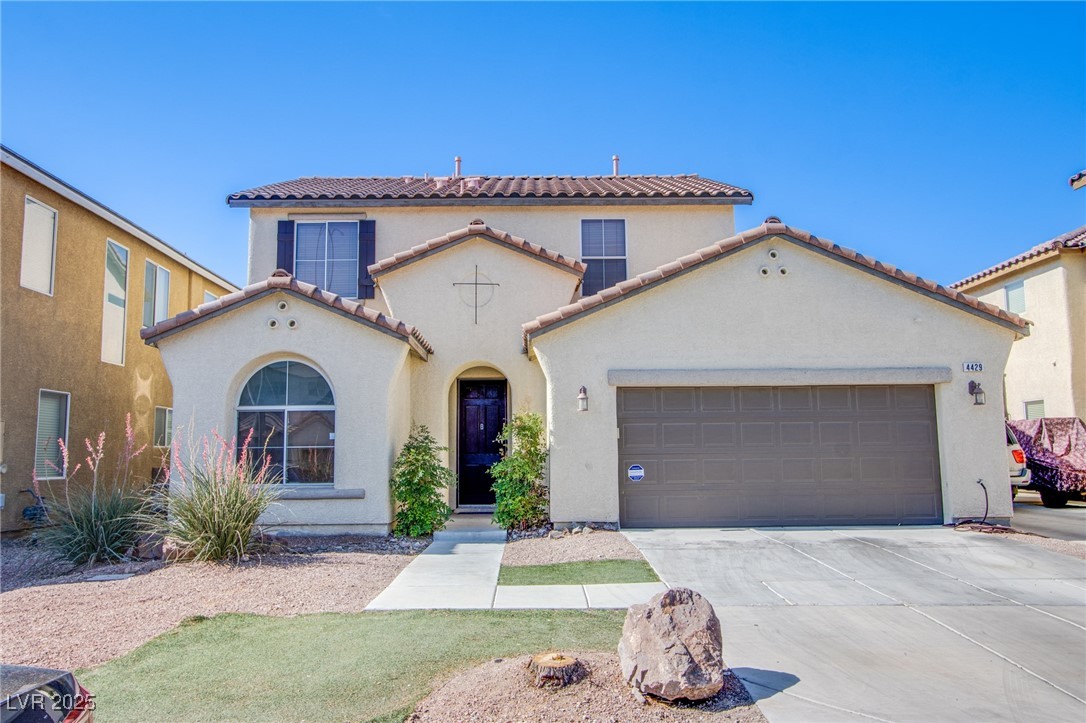
4429 E Azure Ave, Las Vegas, NV 89115
$-639
Cash flow
-8.7%
Cash-on-Cash Return
3.7%
Cap rate
0.5%
Rent to Value Ratio
Active
$620,000
3
bds
|
4
ba
|
2,034
sqft
|
built
1986
3080 Yankee Clipper Dr, Las Vegas, NV 89117
$-1,494
Cash flow
-12.6%
Cash-on-Cash Return
2.8%
Cap rate
0.5%
Rent to Value Ratio
Active
$569,000
4
bds
|
2
ba
|
2,304
sqft
|
built
2001
5808 Spinnaker Reach Ave, Las Vegas, NV 89130
$-1,597
Cash flow
-14.6%
Cash-on-Cash Return
2.3%
Cap rate
0.4%
Rent to Value Ratio
Active
$765,900
5
bds
|
3
ba
|
3,490
sqft
|
built
1990
8232 Ocean Terrace Way, Las Vegas, NV 89128
$-934
Cash flow
-6.4%
Cash-on-Cash Return
4.2%
Cap rate
0.6%
Rent to Value Ratio
Active
$415,000
3
bds
|
2
ba
|
1,588
sqft
|
built
1984
1620 Yellow Rose St, Las Vegas, NV 89108
$-758
Cash flow
-9.5%
Cash-on-Cash Return
3.5%
Cap rate
0.5%
Rent to Value Ratio
Active
$1,298,888
4
bds
|
3
ba
|
3,151
sqft
|
built
2001
1016 Eaglewood Dr, Las Vegas, NV 89144
$-4,639
Cash flow
-18.6%
Cash-on-Cash Return
1.4%
Cap rate
0.2%
Rent to Value Ratio
Active
$868,000
5
bds
|
3
ba
|
3,676
sqft
|
built
1997
7411 Brittlethorne Ave, Las Vegas, NV 89131
$-2,319
Cash flow
-13.9%
Cash-on-Cash Return
2.5%
Cap rate
0.4%
Rent to Value Ratio
Active
$259,000
2
bds
|
2
ba
|
920
sqft
|
built
1989
5166 S Jones Blvd, Las Vegas, NV 89118
$-701
Cash flow
-14.1%
Cash-on-Cash Return
2.4%
Cap rate
0.5%
Rent to Value Ratio
Active
$150,000
1
bds
|
1
ba
|
700
sqft
|
built
1982
4943 Indian River Dr, Las Vegas, NV 89103
$-170
Cash flow
-5.9%
Cash-on-Cash Return
4.3%
Cap rate
0.8%
Rent to Value Ratio
Active
$445,000
1
bds
|
2
ba
|
874
sqft
|
built
2006
135 E Harmon Ave, Las Vegas, NV 89109
$-2,168
Cash flow
-25.4%
Cash-on-Cash Return
-0.2%
Cap rate
0.7%
Rent to Value Ratio
Active
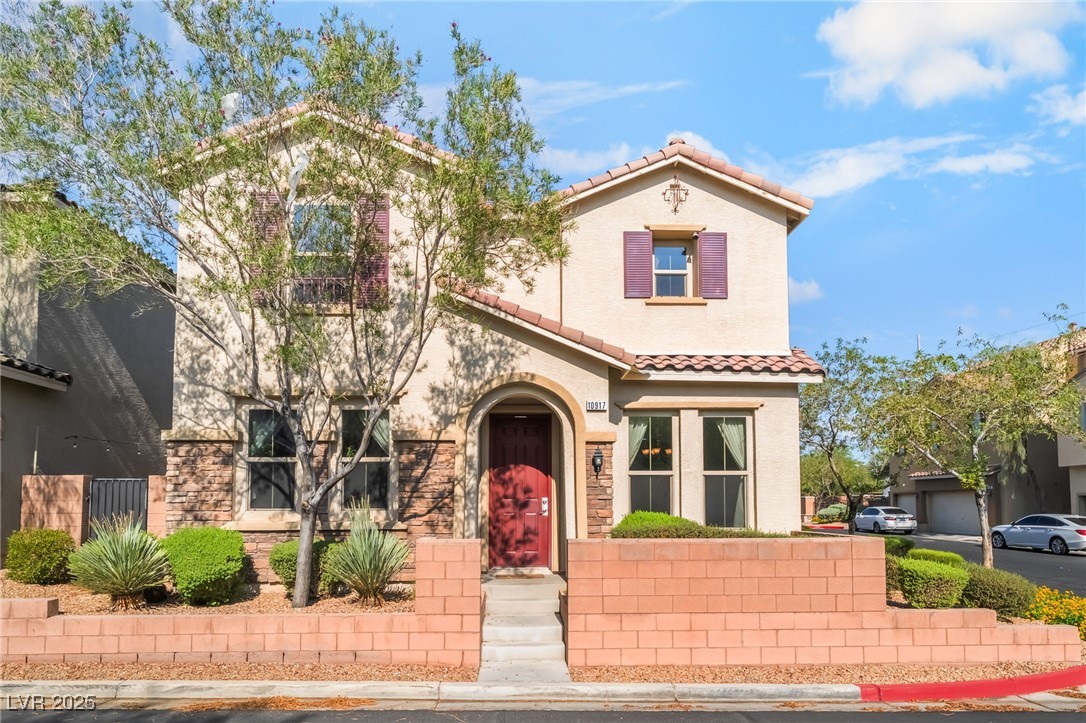
$497,000
4
bds
|
3
ba
|
2,630
sqft
|
built
2013
10917 Mount Pendleton St, Las Vegas, NV 89179
$-1,014
Cash flow
-10.6%
Cash-on-Cash Return
3.2%
Cap rate
0.5%
Rent to Value Ratio
Active
$1,250,000
4
bds
|
4
ba
|
3,578
sqft
|
built
2003
10249 Wisteria Hills Ct, Las Vegas, NV 89135
$-3,445
Cash flow
-14.4%
Cash-on-Cash Return
2.4%
Cap rate
0.4%
Rent to Value Ratio
Active
$459,000
1
bds
|
2
ba
|
874
sqft
|
built
2005
145 E Harmon Ave, Las Vegas, NV 89109
$-3,686
Cash flow
-41.9%
Cash-on-Cash Return
-4.0%
Cap rate
0.6%
Rent to Value Ratio

Active
$985,000
4
bds
|
4
ba
|
3,290
sqft
|
built
2004
8216 Tursi Lodge Ct, Las Vegas, NV 89131
$-2,418
Cash flow
-12.8%
Cash-on-Cash Return
2.7%
Cap rate
0.4%
Rent to Value Ratio
Active
$465,000
3
bds
|
3
ba
|
1,749
sqft
|
built
2005
3591 Gloucester Gate St, Las Vegas, NV 89122
$-863
Cash flow
-9.7%
Cash-on-Cash Return
3.5%
Cap rate
0.5%
Rent to Value Ratio
Active
$479,000
3
bds
|
3
ba
|
1,635
sqft
|
built
1989
125 Firecreek Cir, Las Vegas, NV 89107
$-961
Cash flow
-10.5%
Cash-on-Cash Return
3.3%
Cap rate
0.5%
Rent to Value Ratio
Active
$480,000
3
bds
|
3
ba
|
2,024
sqft
|
built
2004
9122 Mountain Maple Ct, Las Vegas, NV 89148
$-1,128
Cash flow
-12.3%
Cash-on-Cash Return
2.9%
Cap rate
0.4%
Rent to Value Ratio
Active
$299,000
3
bds
|
2
ba
|
1,261
sqft
|
built
2006
7701 W Robindale Rd, Las Vegas, NV 89113
$-639
Cash flow
-11.2%
Cash-on-Cash Return
3.1%
Cap rate
0.5%
Rent to Value Ratio
Active
$260,000
2
bds
|
2
ba
|
1,028
sqft
|
built
2004
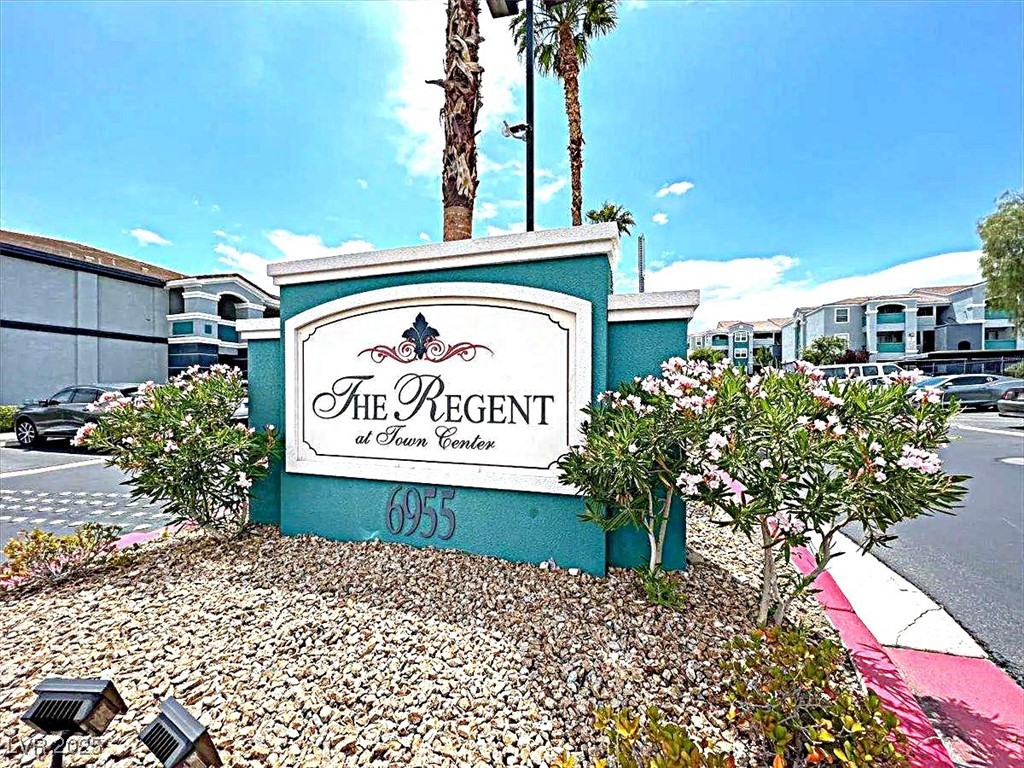
6955 N Durango Dr, Las Vegas, NV 89149
$-436
Cash flow
-8.7%
Cash-on-Cash Return
3.7%
Cap rate
0.6%
Rent to Value Ratio
Active
$500,000
4
bds
|
3
ba
|
2,261
sqft
|
built
2017
7948 Eastern Elk St, Las Vegas, NV 89149
$-1,092
Cash flow
-11.4%
Cash-on-Cash Return
3.1%
Cap rate
0.5%
Rent to Value Ratio
Active
$2,100,000
4
bds
|
6
ba
|
5,249
sqft
|
built
2003
2285 Villefort Ct, Las Vegas, NV 89117
$-5,062
Cash flow
-12.6%
Cash-on-Cash Return
2.8%
Cap rate
0.4%
Rent to Value Ratio
Active
$689,999
5
bds
|
5
ba
|
3,971
sqft
|
built
2013
5448 Tulip Hill Ave, Las Vegas, NV 89141
$-1,332
Cash flow
-10.1%
Cash-on-Cash Return
3.4%
Cap rate
0.5%
Rent to Value Ratio
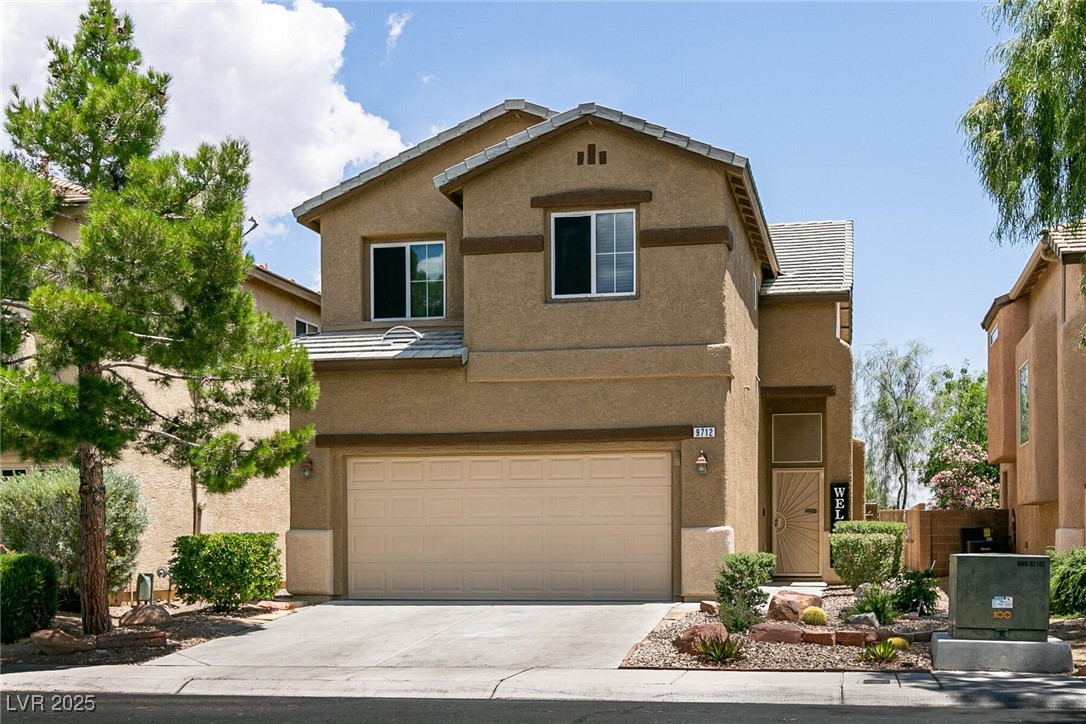
Pending
$469,900
5
bds
|
3
ba
|
1,954
sqft
|
built
2004
9712 Red Horse St, Las Vegas, NV 89143
$-734
Cash flow
-8.1%
Cash-on-Cash Return
3.8%
Cap rate
0.5%
Rent to Value Ratio
Active
$378,500
4
bds
|
2
ba
|
1,477
sqft
|
built
1955
2105 Berkley Ave, Las Vegas, NV 89101
$-732
Cash flow
-10.1%
Cash-on-Cash Return
3.4%
Cap rate
0.4%
Rent to Value Ratio
Active
$539,900
3
bds
|
3
ba
|
2,494
sqft
|
built
1998
7517 Apple Cider St, Las Vegas, NV 89131
$-1,365
Cash flow
-13.2%
Cash-on-Cash Return
2.6%
Cap rate
0.4%
Rent to Value Ratio
Active
$435,000
4
bds
|
2
ba
|
1,828
sqft
|
built
1963
4324 El Conlon Ave, Las Vegas, NV 89102
$-914
Cash flow
-11.0%
Cash-on-Cash Return
3.2%
Cap rate
0.4%
Rent to Value Ratio
Active
$485,000
3
bds
|
2
ba
|
1,680
sqft
|
built
1997
3640 Snowy Pines St, Las Vegas, NV 89147
$-1,002
Cash flow
-10.8%
Cash-on-Cash Return
3.2%
Cap rate
0.5%
Rent to Value Ratio
Active
$285,000
2
bds
|
2
ba
|
1,131
sqft
|
built
1996
9000 Las Vegas Blvd S, Las Vegas, NV 89123
$-371
Cash flow
-6.8%
Cash-on-Cash Return
4.1%
Cap rate
0.7%
Rent to Value Ratio
Active
$532,990
4
bds
|
3
ba
|
2,034
sqft
|
built
1985
3200 Mariner Bay St, Las Vegas, NV 89117
$-813
Cash flow
-8.0%
Cash-on-Cash Return
3.8%
Cap rate
0.5%
Rent to Value Ratio
Active
$420,000
4
bds
|
3
ba
|
1,937
sqft
|
built
2004
9053 Starling Wing Pl, Las Vegas, NV 89143
$-855
Cash flow
-10.6%
Cash-on-Cash Return
3.2%
Cap rate
0.5%
Rent to Value Ratio