Las Vegas, NV Investment Properties for Sale
Browse homes for sale and investment properties in Las Vegas, NV. Refine your search by price, property type, or more.
Best cash flowing properties in Las Vegas, NV
Active
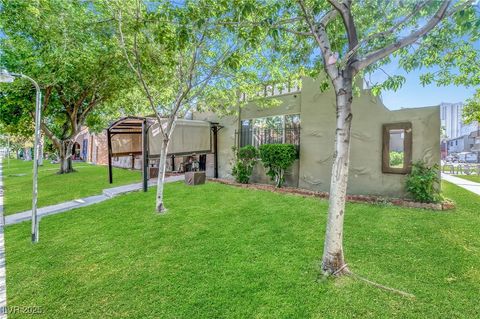
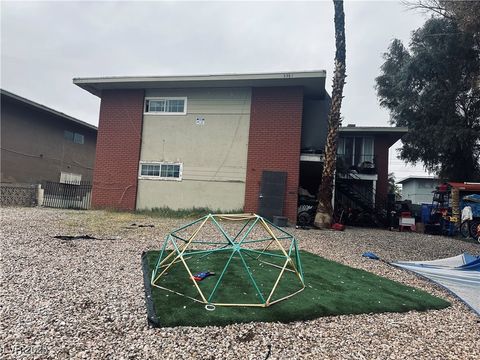
$210,000
2
bds
|
1
ba
|
1,000
sqft
|
built
1973
4614 Grand Dr, Las Vegas, NV 89169
$-201
Cash flow
-5.0%
Cash-on-Cash Return
5.1%
Cap rate
0.9%
Rent to Value Ratio
Active
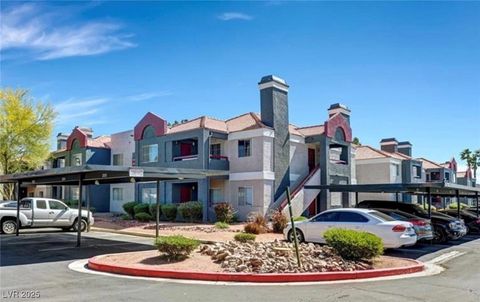
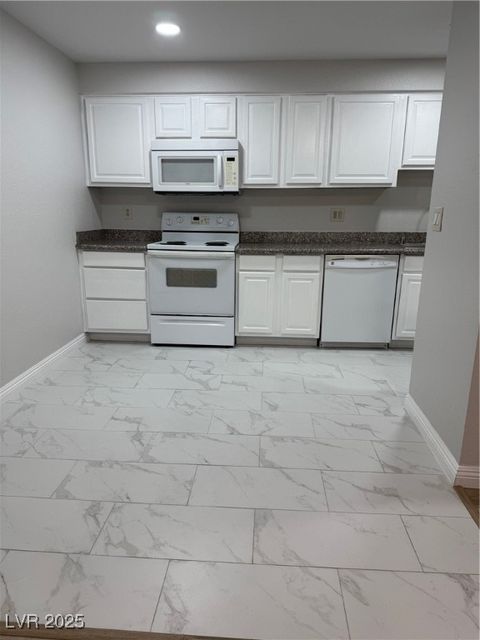
$205,000
1
bds
|
1
ba
|
700
sqft
|
built
1982
4981 River Glen Dr, Las Vegas, NV 89103
$-397
Cash flow
-10.1%
Cash-on-Cash Return
3.9%
Cap rate
0.7%
Rent to Value Ratio
6,275 out of 6,409 properties for sale in Las Vegas, NV
Limited Results Shown
Create a free account, or log in to reveal all property listings and enjoy the complete experience.

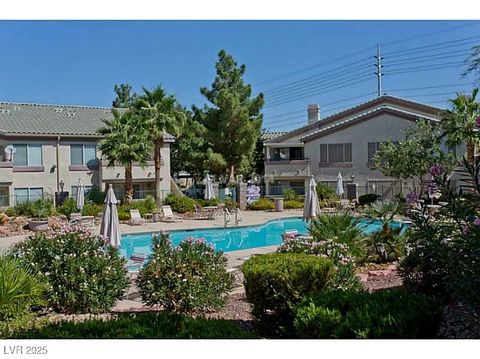
Active
$259,500
2
bds
|
2
ba
|
912
sqft
|
built
1988
1009 Sulphur Springs Ln, Las Vegas, NV 89128
$-588
Cash flow
-11.8%
Cash-on-Cash Return
3.5%
Cap rate
0.6%
Rent to Value Ratio
Active
$365,000
2
bds
|
2
ba
|
1,269
sqft
|
built
1998
913 Duckhorn Ct, Las Vegas, NV 89144
$-1,117
Cash flow
-16.0%
Cash-on-Cash Return
2.6%
Cap rate
0.5%
Rent to Value Ratio
Active
$276,040
2
bds
|
2
ba
|
998
sqft
|
built
1990
8600 W Charleston Blvd, Las Vegas, NV 89117
$-885
Cash flow
-16.7%
Cash-on-Cash Return
2.4%
Cap rate
0.5%
Rent to Value Ratio

Active
$219,900
2
bds
|
2
ba
|
1,015
sqft
|
built
1982
2981 Country Manor Ln, Las Vegas, NV 89115
$-692
Cash flow
-16.4%
Cash-on-Cash Return
2.5%
Cap rate
0.5%
Rent to Value Ratio
Active
$249,999
3
bds
|
2
ba
|
1,222
sqft
|
built
1999
5710 E Tropicana Ave, Las Vegas, NV 89122
$-499
Cash flow
-10.4%
Cash-on-Cash Return
3.9%
Cap rate
0.6%
Rent to Value Ratio
Active
$699,000
9
bds
|
0
ba
|
3,336
sqft
|
built
1963
3381 Brussels St, Las Vegas, NV 89169
$-2,705
Cash flow
-20.2%
Cash-on-Cash Return
1.6%
Cap rate
0.2%
Rent to Value Ratio

Active
$189,900
1
bds
|
1
ba
|
717
sqft
|
built
1998
4400 S Jones Blvd, Las Vegas, NV 89103
$-555
Cash flow
-15.2%
Cash-on-Cash Return
2.8%
Cap rate
0.6%
Rent to Value Ratio
Active
$260,000
2
bds
|
1
ba
|
816
sqft
|
built
1982
5170 River Glen Dr, Las Vegas, NV 89103
$-657
Cash flow
-13.2%
Cash-on-Cash Return
3.2%
Cap rate
0.6%
Rent to Value Ratio
Active
$205,000
1
bds
|
1
ba
|
700
sqft
|
built
1982
4981 River Glen Dr, Las Vegas, NV 89103
$-397
Cash flow
-10.1%
Cash-on-Cash Return
3.9%
Cap rate
0.7%
Rent to Value Ratio
Active
$199,000
2
bds
|
1
ba
|
816
sqft
|
built
1982
5241 River Glen Dr, Las Vegas, NV 89103
$-433
Cash flow
-11.4%
Cash-on-Cash Return
3.7%
Cap rate
0.7%
Rent to Value Ratio
Active
$169,900
1
bds
|
1
ba
|
700
sqft
|
built
1982
5185 Indian River Dr, Las Vegas, NV 89103
$-425
Cash flow
-13.1%
Cash-on-Cash Return
3.3%
Cap rate
0.6%
Rent to Value Ratio
Active
$255,000
2
bds
|
2
ba
|
1,036
sqft
|
built
1999
5055 W Hacienda Ave, Las Vegas, NV 89118
$-682
Cash flow
-14.0%
Cash-on-Cash Return
3.1%
Cap rate
0.5%
Rent to Value Ratio

Active
$1,999,999
5
bds
|
4
ba
|
3,089
sqft
|
built
2018
12346 Valley Chase Ave, Las Vegas, NV 89138
$-8,183
Cash flow
-21.3%
Cash-on-Cash Return
1.4%
Cap rate
0.2%
Rent to Value Ratio
Active
$575,000
2
bds
|
3
ba
|
1,524
sqft
|
built
2008
8255 Las Vegas Blvd S, Las Vegas, NV 89123
$-2,134
Cash flow
-19.4%
Cash-on-Cash Return
1.8%
Cap rate
0.5%
Rent to Value Ratio
Active
$425,000
2
bds
|
2
ba
|
1,125
sqft
|
built
2017
11256 Rainbow Peak Ave, Las Vegas, NV 89135
$-1,016
Cash flow
-12.5%
Cash-on-Cash Return
3.4%
Cap rate
0.6%
Rent to Value Ratio
Active
$218,000
2
bds
|
2
ba
|
1,056
sqft
|
built
1989
1403 Santa Margarita St, Las Vegas, NV 89146
$-505
Cash flow
-12.1%
Cash-on-Cash Return
3.5%
Cap rate
0.6%
Rent to Value Ratio
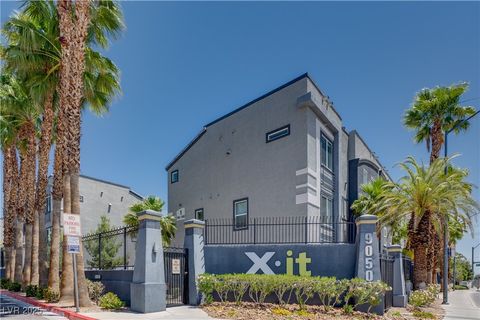
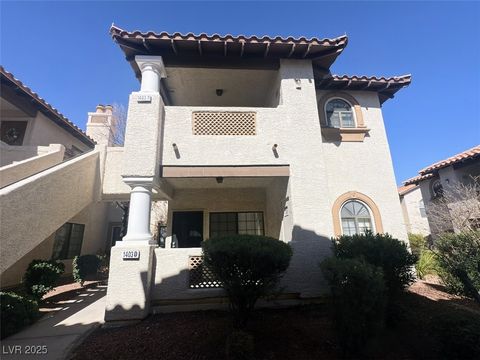
Active
$419,999
3
bds
|
4
ba
|
1,602
sqft
|
built
2007
9050 W Tropicana Ave, Las Vegas, NV 89147
$-1,311
Cash flow
-16.3%
Cash-on-Cash Return
2.5%
Cap rate
0.5%
Rent to Value Ratio
Active
$725,000
2
bds
|
2
ba
|
1,556
sqft
|
built
2005
2777 Paradise Rd, Las Vegas, NV 89109
$-2,755
Cash flow
-19.8%
Cash-on-Cash Return
1.7%
Cap rate
0.5%
Rent to Value Ratio
Active
$1,550,000
3
bds
|
3
ba
|
2,805
sqft
|
built
2005
2777 Paradise Rd, Las Vegas, NV 89109
$-6,112
Cash flow
-20.6%
Cash-on-Cash Return
1.5%
Cap rate
0.4%
Rent to Value Ratio
Active
$649,500
1
bds
|
1
ba
|
891
sqft
|
built
2007
3722 Las Vegas Blvd S, Las Vegas, NV 89158
$-3,159
Cash flow
-25.4%
Cash-on-Cash Return
0.4%
Cap rate
0.4%
Rent to Value Ratio
Active
$210,000
2
bds
|
1
ba
|
1,000
sqft
|
built
1973
4614 Grand Dr, Las Vegas, NV 89169
$-201
Cash flow
-5.0%
Cash-on-Cash Return
5.1%
Cap rate
0.9%
Rent to Value Ratio
Active
$1,300,000
4
bds
|
4
ba
|
3,191
sqft
|
built
2022
12332 Switchgrass Ave, Las Vegas, NV 89138
$-3,654
Cash flow
-14.7%
Cash-on-Cash Return
2.9%
Cap rate
0.4%
Rent to Value Ratio

Active
$1,289,000
4
bds
|
5
ba
|
3,743
sqft
|
built
2004
5225 Villa Dante Ave, Las Vegas, NV 89141
$-1,856
Cash flow
-7.5%
Cash-on-Cash Return
4.5%
Cap rate
0.6%
Rent to Value Ratio

Active
$285,000
2
bds
|
2
ba
|
992
sqft
|
built
1999
7570 Durham Hall Ave, Las Vegas, NV 89130
$-753
Cash flow
-13.8%
Cash-on-Cash Return
3.1%
Cap rate
0.5%
Rent to Value Ratio
Active
$414,999
3
bds
|
3
ba
|
1,895
sqft
|
built
2020
2827 Blue Mosaic Ln, Las Vegas, NV 89183
$-1,050
Cash flow
-13.2%
Cash-on-Cash Return
3.2%
Cap rate
0.6%
Rent to Value Ratio
Active
$2,795,900
6
bds
|
8
ba
|
6,967
sqft
|
built
1998
10280 W La Mancha Ave, Las Vegas, NV 89149
$-11,854
Cash flow
-22.1%
Cash-on-Cash Return
1.2%
Cap rate
0.2%
Rent to Value Ratio
Active
$365,000
2
bds
|
2
ba
|
1,539
sqft
|
built
2008
8925 W Flamingo Rd, Las Vegas, NV 89147
$-1,265
Cash flow
-18.1%
Cash-on-Cash Return
2.1%
Cap rate
0.6%
Rent to Value Ratio

Active
$775,000
3
bds
|
4
ba
|
2,960
sqft
|
built
2015
8126 Majestic Bighorn St, Las Vegas, NV 89166
$-2,479
Cash flow
-16.7%
Cash-on-Cash Return
2.4%
Cap rate
0.4%
Rent to Value Ratio
Active
$289,000
2
bds
|
2
ba
|
1,151
sqft
|
built
2005
9580 W Reno Ave, Las Vegas, NV 89148
$-789
Cash flow
-14.2%
Cash-on-Cash Return
3.0%
Cap rate
0.5%
Rent to Value Ratio
Active
$575,000
4
bds
|
4
ba
|
3,166
sqft
|
built
2016
7689 Monomoy Bay Ave, Las Vegas, NV 89179
$-1,584
Cash flow
-14.4%
Cash-on-Cash Return
3.0%
Cap rate
0.5%
Rent to Value Ratio
Active
$260,000
1
bds
|
1
ba
|
516
sqft
|
built
1990
4200 S Valley View Blvd, Las Vegas, NV 89103
$-501
Cash flow
-10.1%
Cash-on-Cash Return
4.0%
Cap rate
0.7%
Rent to Value Ratio
Active
$485,000
4
bds
|
3
ba
|
2,261
sqft
|
built
2017
7906 Woolly St, Las Vegas, NV 89149
$-1,230
Cash flow
-13.2%
Cash-on-Cash Return
3.2%
Cap rate
0.5%
Rent to Value Ratio
Active
$729,000
4
bds
|
4
ba
|
2,517
sqft
|
built
2019
3114 Molinos Dr, Las Vegas, NV 89141
$-2,571
Cash flow
-18.4%
Cash-on-Cash Return
2.0%
Cap rate
0.4%
Rent to Value Ratio
Active
$699,999
4
bds
|
3
ba
|
3,098
sqft
|
built
1995
7333 Painted Shadows Way, Las Vegas, NV 89149
$-1,909
Cash flow
-14.2%
Cash-on-Cash Return
3.0%
Cap rate
0.5%
Rent to Value Ratio
Active
$2,499,000
5
bds
|
5
ba
|
3,949
sqft
|
built
2018
11181 Luna Blanca Dr, Las Vegas, NV 89138
$-7,300
Cash flow
-15.2%
Cash-on-Cash Return
2.8%
Cap rate
0.4%
Rent to Value Ratio
Active
$650,000
5
bds
|
3
ba
|
3,015
sqft
|
built
2002
8728 Burning Hide Ave, Las Vegas, NV 89143
$-1,651
Cash flow
-13.3%
Cash-on-Cash Return
3.2%
Cap rate
0.5%
Rent to Value Ratio
Active
$369,000
3
bds
|
2
ba
|
1,206
sqft
|
built
1983
3936 Applecrest St, Las Vegas, NV 89108
$-824
Cash flow
-11.7%
Cash-on-Cash Return
3.6%
Cap rate
0.5%
Rent to Value Ratio
Active
$4,700,000
6
bds
|
6
ba
|
6,250
sqft
|
built
2018
26 Olympia Outlook Dr, Las Vegas, NV 89141
$-18,482
Cash flow
-20.5%
Cash-on-Cash Return
1.5%
Cap rate
0.2%
Rent to Value Ratio
Active
$467,900
3
bds
|
3
ba
|
1,622
sqft
|
built
2017
10449 Forked Run St, Las Vegas, NV 89178
$-1,691
Cash flow
-18.9%
Cash-on-Cash Return
1.9%
Cap rate
0.4%
Rent to Value Ratio
Active
$849,000
4
bds
|
5
ba
|
3,749
sqft
|
built
2006
6227 Orto Vaso Ave, Las Vegas, NV 89131
$-2,074
Cash flow
-12.7%
Cash-on-Cash Return
3.3%
Cap rate
0.5%
Rent to Value Ratio