Las Vegas, NV Investment Properties for Sale
Browse homes for sale and investment properties in Las Vegas, NV. Refine your search by price, property type, or more.
Best cash flowing properties in Las Vegas, NV
Active
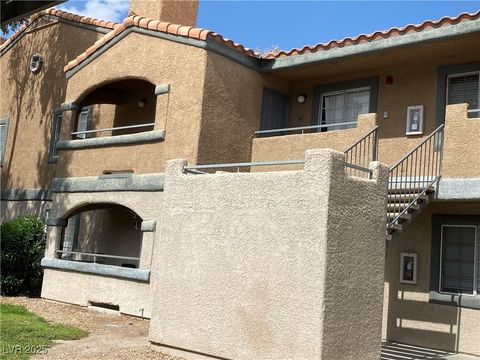
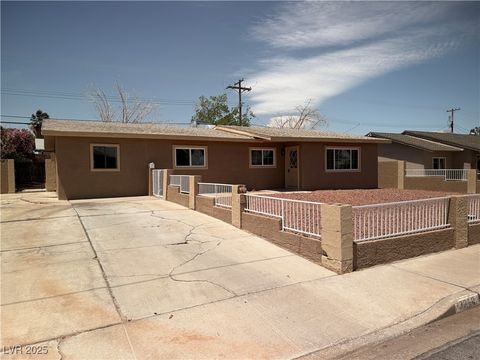
$184,000
2
bds
|
2
ba
|
876
sqft
|
built
1989
220 Mission Catalina Ln, Las Vegas, NV 89107
$-408
Cash flow
-11.6%
Cash-on-Cash Return
3.0%
Cap rate
0.7%
Rent to Value Ratio
Active
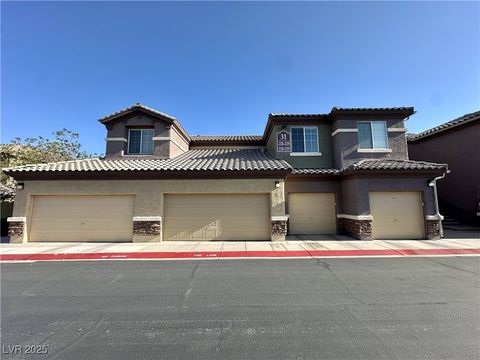
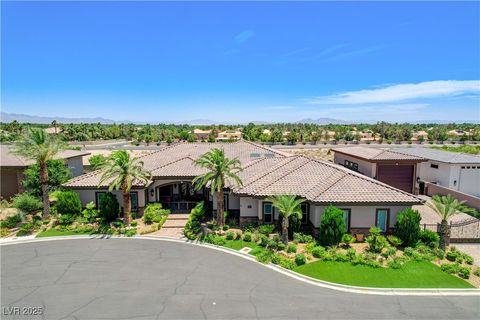
$315,000
2
bds
|
2
ba
|
1,196
sqft
|
built
2008
6868 Sky Pointe Dr, Las Vegas, NV 89131
$-488
Cash flow
-8.1%
Cash-on-Cash Return
3.8%
Cap rate
0.6%
Rent to Value Ratio
6,275 out of 6,409 properties for sale in Las Vegas, NV
Limited Results Shown
Create a free account, or log in to reveal all property listings and enjoy the complete experience.
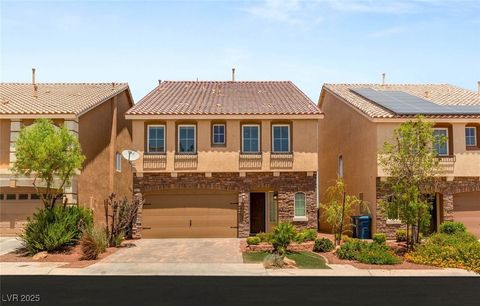
Active
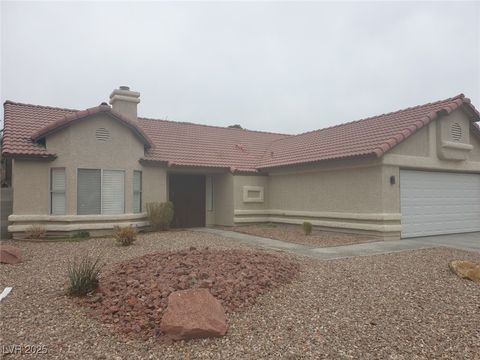
$429,888
3
bds
|
2
ba
|
1,548
sqft
|
built
1990
3116 Gentle Breeze St, Las Vegas, NV 89108
$-803
Cash flow
-9.7%
Cash-on-Cash Return
3.4%
Cap rate
0.5%
Rent to Value Ratio
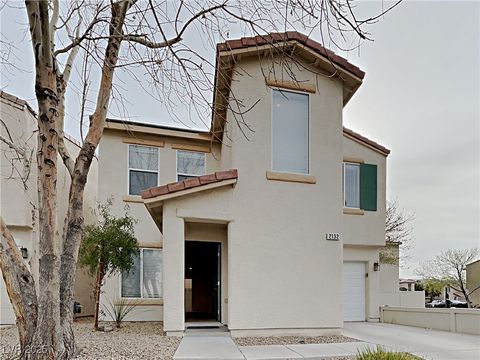
Active
$325,000
3
bds
|
3
ba
|
1,310
sqft
|
built
2004
2132 Tierra Del Verde St, Las Vegas, NV 89156
$-495
Cash flow
-7.9%
Cash-on-Cash Return
3.9%
Cap rate
0.5%
Rent to Value Ratio
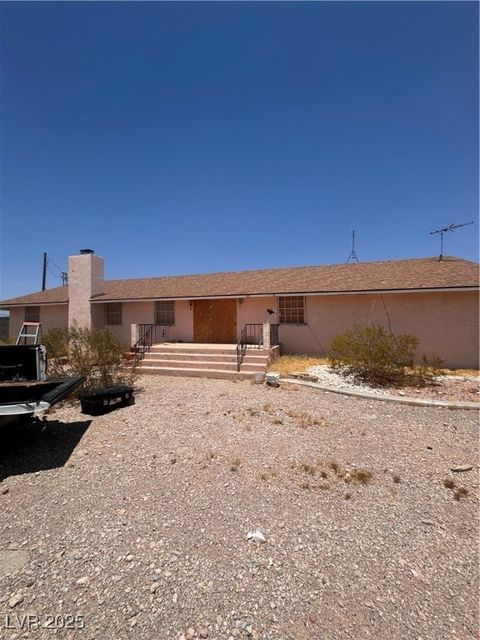
Active
$415,000
4
bds
|
2
ba
|
1,655
sqft
|
built
1963
3219 Bluebird St, Las Vegas, NV 89121
$-807
Cash flow
-10.1%
Cash-on-Cash Return
3.3%
Cap rate
0.4%
Rent to Value Ratio
Active
$3,700,000
4
bds
|
4
ba
|
5,395
sqft
|
built
2019
8574 Verde Park Cir, Las Vegas, NV 89129
$-15,355
Cash flow
-21.7%
Cash-on-Cash Return
0.7%
Cap rate
0.1%
Rent to Value Ratio
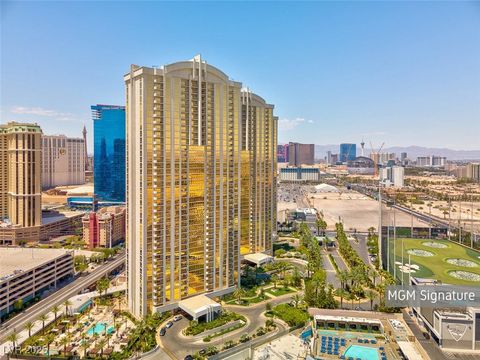
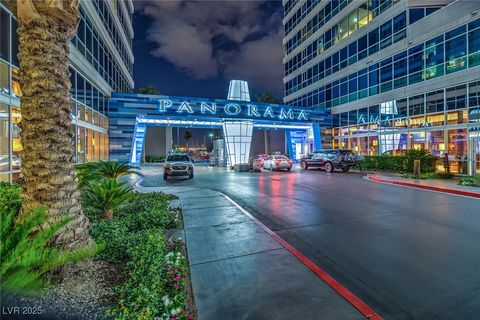
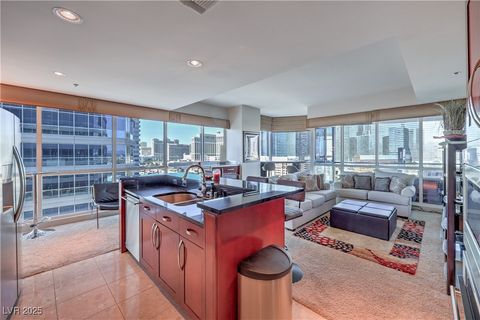
Active
$388,888
1
bds
|
2
ba
|
874
sqft
|
built
2006
135 E Harmon Ave, Las Vegas, NV 89109
$-1,798
Cash flow
-24.1%
Cash-on-Cash Return
0.1%
Cap rate
0.8%
Rent to Value Ratio
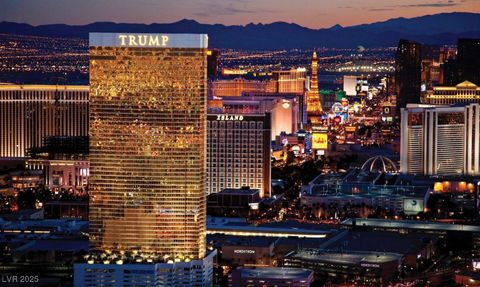
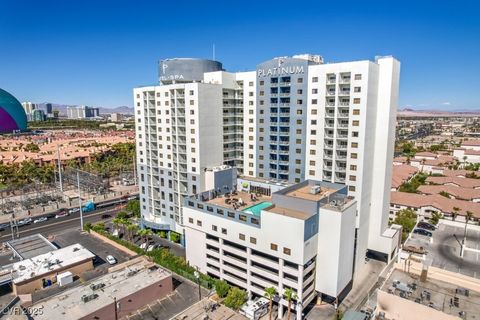
Active
$439,000
1
bds
|
2
ba
|
910
sqft
|
built
2006
2000 N Fashion Show Dr, Las Vegas, NV 89109
$-1,675
Cash flow
-19.9%
Cash-on-Cash Return
1.1%
Cap rate
0.7%
Rent to Value Ratio
Active
$499,995
2
bds
|
2
ba
|
1,182
sqft
|
built
2006
4525 Dean Martin Dr, Las Vegas, NV 89103
$-1,820
Cash flow
-19.0%
Cash-on-Cash Return
1.3%
Cap rate
0.6%
Rent to Value Ratio
Active
$689,998
4
bds
|
2
ba
|
2,185
sqft
|
built
1998
9632 Cherry Canyon Ave, Las Vegas, NV 89129
$-1,545
Cash flow
-11.7%
Cash-on-Cash Return
3.0%
Cap rate
0.4%
Rent to Value Ratio
Active
$830,000
4
bds
|
4
ba
|
3,256
sqft
|
built
2008
7033 Twin Forks Peak St, Las Vegas, NV 89166
$-988
Cash flow
-6.2%
Cash-on-Cash Return
4.3%
Cap rate
0.6%
Rent to Value Ratio
Active
$344,000
bds
|
1
ba
|
615
sqft
|
built
2006
4381 W Flamingo Rd, Las Vegas, NV 89103
$-1,000
Cash flow
-15.2%
Cash-on-Cash Return
2.2%
Cap rate
0.8%
Rent to Value Ratio
Active
$1,135,000
4
bds
|
4
ba
|
3,828
sqft
|
built
1991
5225 Sandy Cactus Ln, Las Vegas, NV 89149
$-2,609
Cash flow
-12.0%
Cash-on-Cash Return
2.9%
Cap rate
0.4%
Rent to Value Ratio
Active
$550,000
3
bds
|
3
ba
|
2,458
sqft
|
built
2023
9256 Alden Pointe Ct, Las Vegas, NV 89143
$-1,508
Cash flow
-14.3%
Cash-on-Cash Return
2.4%
Cap rate
0.4%
Rent to Value Ratio
Active
$2,600,000
3
bds
|
4
ba
|
3,856
sqft
|
built
2006
9103 Alta Dr, Las Vegas, NV 89145
$-14,423
Cash flow
-28.9%
Cash-on-Cash Return
-1.0%
Cap rate
0.2%
Rent to Value Ratio
Active
$550,000
3
bds
|
2
ba
|
1,948
sqft
|
built
2014
8305 Minots Ledge Ave, Las Vegas, NV 89147
$-1,367
Cash flow
-13.0%
Cash-on-Cash Return
2.7%
Cap rate
0.4%
Rent to Value Ratio
Active
$465,000
3
bds
|
3
ba
|
1,809
sqft
|
built
1998
620 Painted Cloud Pl, Las Vegas, NV 89144
$-967
Cash flow
-10.8%
Cash-on-Cash Return
3.2%
Cap rate
0.5%
Rent to Value Ratio
Active
$675,000
4
bds
|
3
ba
|
2,952
sqft
|
built
2001
323 Harpers Ferry Ave, Las Vegas, NV 89148
$-1,622
Cash flow
-12.5%
Cash-on-Cash Return
2.8%
Cap rate
0.5%
Rent to Value Ratio

Active
$528,888
1
bds
|
1
ba
|
754
sqft
|
built
2007
3722 Las Vegas Blvd S, Las Vegas, NV 89158
$-2,062
Cash flow
-20.3%
Cash-on-Cash Return
1.0%
Cap rate
0.4%
Rent to Value Ratio
Active
$550,000
2
bds
|
2
ba
|
1,296
sqft
|
built
1976
205 E Harmon Ave, Las Vegas, NV 89169
$-1,484
Cash flow
-14.1%
Cash-on-Cash Return
2.4%
Cap rate
0.5%
Rent to Value Ratio
Active
$275,000
1
bds
|
0
ba
|
615
sqft
|
built
2006
4381 W Flamingo Rd, Las Vegas, NV 89103
$-903
Cash flow
-17.1%
Cash-on-Cash Return
1.7%
Cap rate
0.7%
Rent to Value Ratio

Active
$3,999,999
4
bds
|
4
ba
|
3,905
sqft
|
built
2006
4381 W Flamingo Rd, Las Vegas, NV 89103
$-22,285
Cash flow
-29.1%
Cash-on-Cash Return
-1.0%
Cap rate
0.1%
Rent to Value Ratio
Active
$675,000
6
bds
|
3
ba
|
3,428
sqft
|
built
2018
8531 W Oquendo Rd, Las Vegas, NV 89113
$-1,421
Cash flow
-11.0%
Cash-on-Cash Return
3.2%
Cap rate
0.5%
Rent to Value Ratio
Active
$495,000
3
bds
|
3
ba
|
2,051
sqft
|
built
2019
9850 Poplar Point Ave, Las Vegas, NV 89178
$-894
Cash flow
-9.4%
Cash-on-Cash Return
3.5%
Cap rate
0.5%
Rent to Value Ratio
Active
$935,000
5
bds
|
4
ba
|
2,454
sqft
|
built
2021
312 Wind Poppy St, Las Vegas, NV 89138
$-2,233
Cash flow
-12.5%
Cash-on-Cash Return
2.8%
Cap rate
0.4%
Rent to Value Ratio
Active
$850,000
4
bds
|
3
ba
|
3,119
sqft
|
built
2021
4177 Railhead Pass Ave, Las Vegas, NV 89141
$-2,455
Cash flow
-15.1%
Cash-on-Cash Return
2.2%
Cap rate
0.4%
Rent to Value Ratio
Active
$399,990
4
bds
|
2
ba
|
1,775
sqft
|
built
1963
5809 Pebble Beach Blvd, Las Vegas, NV 89108
$-727
Cash flow
-9.5%
Cash-on-Cash Return
3.5%
Cap rate
0.5%
Rent to Value Ratio
Active
$520,000
3
bds
|
4
ba
|
1,874
sqft
|
built
2014
3908 Total Eclipse St, Las Vegas, NV 89129
$-734
Cash flow
-7.4%
Cash-on-Cash Return
4.0%
Cap rate
0.6%
Rent to Value Ratio
Active
$429,900
4
bds
|
3
ba
|
1,882
sqft
|
built
2005
6346 Azurelyn Ave, Las Vegas, NV 89122
$-804
Cash flow
-9.8%
Cash-on-Cash Return
3.4%
Cap rate
0.5%
Rent to Value Ratio
Active
$403,888
4
bds
|
3
ba
|
1,487
sqft
|
built
1970
824 Antigua St, Las Vegas, NV 89145
$-626
Cash flow
-8.1%
Cash-on-Cash Return
3.8%
Cap rate
0.5%
Rent to Value Ratio
Active
$569,000
4
bds
|
4
ba
|
2,644
sqft
|
built
2013
6014 Belvedere Canyon Ave, Las Vegas, NV 89139
$-1,321
Cash flow
-12.1%
Cash-on-Cash Return
2.9%
Cap rate
0.4%
Rent to Value Ratio
Active
$184,000
2
bds
|
2
ba
|
876
sqft
|
built
1989
220 Mission Catalina Ln, Las Vegas, NV 89107
$-408
Cash flow
-11.6%
Cash-on-Cash Return
3.0%
Cap rate
0.7%
Rent to Value Ratio
Active
$600,000
3
bds
|
2
ba
|
3,180
sqft
|
built
1974
7052 W Meranto Ave, Las Vegas, NV 89178
$-1,307
Cash flow
-11.4%
Cash-on-Cash Return
3.1%
Cap rate
0.4%
Rent to Value Ratio
Active
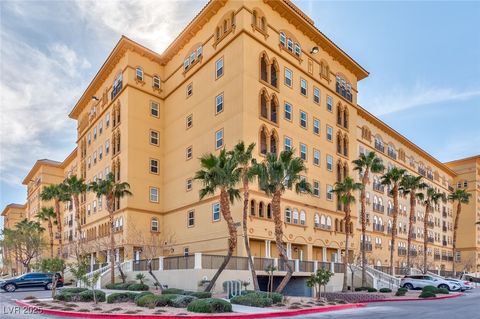
$649,900
2
bds
|
2
ba
|
1,433
sqft
|
built
2005
4575 Dean Martin Dr, Las Vegas, NV 89103
$-1,773
Cash flow
-14.2%
Cash-on-Cash Return
2.4%
Cap rate
0.7%
Rent to Value Ratio
Active
$250,000
1
bds
|
1
ba
|
750
sqft
|
built
2006
211 E Flamingo Rd, Las Vegas, NV 89169
$-841
Cash flow
-17.6%
Cash-on-Cash Return
1.6%
Cap rate
0.6%
Rent to Value Ratio
Active
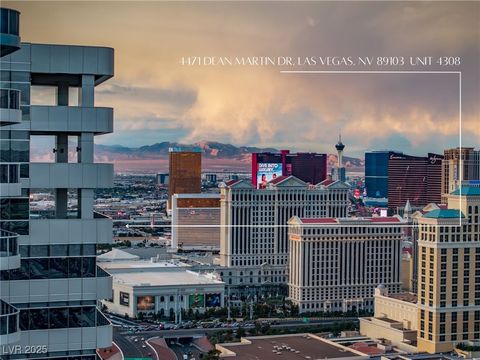
$4,200,000
4
bds
|
4
ba
|
3,616
sqft
|
built
2007
4471 Dean Martin Dr, Las Vegas, NV 89103
$-18,207
Cash flow
-22.6%
Cash-on-Cash Return
0.5%
Cap rate
0.2%
Rent to Value Ratio
Active
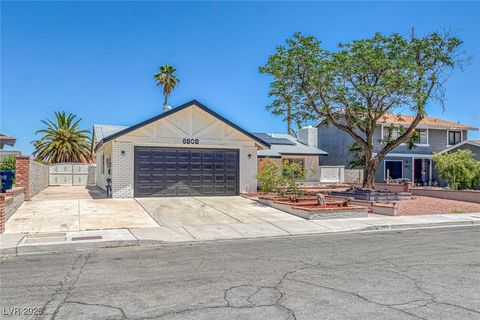
$399,900
3
bds
|
2
ba
|
1,598
sqft
|
built
1980
6808 Waterhen Cir, Las Vegas, NV 89108
$-882
Cash flow
-11.5%
Cash-on-Cash Return
3.0%
Cap rate
0.4%
Rent to Value Ratio
Active
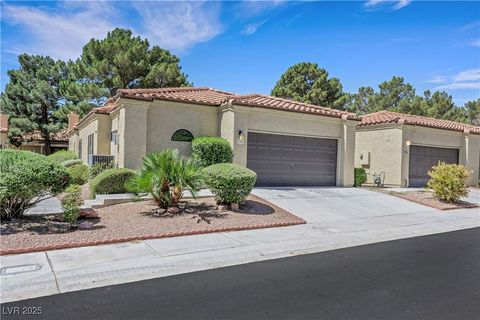
$415,000
2
bds
|
2
ba
|
1,684
sqft
|
built
1987
7909 Canoe Ln, Las Vegas, NV 89145
$-1,031
Cash flow
-13.0%
Cash-on-Cash Return
2.7%
Cap rate
0.5%
Rent to Value Ratio
Active
$269,000
2
bds
|
2
ba
|
899
sqft
|
built
2007
2405 W Serene Ave, Las Vegas, NV 89123
$-754
Cash flow
-14.6%
Cash-on-Cash Return
2.3%
Cap rate
0.6%
Rent to Value Ratio
Active
$449,000
2
bds
|
2
ba
|
1,296
sqft
|
built
1976
205 E Harmon Ave, Las Vegas, NV 89169
$-1,575
Cash flow
-18.3%
Cash-on-Cash Return
1.5%
Cap rate
0.4%
Rent to Value Ratio
Active
$395,000
6
bds
|
2
ba
|
1,824
sqft
|
built
1965
224 Catalini St, Las Vegas, NV 89107
$-570
Cash flow
-7.5%
Cash-on-Cash Return
3.9%
Cap rate
0.5%
Rent to Value Ratio
Active
$315,000
2
bds
|
2
ba
|
1,196
sqft
|
built
2008
6868 Sky Pointe Dr, Las Vegas, NV 89131
$-488
Cash flow
-8.1%
Cash-on-Cash Return
3.8%
Cap rate
0.6%
Rent to Value Ratio