Las Vegas, NV Investment Properties for Sale
Browse homes for sale and investment properties in Las Vegas, NV. Refine your search by price, property type, or more.
Best cash flowing properties in Las Vegas, NV
Active
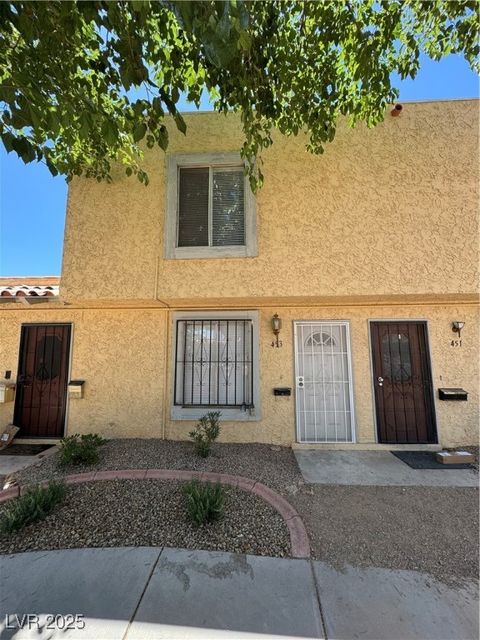
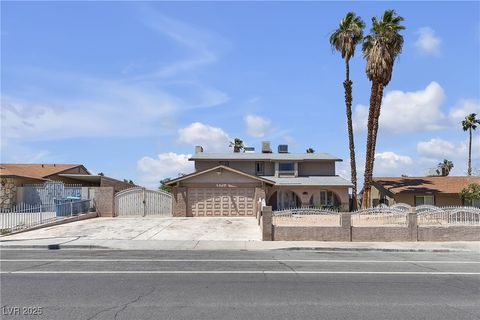
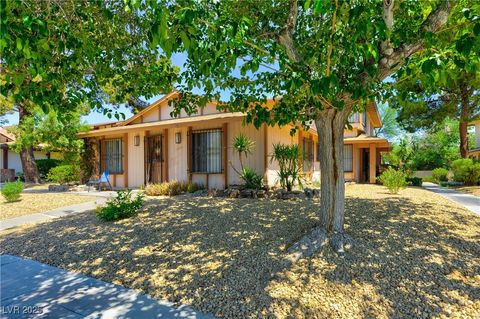
$230,000
2
bds
|
2
ba
|
1,122
sqft
|
built
1973
453 Las Casitas Way, Las Vegas, NV 89121
$-234
Cash flow
-5.3%
Cash-on-Cash Return
4.5%
Cap rate
0.7%
Rent to Value Ratio
Active
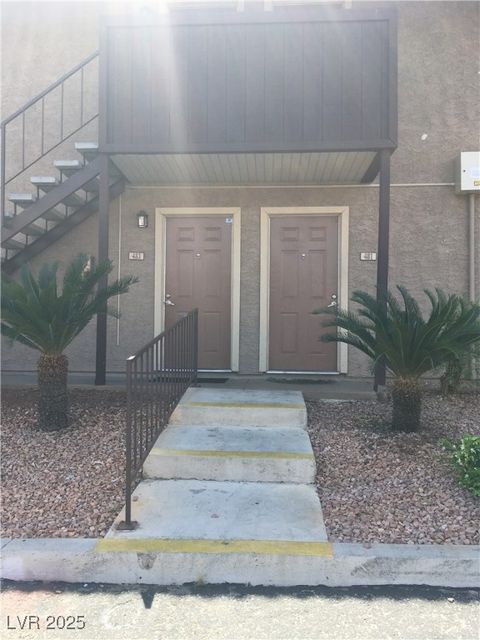
$165,000
1
bds
|
1
ba
|
700
sqft
|
built
1982
5000 Indian River Dr, Las Vegas, NV 89103
$-314
Cash flow
-9.9%
Cash-on-Cash Return
3.4%
Cap rate
0.7%
Rent to Value Ratio
6,275 out of 6,409 properties for sale in Las Vegas, NV
Limited Results Shown
Create a free account, or log in to reveal all property listings and enjoy the complete experience.
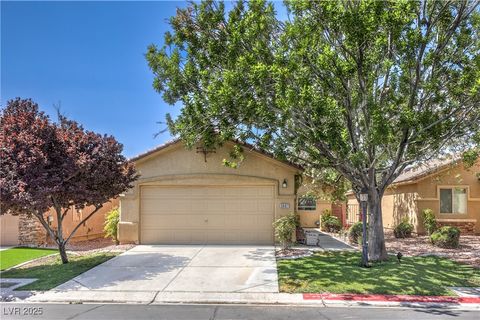
Active
$360,000
2
bds
|
2
ba
|
1,223
sqft
|
built
2001
5687 Harbour Pointe Ave, Las Vegas, NV 89122
$-810
Cash flow
-11.7%
Cash-on-Cash Return
3.0%
Cap rate
0.5%
Rent to Value Ratio
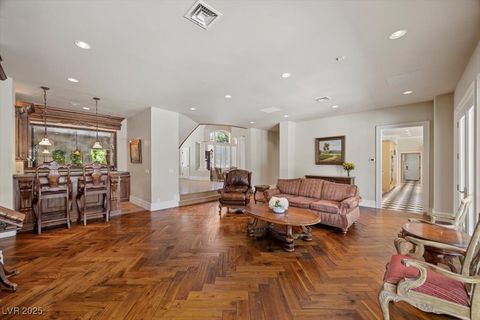
Active
$1,700,000
4
bds
|
5
ba
|
5,184
sqft
|
built
1993
3102 La Mirada Ave, Las Vegas, NV 89120
$-5,555
Cash flow
-17.0%
Cash-on-Cash Return
1.8%
Cap rate
0.3%
Rent to Value Ratio
Active
$559,999
6
bds
|
3
ba
|
2,740
sqft
|
built
1998
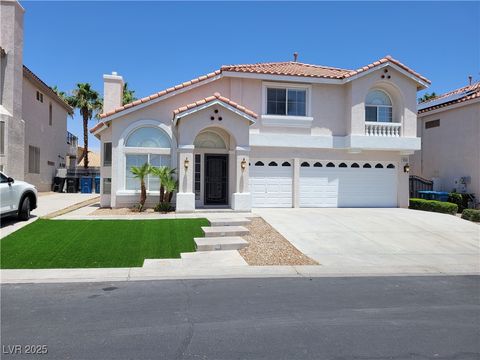
532 Kavanagh Pl, Las Vegas, NV 89123
$-961
Cash flow
-9.0%
Cash-on-Cash Return
3.6%
Cap rate
0.5%
Rent to Value Ratio
Active
$415,000
3
bds
|
2
ba
|
1,396
sqft
|
built
2002
5033 Wild Buffalo Ave, Las Vegas, NV 89131
$-748
Cash flow
-9.4%
Cash-on-Cash Return
3.5%
Cap rate
0.5%
Rent to Value Ratio
Active
$700,000
4
bds
|
3
ba
|
2,522
sqft
|
built
1993
1968 Evening Glow Dr, Las Vegas, NV 89134
$-1,713
Cash flow
-12.8%
Cash-on-Cash Return
2.7%
Cap rate
0.4%
Rent to Value Ratio

Active
$253,000
1
bds
|
1
ba
|
750
sqft
|
built
2006
211 E Flamingo Rd, Las Vegas, NV 89169
$-865
Cash flow
-17.8%
Cash-on-Cash Return
1.6%
Cap rate
0.6%
Rent to Value Ratio
Active
$399,999
3
bds
|
2
ba
|
1,247
sqft
|
built
1976
2088 Miner Way, Las Vegas, NV 89104
$-456
Cash flow
-5.9%
Cash-on-Cash Return
4.3%
Cap rate
0.6%
Rent to Value Ratio
Active
$549,000
2
bds
|
3
ba
|
1,856
sqft
|
built
1974
3111 Bel Air Dr, Las Vegas, NV 89109
$-1,966
Cash flow
-18.7%
Cash-on-Cash Return
1.4%
Cap rate
0.6%
Rent to Value Ratio

Active
$400,000
1
bds
|
2
ba
|
847
sqft
|
built
2006
135 E Harmon Ave, Las Vegas, NV 89109
$-2,126
Cash flow
-27.7%
Cash-on-Cash Return
-0.7%
Cap rate
0.7%
Rent to Value Ratio
Active
$409,000
1
bds
|
2
ba
|
874
sqft
|
built
2006
135 E Harmon Ave, Las Vegas, NV 89109
$-2,286
Cash flow
-29.2%
Cash-on-Cash Return
-1.0%
Cap rate
0.6%
Rent to Value Ratio
Active
$528,000
2
bds
|
2
ba
|
1,111
sqft
|
built
2007
4471 Dean Martin Dr, Las Vegas, NV 89103
$-1,236
Cash flow
-12.2%
Cash-on-Cash Return
2.9%
Cap rate
0.7%
Rent to Value Ratio
Active
$550,000
3
bds
|
2
ba
|
1,640
sqft
|
built
1978
3826 Edmond St, Las Vegas, NV 89103
$-1,479
Cash flow
-14.0%
Cash-on-Cash Return
2.5%
Cap rate
0.4%
Rent to Value Ratio
Active
$620,900
5
bds
|
4
ba
|
2,662
sqft
|
built
1974
6628 Celeste Ave, Las Vegas, NV 89107
$-1,244
Cash flow
-10.5%
Cash-on-Cash Return
3.3%
Cap rate
0.5%
Rent to Value Ratio
Active
$495,000
5
bds
|
3
ba
|
1,959
sqft
|
built
1996
4411 Wild Honey Ct, Las Vegas, NV 89147
$-940
Cash flow
-9.9%
Cash-on-Cash Return
3.4%
Cap rate
0.5%
Rent to Value Ratio
Active
$485,000
3
bds
|
2
ba
|
1,615
sqft
|
built
1991
8800 Crescent Ridge Ln, Las Vegas, NV 89134
$-1,064
Cash flow
-11.4%
Cash-on-Cash Return
3.0%
Cap rate
0.5%
Rent to Value Ratio
Active
$665,000
5
bds
|
3
ba
|
2,481
sqft
|
built
1998
10716 Aire Dr, Las Vegas, NV 89144
$-1,601
Cash flow
-12.6%
Cash-on-Cash Return
2.8%
Cap rate
0.4%
Rent to Value Ratio
Active
$324,800
2
bds
|
1
ba
|
854
sqft
|
built
1976
7144 Forest Vista St, Las Vegas, NV 89147
$-639
Cash flow
-10.3%
Cash-on-Cash Return
3.3%
Cap rate
0.4%
Rent to Value Ratio
Active
$5,475,000
3
bds
|
5
ba
|
6,421
sqft
|
built
2005
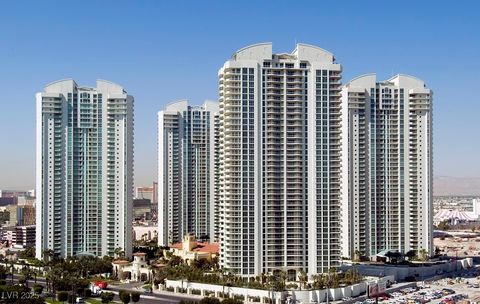
2777 Paradise Rd, Las Vegas, NV 89109
$-25,266
Cash flow
-24.1%
Cash-on-Cash Return
0.1%
Cap rate
0.2%
Rent to Value Ratio
Active
$699,900
2
bds
|
3
ba
|
1,621
sqft
|
built
2006
4525 Dean Martin Dr, Las Vegas, NV 89103
$-2,378
Cash flow
-17.7%
Cash-on-Cash Return
1.6%
Cap rate
0.6%
Rent to Value Ratio
Active
$359,500
1
bds
|
1
ba
|
520
sqft
|
built
2006
125 E Harmon Ave, Las Vegas, NV 89109
$-1,268
Cash flow
-18.4%
Cash-on-Cash Return
1.4%
Cap rate
0.6%
Rent to Value Ratio
Active
$220,000
2
bds
|
1
ba
|
880
sqft
|
built
1972
1372 Lorilyn Ave, Las Vegas, NV 89119
$-466
Cash flow
-11.1%
Cash-on-Cash Return
3.1%
Cap rate
0.6%
Rent to Value Ratio
Active
$175,000
2
bds
|
1
ba
|
816
sqft
|
built
1982
4990 River Glen Dr, Las Vegas, NV 89103
$-326
Cash flow
-9.7%
Cash-on-Cash Return
3.4%
Cap rate
0.7%
Rent to Value Ratio
Active
$350,000
2
bds
|
2
ba
|
1,488
sqft
|
built
1990
7648 Rolling View Dr, Las Vegas, NV 89149
$-955
Cash flow
-14.2%
Cash-on-Cash Return
2.4%
Cap rate
0.5%
Rent to Value Ratio
Active
$695,000
2
bds
|
2
ba
|
1,405
sqft
|
built
2006
322 Karen Ave, Las Vegas, NV 89109
$-2,304
Cash flow
-17.3%
Cash-on-Cash Return
1.7%
Cap rate
0.5%
Rent to Value Ratio
Active
$1,144,000
4
bds
|
3
ba
|
2,290
sqft
|
built
2022
11909 Pippa Ave, Las Vegas, NV 89138
$-3,584
Cash flow
-16.3%
Cash-on-Cash Return
1.9%
Cap rate
0.3%
Rent to Value Ratio
Active
$435,000
3
bds
|
3
ba
|
1,419
sqft
|
built
2022
5403 El Nevero St, Las Vegas, NV 89166
$-944
Cash flow
-11.3%
Cash-on-Cash Return
3.1%
Cap rate
0.5%
Rent to Value Ratio
Active
$490,000
3
bds
|
2
ba
|
1,528
sqft
|
built
1994
2512 Huber Heights Dr, Las Vegas, NV 89128
$-961
Cash flow
-10.2%
Cash-on-Cash Return
3.3%
Cap rate
0.5%
Rent to Value Ratio
Active
$1,150,000
4
bds
|
4
ba
|
5,383
sqft
|
built
2004
11056 Kilkerran Ct, Las Vegas, NV 89141
$-2,167
Cash flow
-9.8%
Cash-on-Cash Return
3.4%
Cap rate
0.5%
Rent to Value Ratio
Active
$399,999
3
bds
|
3
ba
|
1,622
sqft
|
built
2010
10557 Bandera Mountain Ln, Las Vegas, NV 89166
$-712
Cash flow
-9.3%
Cash-on-Cash Return
3.5%
Cap rate
0.6%
Rent to Value Ratio
Active
$399,900
3
bds
|
2
ba
|
1,413
sqft
|
built
2001
7547 Rolling River Dr, Las Vegas, NV 89131
$-670
Cash flow
-8.7%
Cash-on-Cash Return
3.7%
Cap rate
0.5%
Rent to Value Ratio
Active
$950,000
5
bds
|
4
ba
|
3,976
sqft
|
built
1999
4651 Munich Ct, Las Vegas, NV 89147
$-2,379
Cash flow
-13.1%
Cash-on-Cash Return
2.7%
Cap rate
0.4%
Rent to Value Ratio
Active
$455,000
4
bds
|
3
ba
|
1,474
sqft
|
built
2003
9025 Loggers Mill Ave, Las Vegas, NV 89143
$-707
Cash flow
-8.1%
Cash-on-Cash Return
3.8%
Cap rate
0.5%
Rent to Value Ratio
Active
$619,990
4
bds
|
3
ba
|
2,310
sqft
|
built
2002
9556 Ancala Hollow Ct, Las Vegas, NV 89148
$-1,422
Cash flow
-12.0%
Cash-on-Cash Return
2.9%
Cap rate
0.4%
Rent to Value Ratio
Active
$230,000
2
bds
|
2
ba
|
1,122
sqft
|
built
1973
453 Las Casitas Way, Las Vegas, NV 89121
$-234
Cash flow
-5.3%
Cash-on-Cash Return
4.5%
Cap rate
0.7%
Rent to Value Ratio
Active
$285,000
2
bds
|
2
ba
|
1,260
sqft
|
built
2004
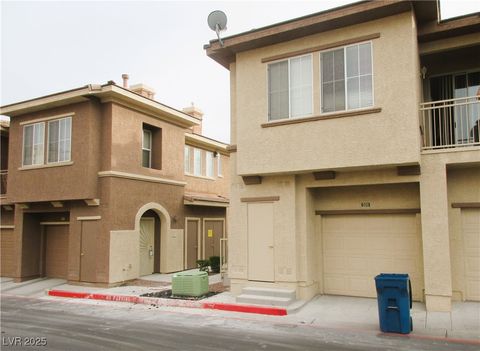
10231 Delray Beach Ave, Las Vegas, NV 89129
$-525
Cash flow
-9.6%
Cash-on-Cash Return
3.5%
Cap rate
0.6%
Rent to Value Ratio

Active
$379,000
1
bds
|
2
ba
|
974
sqft
|
built
2006
200 W Sahara Ave, Las Vegas, NV 89102
$-1,040
Cash flow
-14.3%
Cash-on-Cash Return
2.4%
Cap rate
0.7%
Rent to Value Ratio
Active
$454,900
1
bds
|
2
ba
|
1,179
sqft
|
built
2005
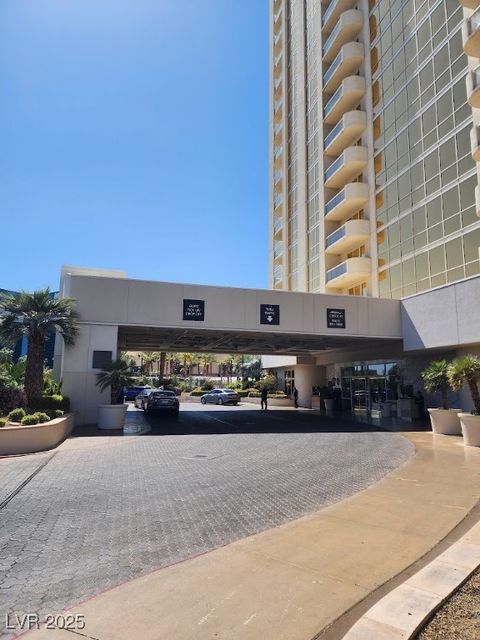
2777 Paradise Rd, Las Vegas, NV 89109
$-998
Cash flow
-11.4%
Cash-on-Cash Return
3.0%
Cap rate
0.7%
Rent to Value Ratio
Active
$469,000
1
bds
|
2
ba
|
874
sqft
|
built
2006
135 E Harmon Ave, Las Vegas, NV 89109
$-2,362
Cash flow
-26.3%
Cash-on-Cash Return
-0.4%
Cap rate
0.6%
Rent to Value Ratio
Active
$165,000
1
bds
|
1
ba
|
700
sqft
|
built
1982
5000 Indian River Dr, Las Vegas, NV 89103
$-314
Cash flow
-9.9%
Cash-on-Cash Return
3.4%
Cap rate
0.7%
Rent to Value Ratio

Active
$335,000
1
bds
|
1
ba
|
615
sqft
|
built
2006
4381 W Flamingo Rd, Las Vegas, NV 89103
$-1,405
Cash flow
-21.9%
Cash-on-Cash Return
0.6%
Cap rate
0.7%
Rent to Value Ratio