Las Vegas, NV Investment Properties for Sale
Browse homes for sale and investment properties in Las Vegas, NV. Refine your search by price, property type, or more.
Best cash flowing properties in Las Vegas, NV
Active
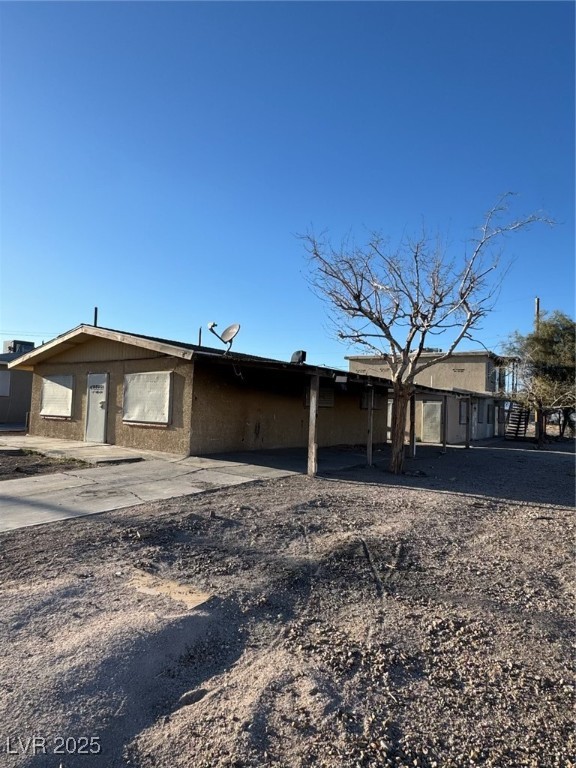
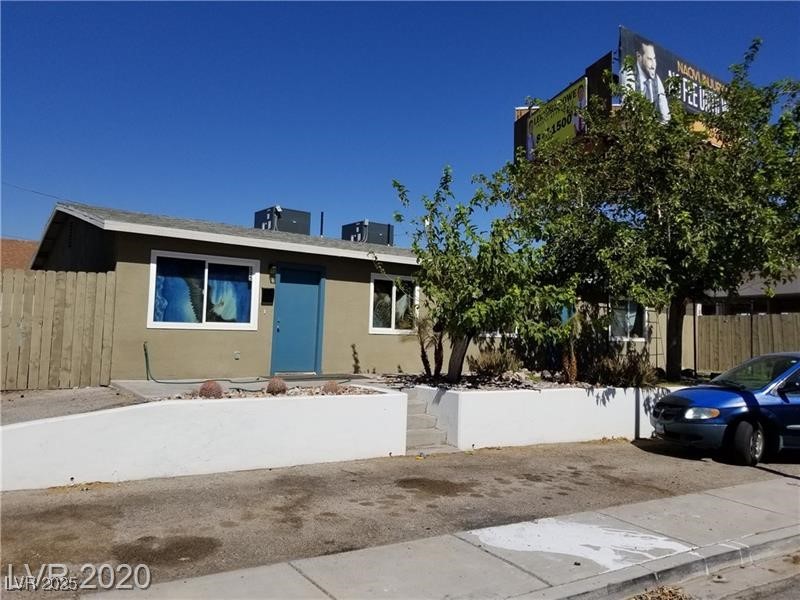
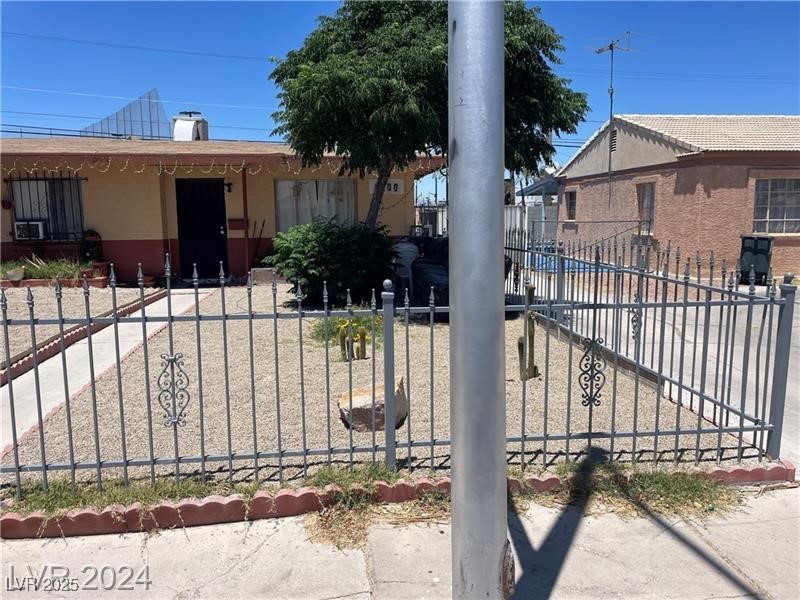
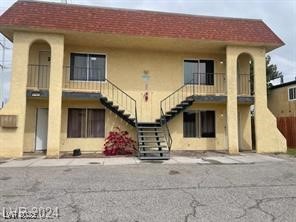
$380,900
6
bds
|
0
ba
|
3,184
sqft
|
built
1963
709 G St, Las Vegas, NV 89106
$-982
Cash flow
-13.5%
Cash-on-Cash Return
3.2%
Cap rate
0.5%
Rent to Value Ratio
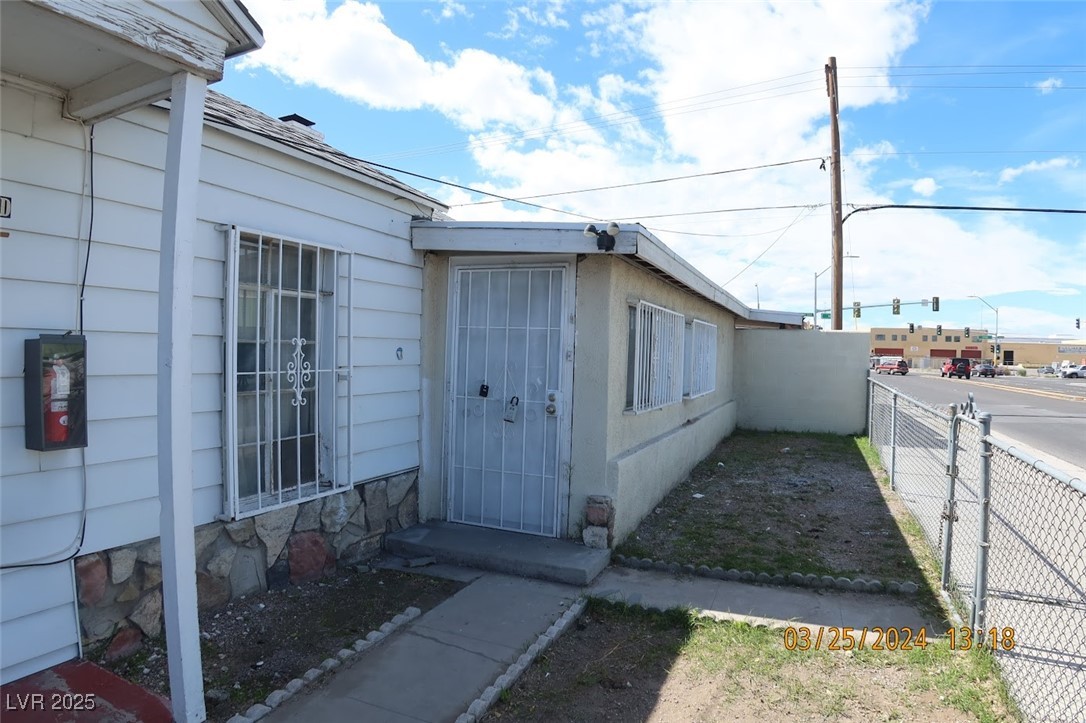
Active
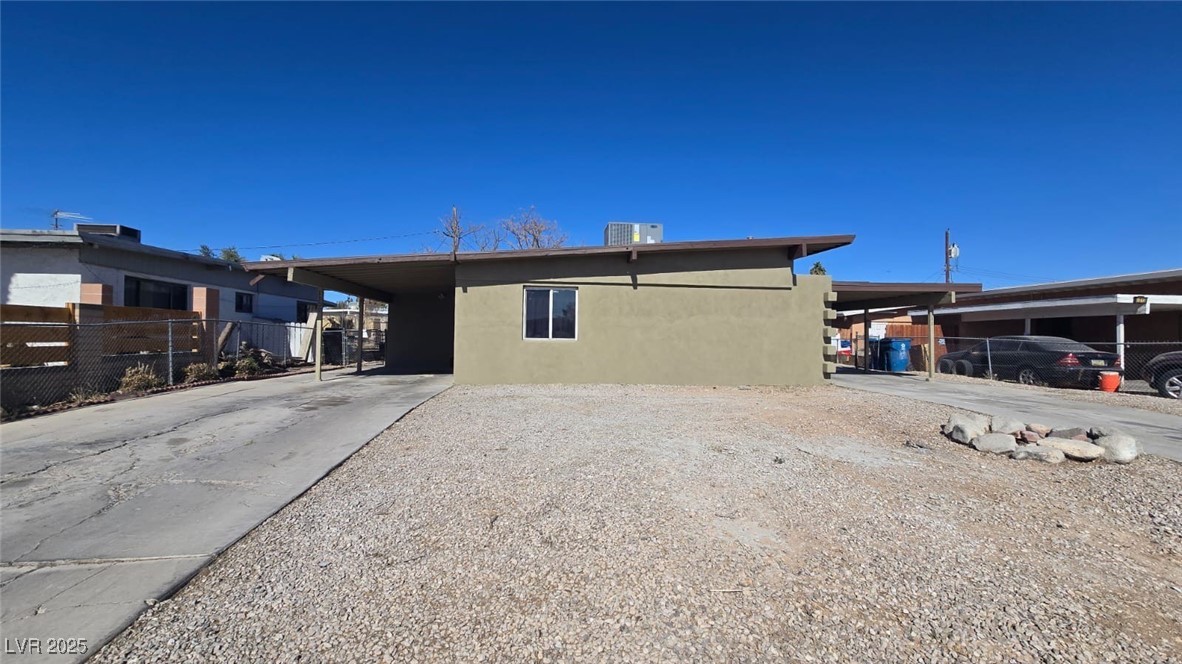
$299,900
2
bds
|
0
ba
|
910
sqft
|
built
1951
1140 Laurel Ave, Las Vegas, NV 89104
$-1,137
Cash flow
-19.8%
Cash-on-Cash Return
1.8%
Cap rate
0.2%
Rent to Value Ratio
58 out of 60 properties for sale in Las Vegas, NV
Limited Results Shown
Create a free account, or log in to reveal all property listings and enjoy the complete experience.
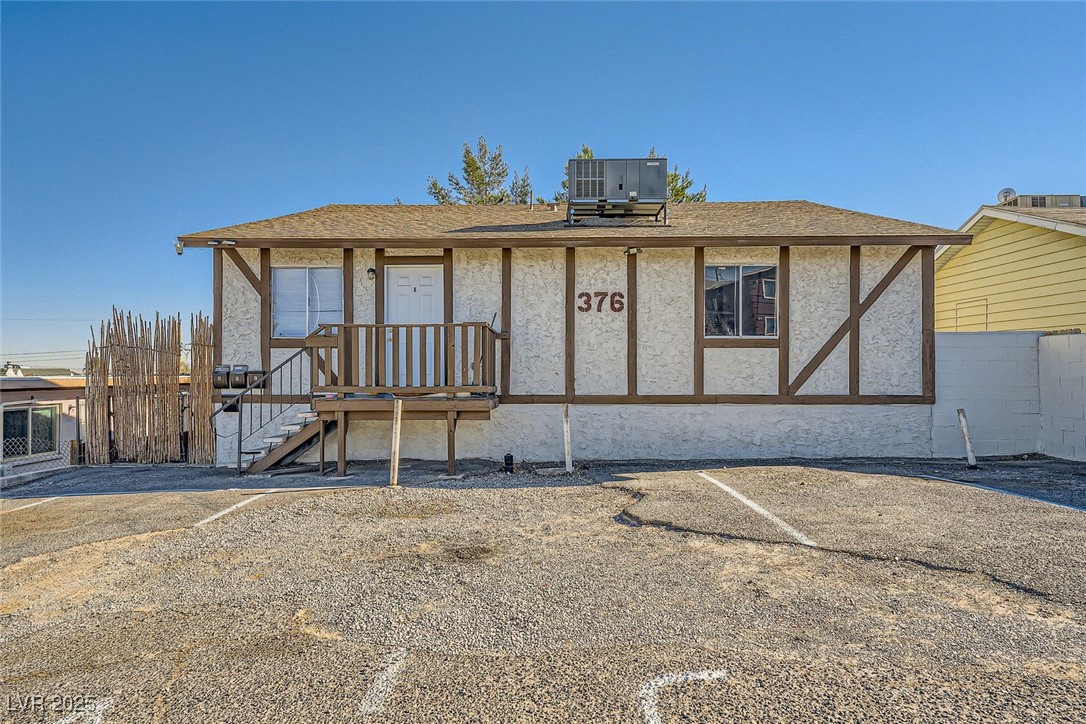
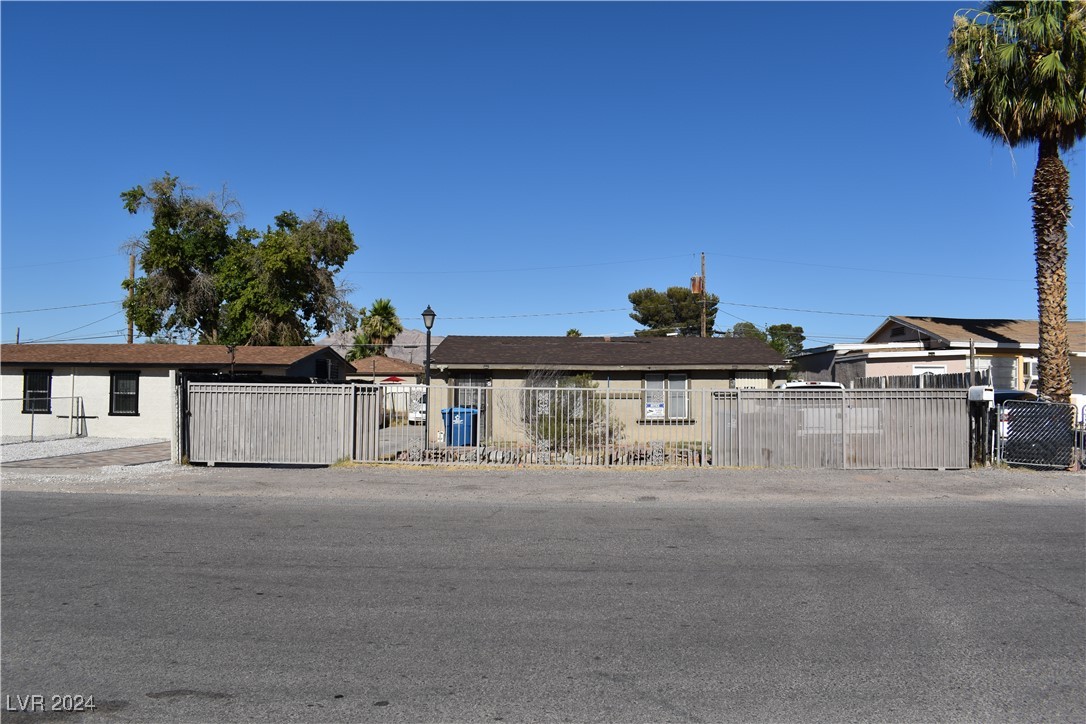
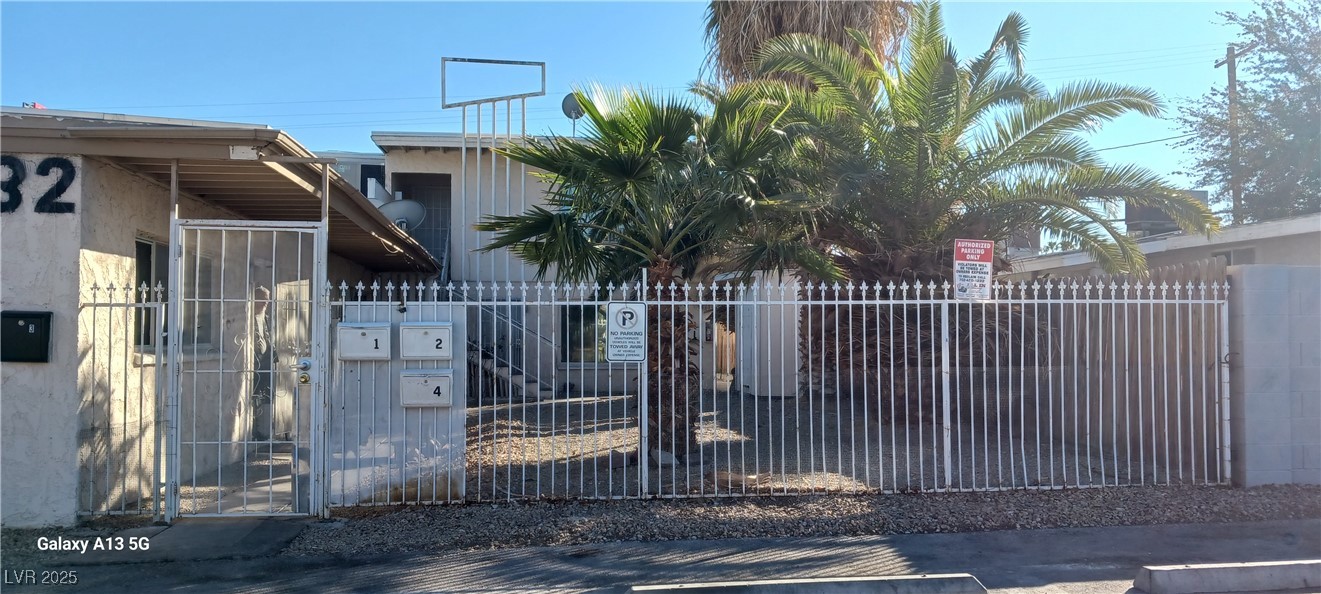
Active
$589,000
7
bds
|
0
ba
|
2,835
sqft
|
built
1982
376 N 15th St, Las Vegas, NV 89101
$-2,152
Cash flow
-19.1%
Cash-on-Cash Return
1.9%
Cap rate
0.3%
Rent to Value Ratio

Active
$676,000
8
bds
|
0
ba
|
3,196
sqft
|
built
1962
5100 Pebble Beach Blvd, Las Vegas, NV 89108
$-2,312
Cash flow
-17.8%
Cash-on-Cash Return
2.2%
Cap rate
0.3%
Rent to Value Ratio

Active
$684,900
8
bds
|
0
ba
|
3,504
sqft
|
built
1963
2812 Marlin Ave, Las Vegas, NV 89101
$-2,781
Cash flow
-21.2%
Cash-on-Cash Return
1.4%
Cap rate
0.2%
Rent to Value Ratio
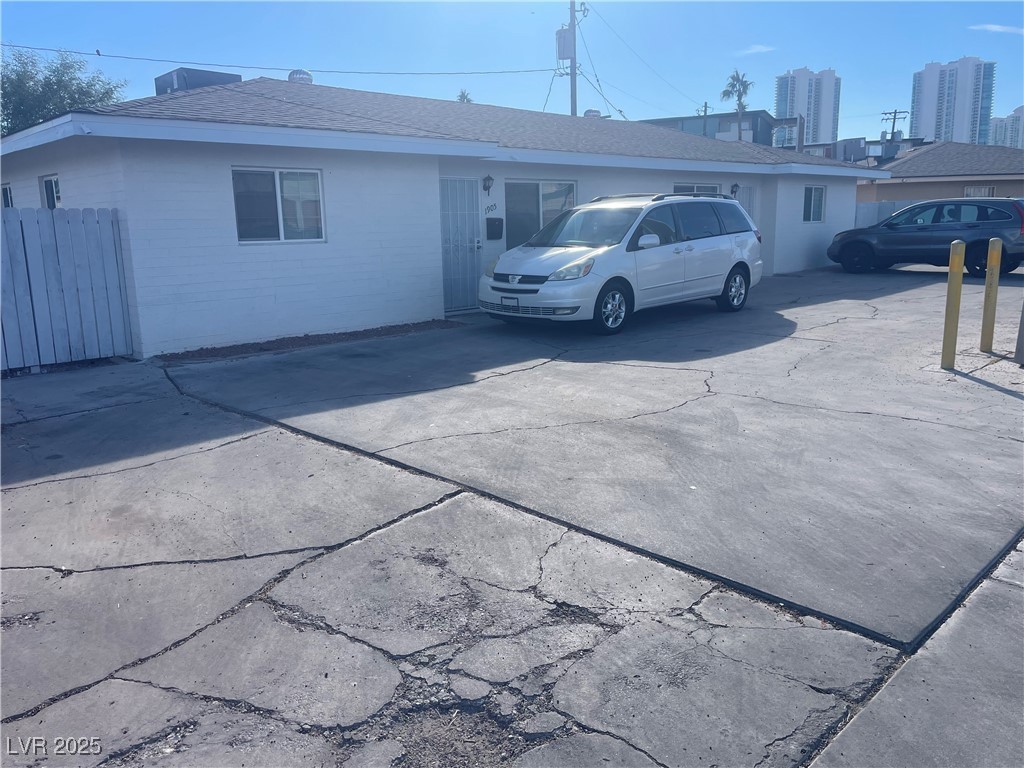
Active
$580,000
4
bds
|
0
ba
|
1,614
sqft
|
built
1951
1905 Weldon Pl, Las Vegas, NV 89104
$-2,371
Cash flow
-21.3%
Cash-on-Cash Return
1.4%
Cap rate
0.2%
Rent to Value Ratio
Active
$559,877
4
bds
|
0
ba
|
2,894
sqft
|
built
1954
1832 Lewis Ave, Las Vegas, NV 89101
$-1,822
Cash flow
-17.0%
Cash-on-Cash Return
2.4%
Cap rate
0.3%
Rent to Value Ratio
Active
$699,000
4
bds
|
0
ba
|
2,381
sqft
|
built
1946
10 E Bonanza Rd, Las Vegas, NV 89101
$-2,659
Cash flow
-19.8%
Cash-on-Cash Return
1.8%
Cap rate
0.2%
Rent to Value Ratio
Active
$380,900
6
bds
|
0
ba
|
3,184
sqft
|
built
1963
709 G St, Las Vegas, NV 89106
$-982
Cash flow
-13.5%
Cash-on-Cash Return
3.2%
Cap rate
0.5%
Rent to Value Ratio
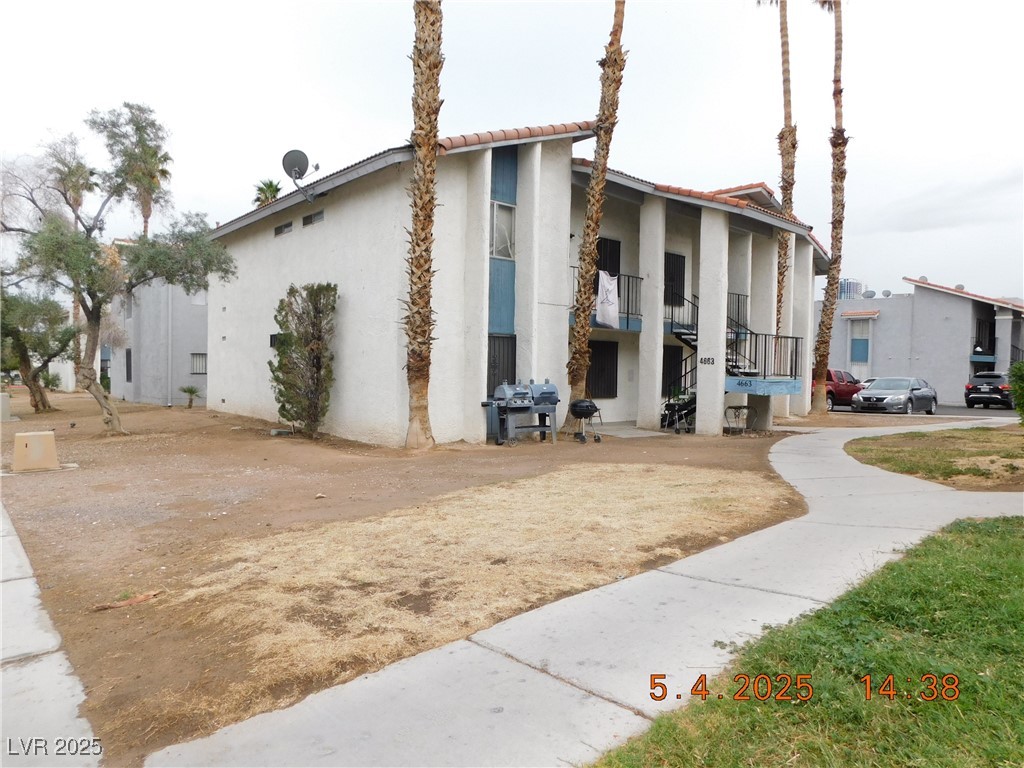
Active
$730,000
8
bds
|
0
ba
|
3,688
sqft
|
built
1977
4663 Sand Creek Ave, Las Vegas, NV 89103
$-2,862
Cash flow
-20.5%
Cash-on-Cash Return
1.6%
Cap rate
0.2%
Rent to Value Ratio
Active
$485,000
4
bds
|
0
ba
|
1,480
sqft
|
built
1942
333 N 13th St, Las Vegas, NV 89101
$-1,757
Cash flow
-18.9%
Cash-on-Cash Return
2.0%
Cap rate
0.3%
Rent to Value Ratio

Active
$599,000
8
bds
|
0
ba
|
3,672
sqft
|
built
1984
4570 Carriage Park Dr, Las Vegas, NV 89121
$-2,671
Cash flow
-23.3%
Cash-on-Cash Return
1.0%
Cap rate
0.2%
Rent to Value Ratio

Active
$315,000
2
bds
|
0
ba
|
768
sqft
|
built
1955
703 Madison Ave, Las Vegas, NV 89106
$-1,333
Cash flow
-22.1%
Cash-on-Cash Return
1.2%
Cap rate
0.2%
Rent to Value Ratio
Active
$649,888
2
bds
|
0
ba
|
1,610
sqft
|
built
1958
612 W Washington Ave, Las Vegas, NV 89106
$-2,291
Cash flow
-18.4%
Cash-on-Cash Return
2.1%
Cap rate
0.3%
Rent to Value Ratio
Active
$559,000
8
bds
|
0
ba
|
3,112
sqft
|
built
1984
2685 Bryandouglas Dr, Las Vegas, NV 89121
$-2,091
Cash flow
-19.5%
Cash-on-Cash Return
1.8%
Cap rate
0.3%
Rent to Value Ratio
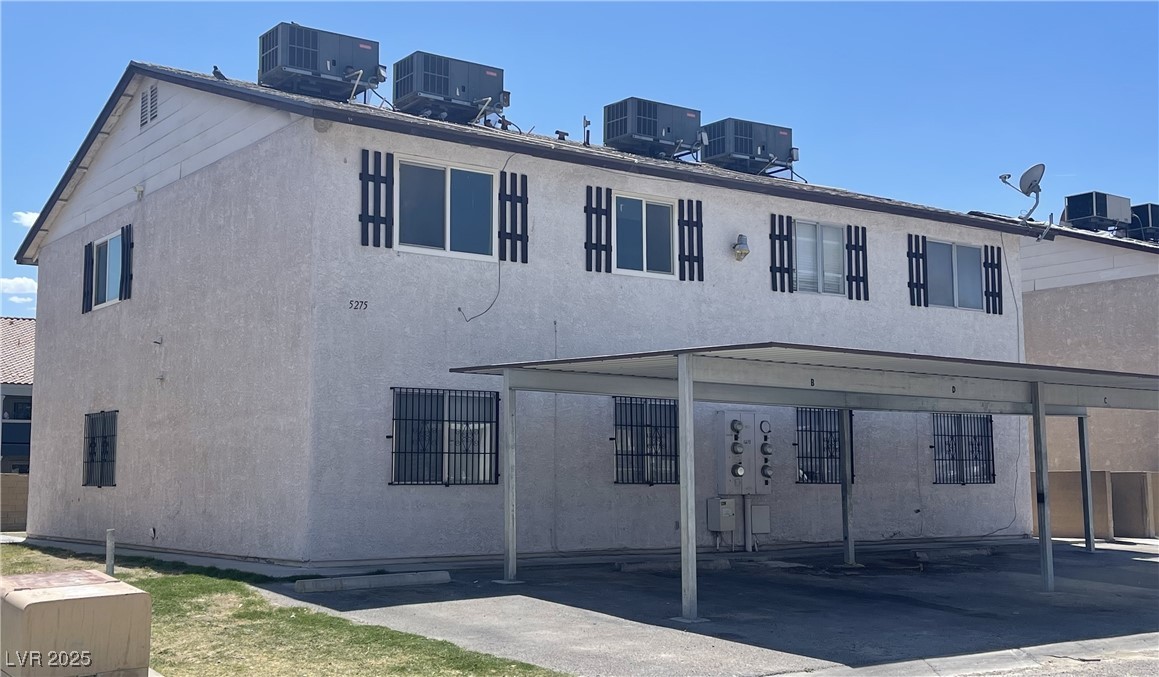
Active
$625,000
8
bds
|
0
ba
|
3,488
sqft
|
built
1985
5275 Hagemann Ln, Las Vegas, NV 89110
$-2,363
Cash flow
-19.7%
Cash-on-Cash Return
1.8%
Cap rate
0.3%
Rent to Value Ratio
Active
$599,000
8
bds
|
0
ba
|
3,672
sqft
|
built
1984
2859 Wheelwright Dr, Las Vegas, NV 89121
$-2,671
Cash flow
-23.3%
Cash-on-Cash Return
1.0%
Cap rate
0.2%
Rent to Value Ratio
Active
$815,000
7
bds
|
0
ba
|
3,568
sqft
|
built
1961
2600 E Bonanza Rd, Las Vegas, NV 89101
$-3,014
Cash flow
-19.3%
Cash-on-Cash Return
1.9%
Cap rate
0.2%
Rent to Value Ratio
Active
$475,000
5
bds
|
0
ba
|
1,826
sqft
|
built
1954
2409 Maroney Ave, Las Vegas, NV 89104
$-1,541
Cash flow
-16.9%
Cash-on-Cash Return
2.4%
Cap rate
0.3%
Rent to Value Ratio
Active
$514,900
5
bds
|
0
ba
|
1,796
sqft
|
built
1954
1317 Exley Ave, Las Vegas, NV 89104
$-1,933
Cash flow
-19.6%
Cash-on-Cash Return
1.8%
Cap rate
0.3%
Rent to Value Ratio
Active
$620,000
1
bds
|
0
ba
|
1,196
sqft
|
built
1977
5225 Gray Ln, Las Vegas, NV 89119
$-2,673
Cash flow
-22.5%
Cash-on-Cash Return
1.1%
Cap rate
0.1%
Rent to Value Ratio
Active
$750,000
bds
|
0
ba
|
2,792
sqft
|
built
1934
330 N 9th St, Las Vegas, NV 89101
$-2,196
Cash flow
-15.3%
Cash-on-Cash Return
2.8%
Cap rate
0.4%
Rent to Value Ratio

Active
$619,000
6
bds
|
0
ba
|
2,870
sqft
|
built
1962
2513 Cedar Ave, Las Vegas, NV 89101
$-2,281
Cash flow
-19.2%
Cash-on-Cash Return
1.9%
Cap rate
0.3%
Rent to Value Ratio
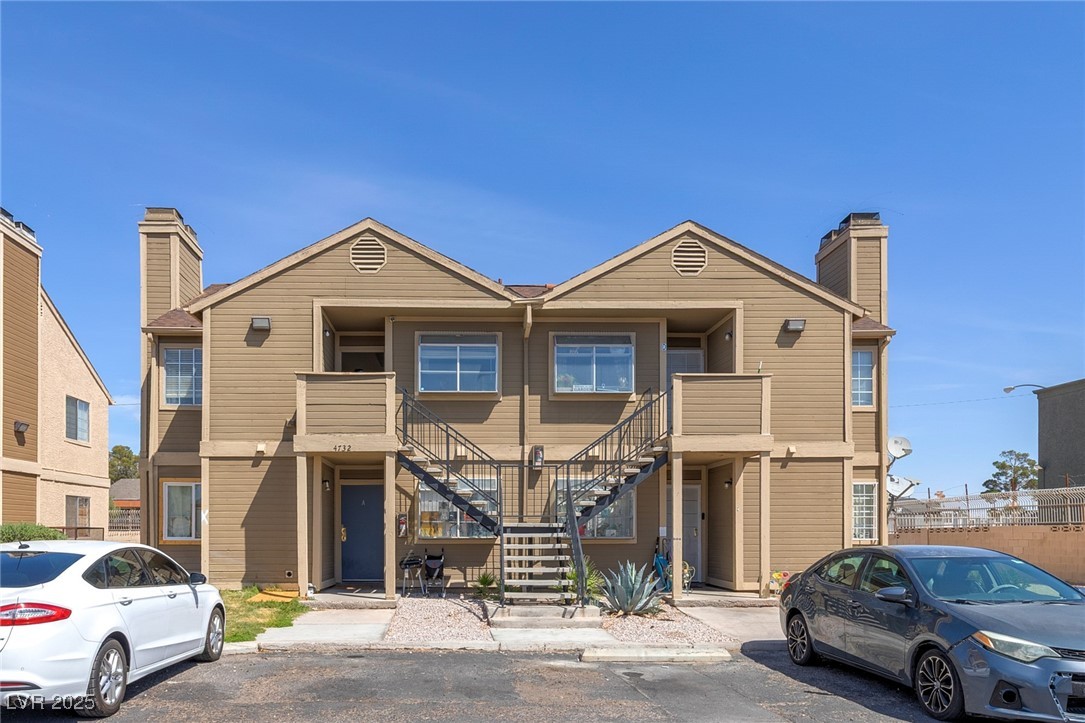
Active
$614,700
8
bds
|
0
ba
|
3,112
sqft
|
built
1984
4732 Krissylouise Way, Las Vegas, NV 89121
$-2,308
Cash flow
-19.6%
Cash-on-Cash Return
1.8%
Cap rate
0.3%
Rent to Value Ratio
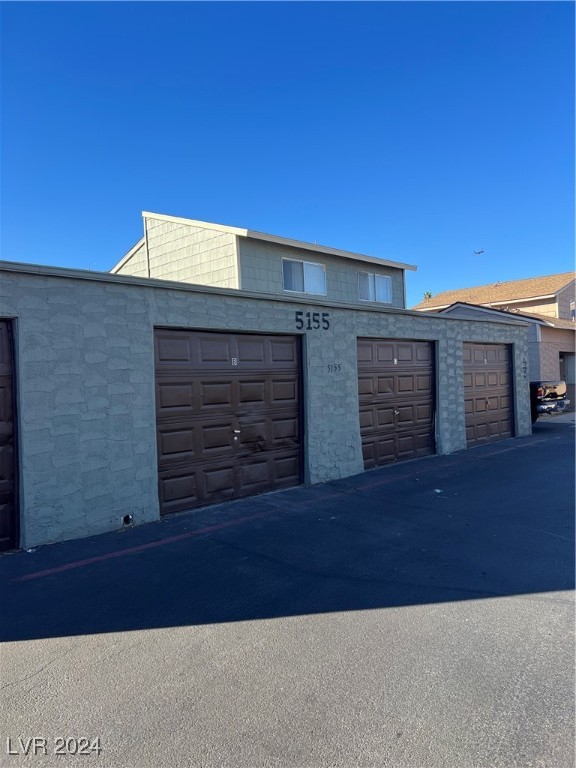
Active
$655,000
7
bds
|
0
ba
|
3,748
sqft
|
built
1977
5155 Gray Ln, Las Vegas, NV 89119
$-2,481
Cash flow
-19.8%
Cash-on-Cash Return
1.8%
Cap rate
0.2%
Rent to Value Ratio
Active
$700,000
4
bds
|
0
ba
|
1,613
sqft
|
built
1950
1902 Weldon Pl, Las Vegas, NV 89104
$-2,863
Cash flow
-21.3%
Cash-on-Cash Return
1.4%
Cap rate
0.2%
Rent to Value Ratio
Active
$1,699,999
2
bds
|
0
ba
|
1,760
sqft
|
built
1951
2294 N Pecos Rd, Las Vegas, NV 89115
$-7,746
Cash flow
-23.8%
Cash-on-Cash Return
0.8%
Cap rate
0.1%
Rent to Value Ratio
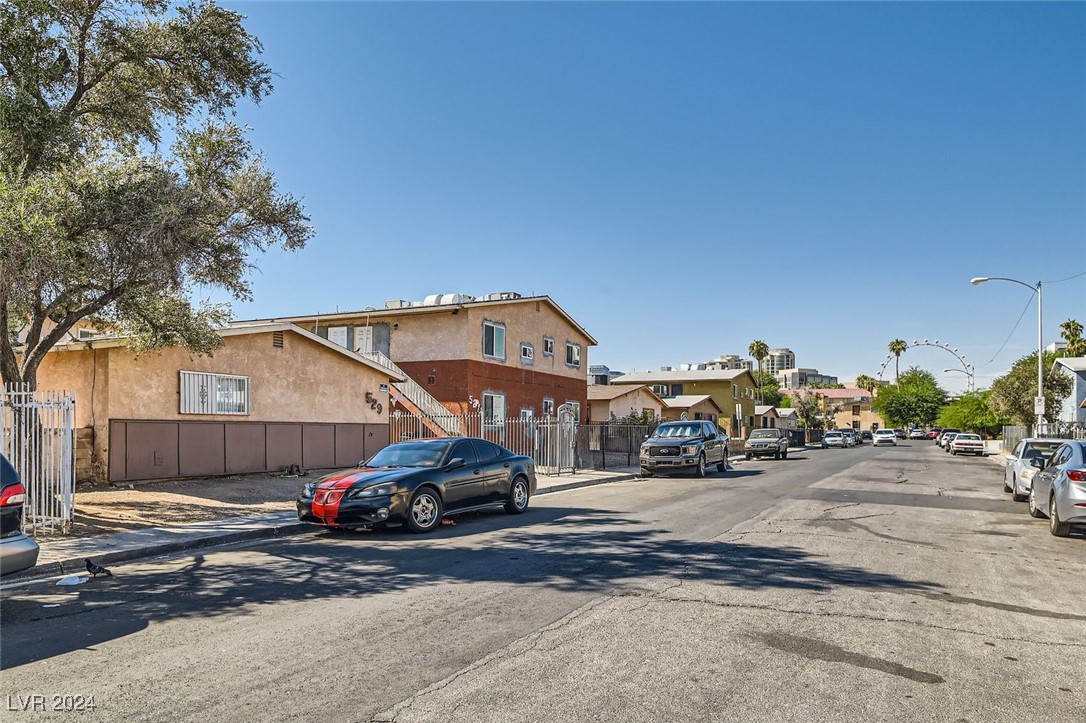
Active
$565,000
8
bds
|
0
ba
|
3,345
sqft
|
built
1963
529 Mc Kellar Cir, Las Vegas, NV 89119
$-2,139
Cash flow
-19.8%
Cash-on-Cash Return
1.8%
Cap rate
0.2%
Rent to Value Ratio
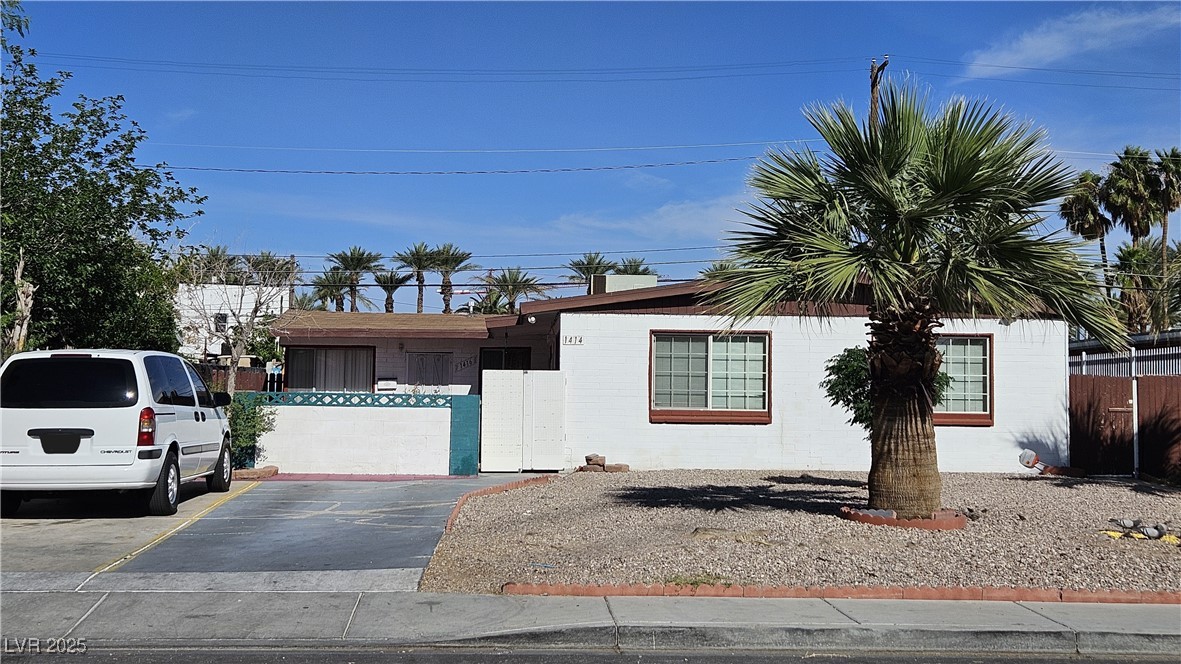
Active
$420,000
5
bds
|
0
ba
|
1,995
sqft
|
built
1954
1414 Rexford Pl, Las Vegas, NV 89104
$-1,342
Cash flow
-16.7%
Cash-on-Cash Return
2.5%
Cap rate
0.3%
Rent to Value Ratio
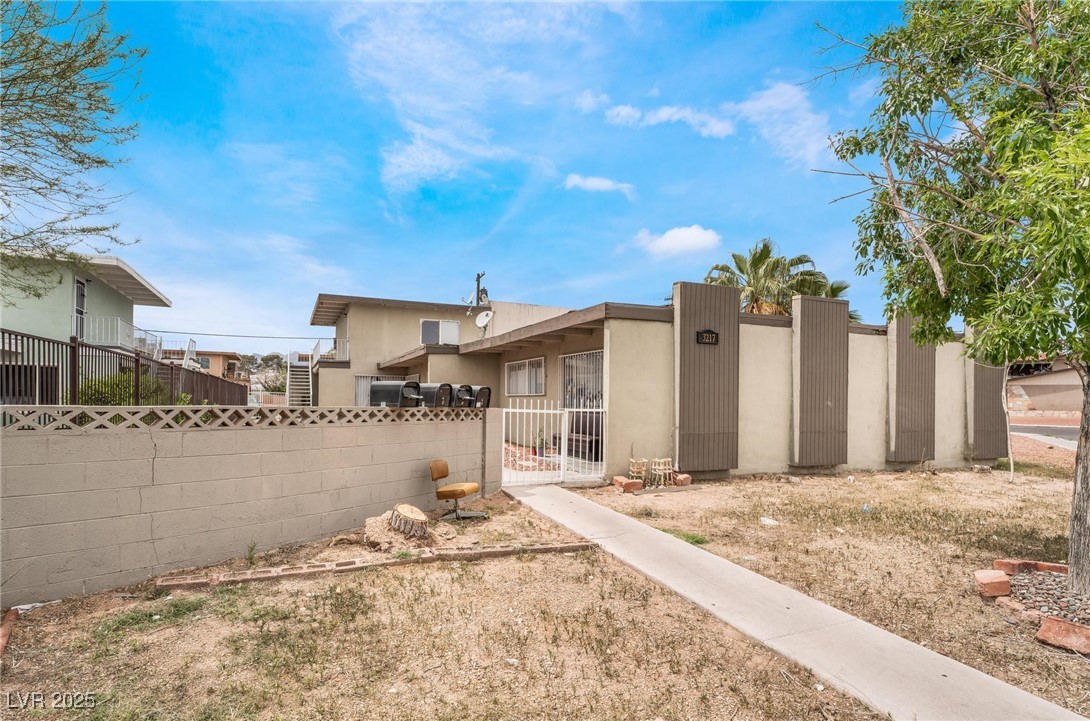
Active
$619,900
7
bds
|
0
ba
|
3,634
sqft
|
built
1964
3217 Joann Way, Las Vegas, NV 89108
$-2,033
Cash flow
-17.1%
Cash-on-Cash Return
2.4%
Cap rate
0.3%
Rent to Value Ratio
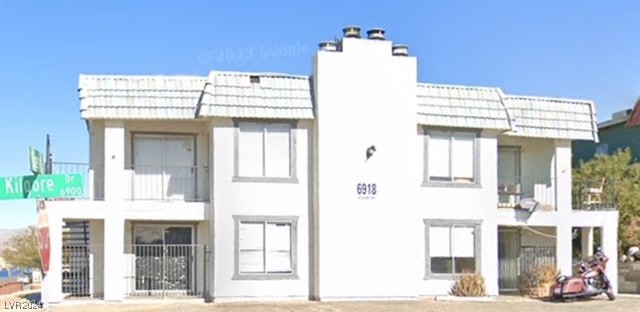
Active
$675,000
8
bds
|
0
ba
|
3,892
sqft
|
built
1984
6918 Kilgore Dr, Las Vegas, NV 89156
$-2,587
Cash flow
-20.0%
Cash-on-Cash Return
1.7%
Cap rate
0.2%
Rent to Value Ratio
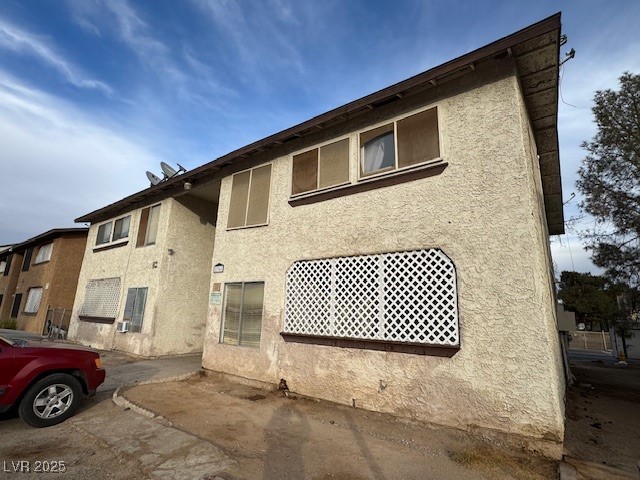
Active
$675,000
8
bds
|
0
ba
|
3,672
sqft
|
built
1984
2761 Mountain Vista St, Las Vegas, NV 89121
$-2,614
Cash flow
-20.2%
Cash-on-Cash Return
1.7%
Cap rate
0.2%
Rent to Value Ratio
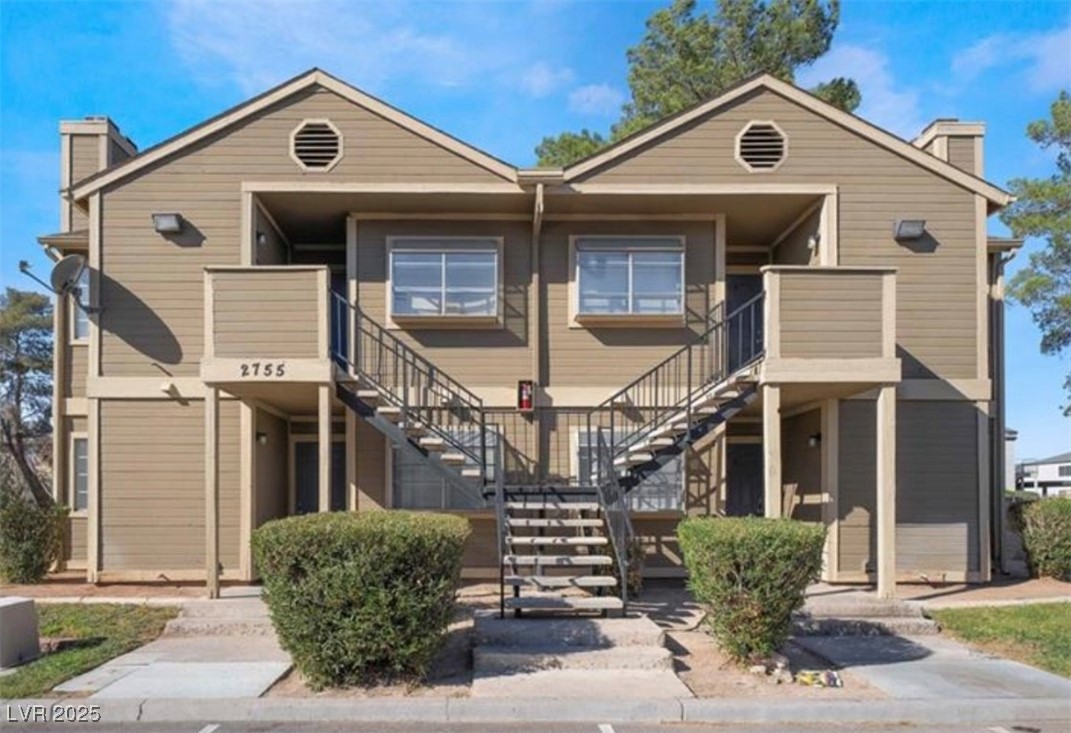
Active
$585,000
8
bds
|
0
ba
|
3,112
sqft
|
built
1984
2755 Jennydiane Dr, Las Vegas, NV 89121
$-2,587
Cash flow
-23.1%
Cash-on-Cash Return
1.0%
Cap rate
0.2%
Rent to Value Ratio
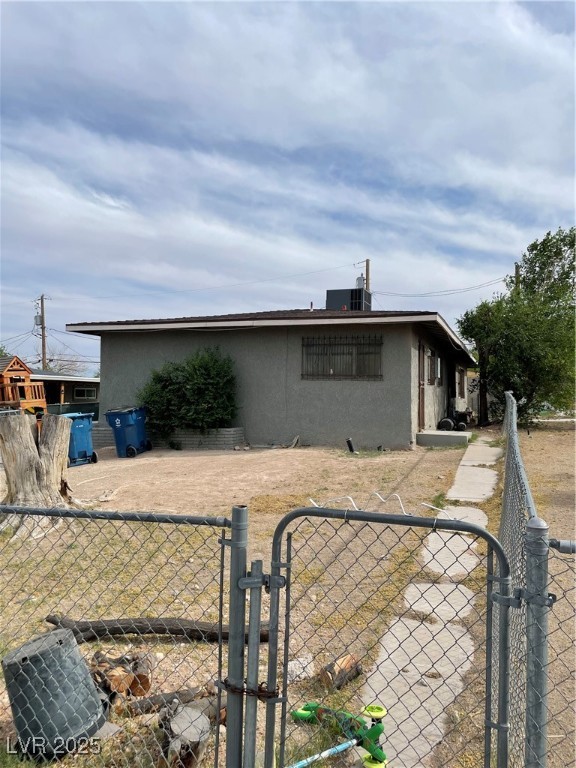
Active
$395,000
5
bds
|
0
ba
|
1,833
sqft
|
built
1954
221 George Pl, Las Vegas, NV 89106
$-1,370
Cash flow
-18.1%
Cash-on-Cash Return
2.2%
Cap rate
0.3%
Rent to Value Ratio
Active
$725,000
8
bds
|
0
ba
|
3,420
sqft
|
built
1981
4150 Solteros St, Las Vegas, NV 89103
$-2,630
Cash flow
-18.9%
Cash-on-Cash Return
2.0%
Cap rate
0.3%
Rent to Value Ratio

Active
$1,289,000
10
bds
|
0
ba
|
4,309
sqft
|
built
1999
3735 Sand Pier St, Las Vegas, NV 89147
$-5,715
Cash flow
-23.1%
Cash-on-Cash Return
1.0%
Cap rate
0.2%
Rent to Value Ratio

Active
$599,000
3
bds
|
0
ba
|
2,444
sqft
|
built
1959
1834 E Bonanza Rd, Las Vegas, NV 89101
$-2,125
Cash flow
-18.5%
Cash-on-Cash Return
2.1%
Cap rate
0.3%
Rent to Value Ratio
Active
$299,900
2
bds
|
0
ba
|
910
sqft
|
built
1951
1140 Laurel Ave, Las Vegas, NV 89104
$-1,137
Cash flow
-19.8%
Cash-on-Cash Return
1.8%
Cap rate
0.2%
Rent to Value Ratio
Active
$514,900
5
bds
|
0
ba
|
1,786
sqft
|
built
1954
1309 Exley Ave, Las Vegas, NV 89104
$-1,894
Cash flow
-19.2%
Cash-on-Cash Return
1.9%
Cap rate
0.3%
Rent to Value Ratio
Active
$620,000
8
bds
|
0
ba
|
3,212
sqft
|
built
1986
4211 Terrestrial Ln, Las Vegas, NV 89115
$-2,398
Cash flow
-20.2%
Cash-on-Cash Return
1.7%
Cap rate
0.3%
Rent to Value Ratio

Active
$658,800
8
bds
|
0
ba
|
3,660
sqft
|
built
1951
1707 Santa Paula Dr, Las Vegas, NV 89104
$-2,361
Cash flow
-18.7%
Cash-on-Cash Return
2.0%
Cap rate
0.3%
Rent to Value Ratio
Active
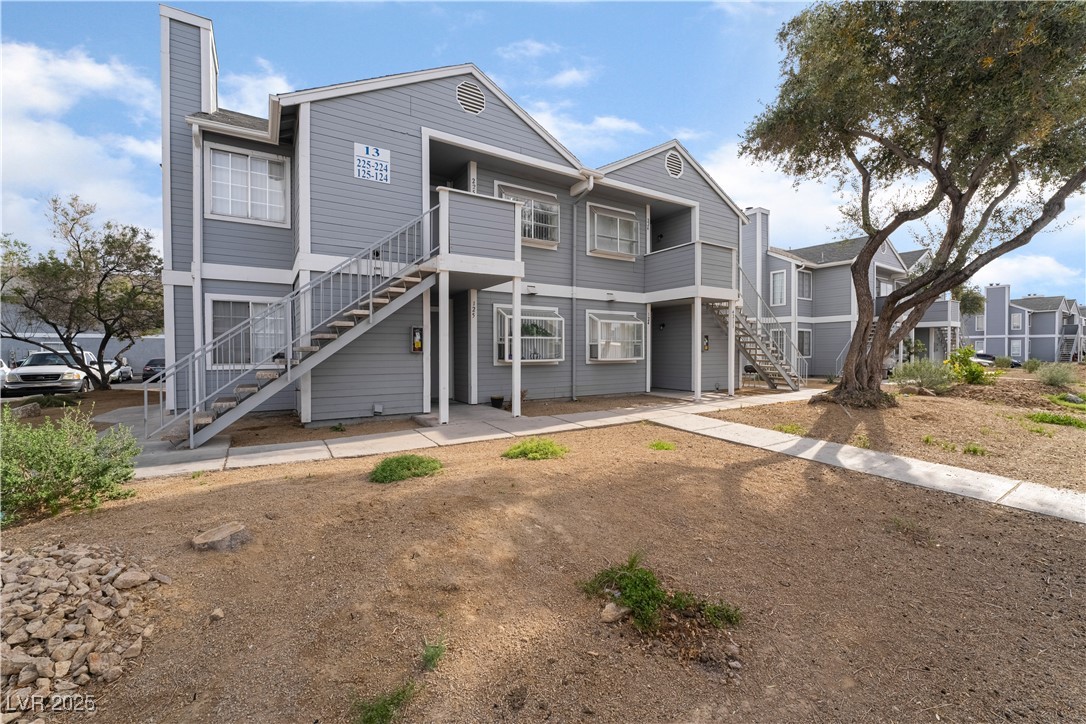
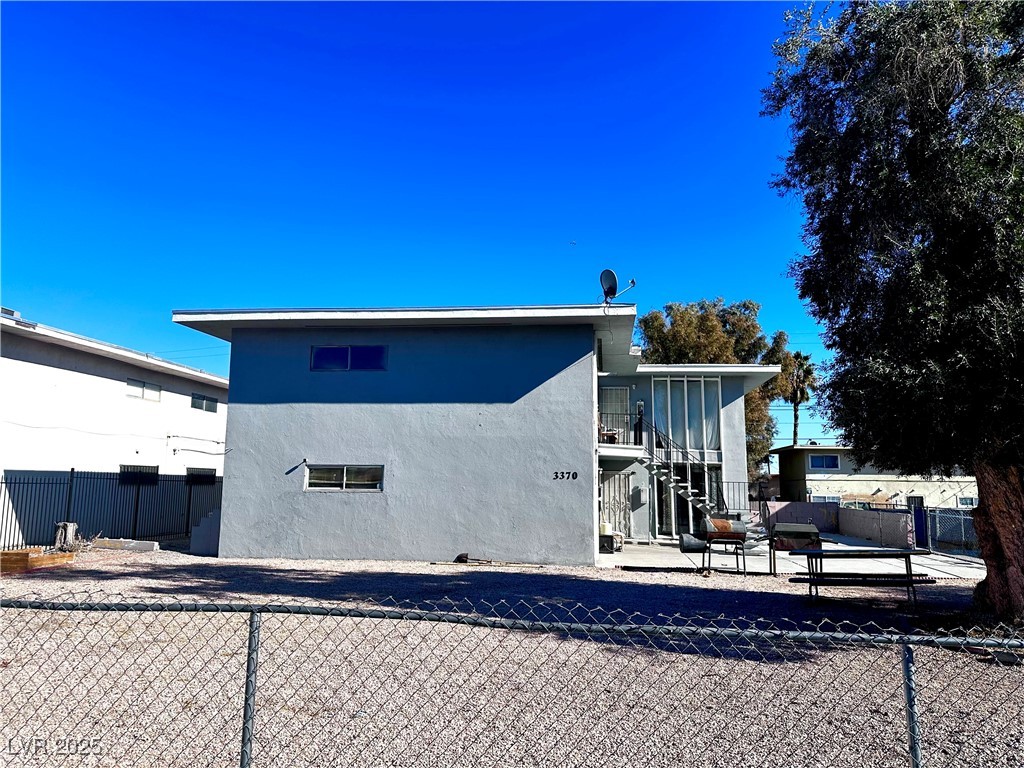
$634,900
9
bds
|
0
ba
|
3,336
sqft
|
built
1963
3370 Athens St, Las Vegas, NV 89169
$-2,397
Cash flow
-19.7%
Cash-on-Cash Return
1.8%
Cap rate
0.3%
Rent to Value Ratio