Las Vegas, NV Investment Properties for Sale
Browse homes for sale and investment properties in Las Vegas, NV. Refine your search by price, property type, or more.
Best cash flowing properties in Las Vegas, NV
Active
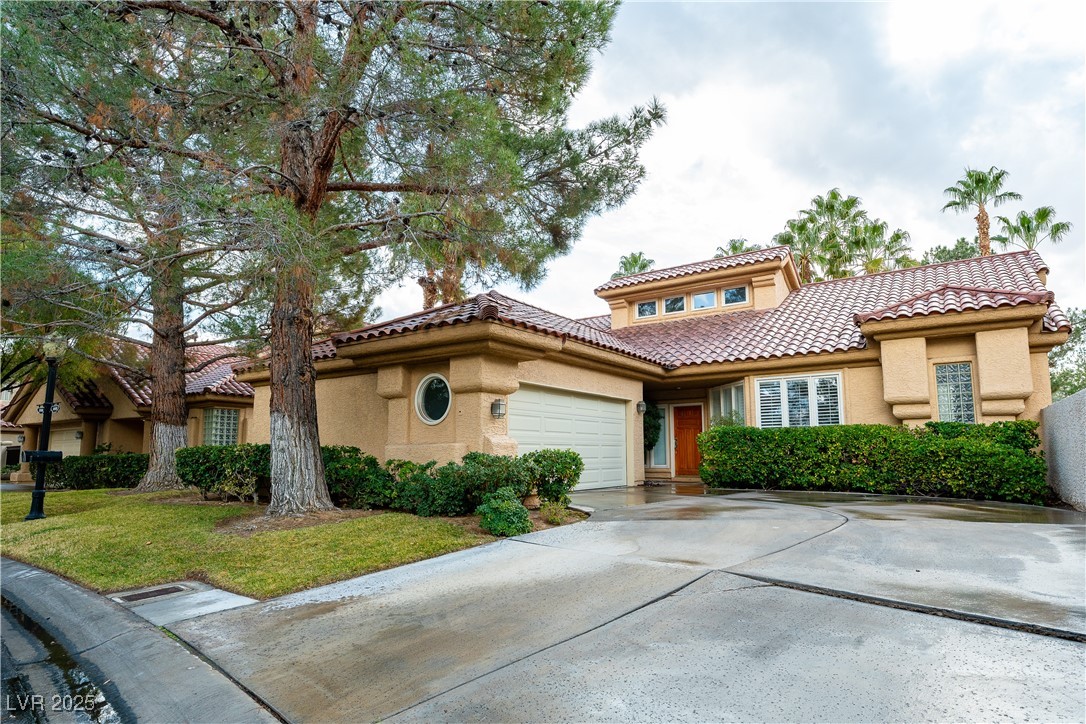
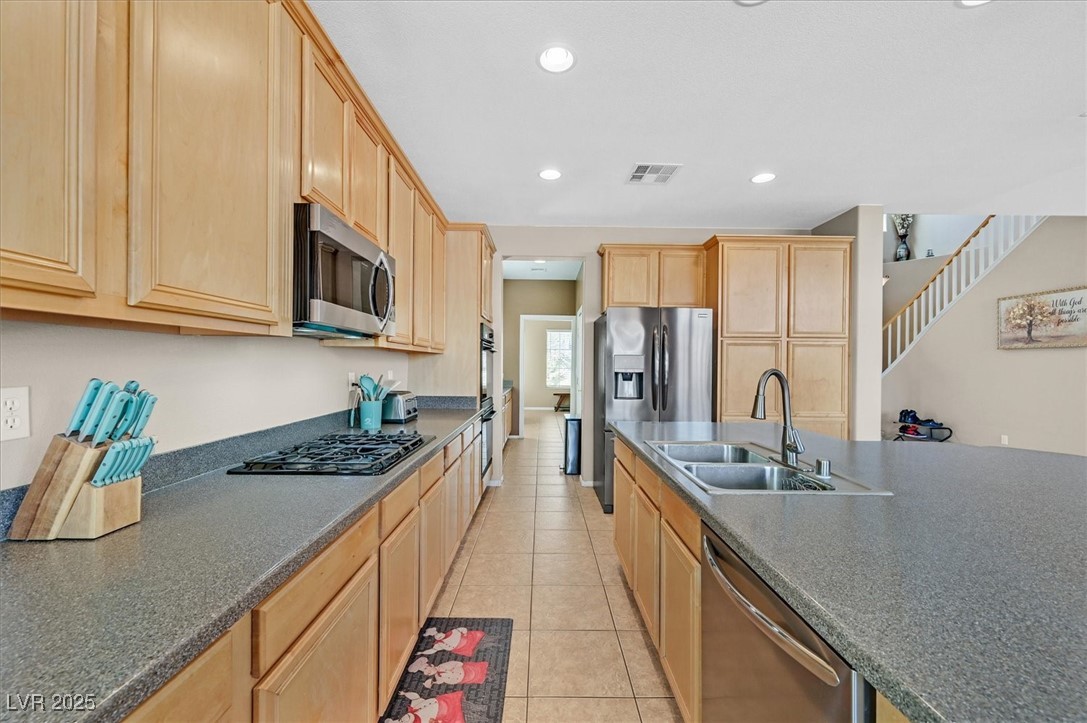
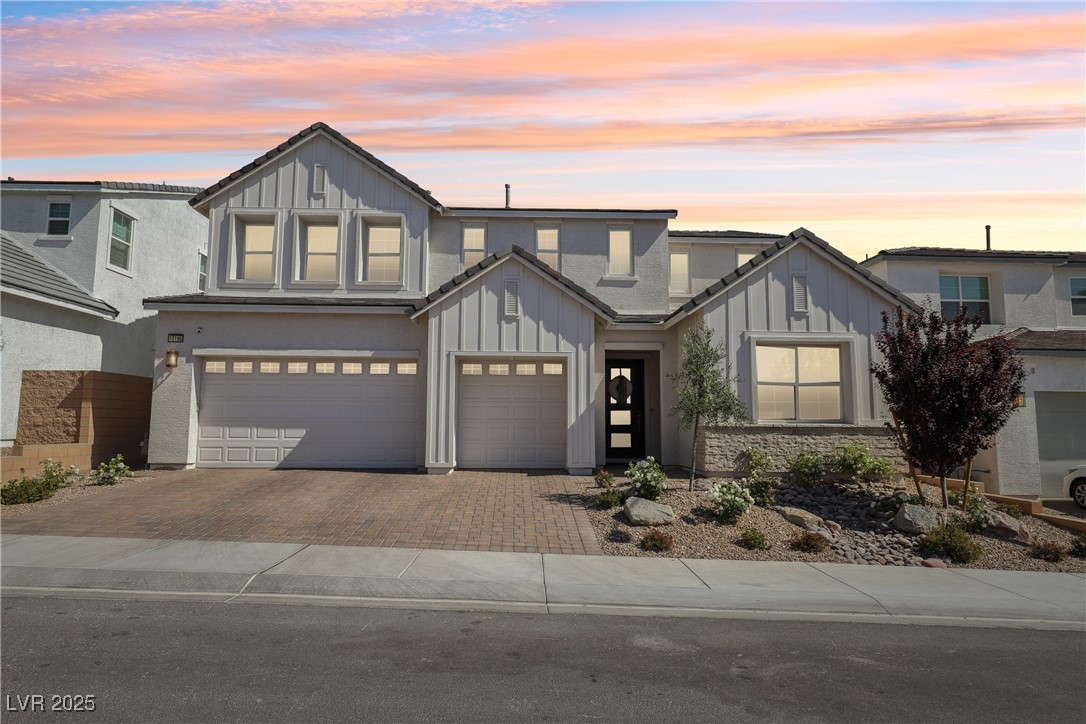
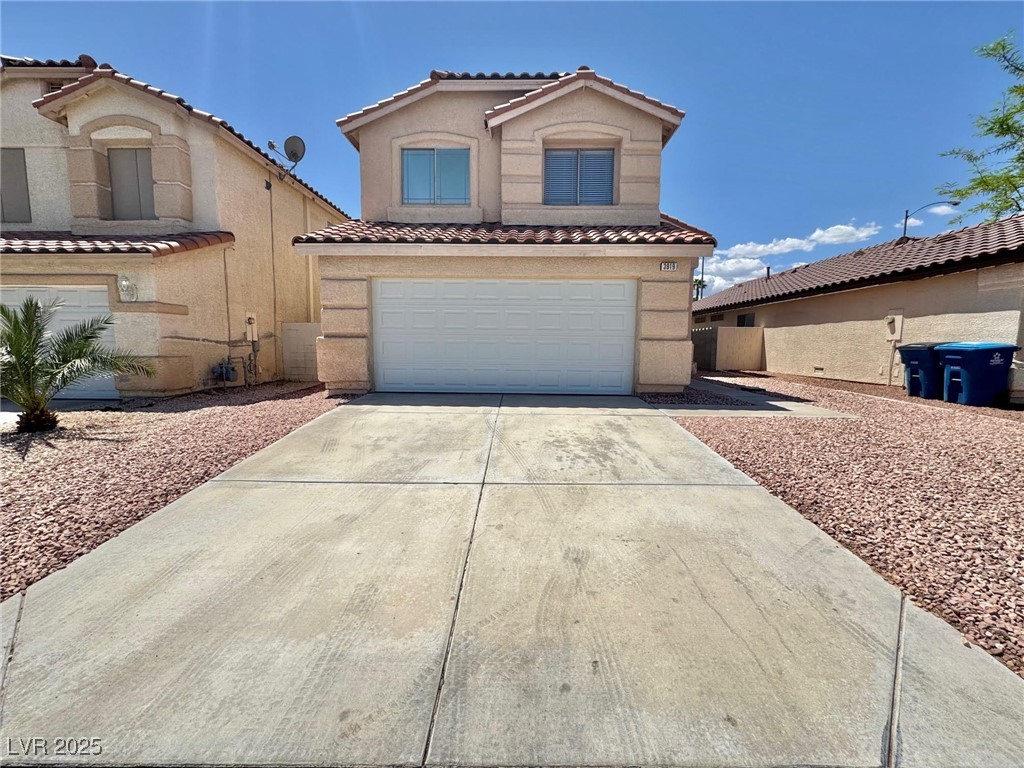
$599,500
3
bds
|
3
ba
|
2,394
sqft
|
built
1995
4381 Flagship Ct, Las Vegas, NV 89121
$-440
Cash flow
-3.8%
Cash-on-Cash Return
4.8%
Cap rate
0.6%
Rent to Value Ratio
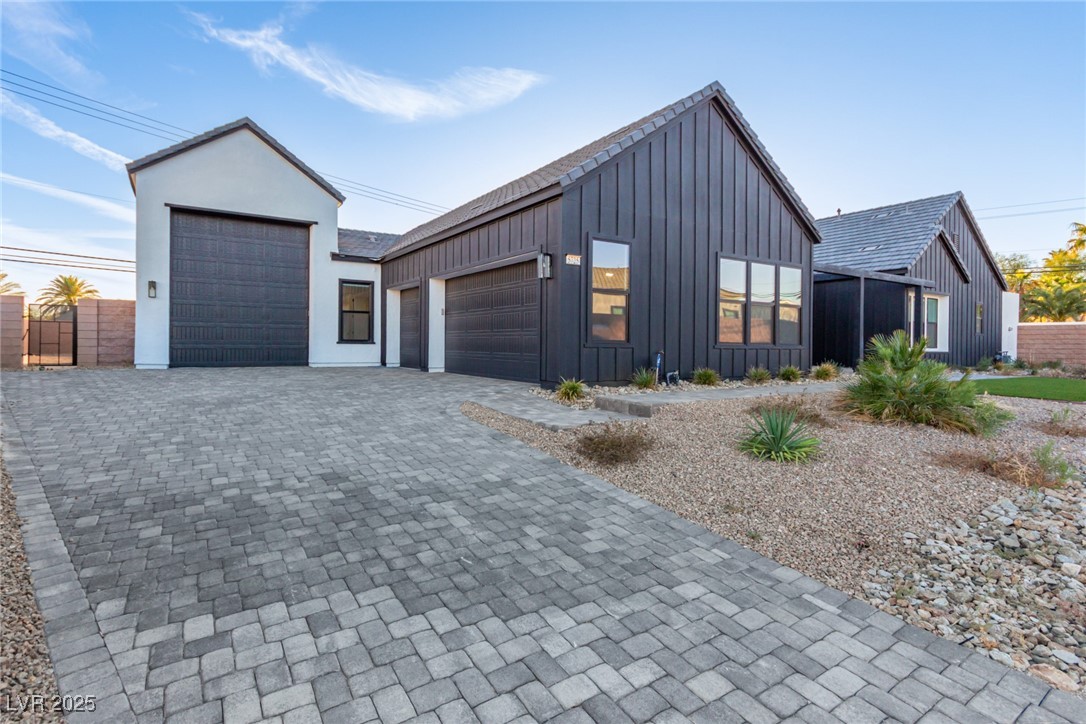
Active
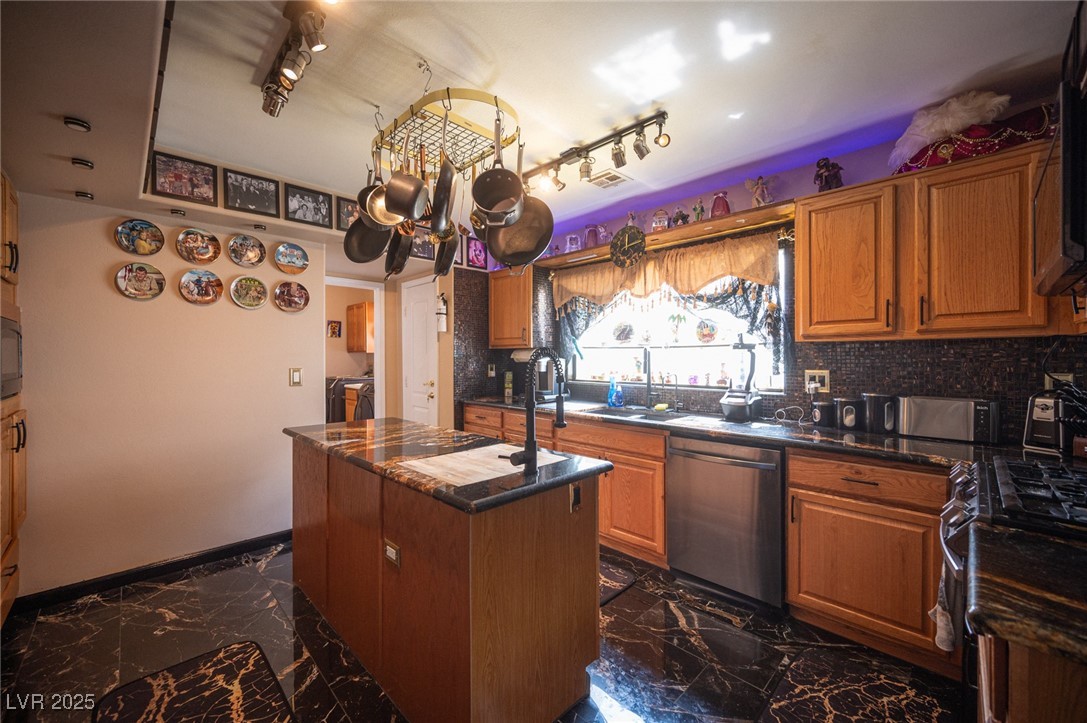
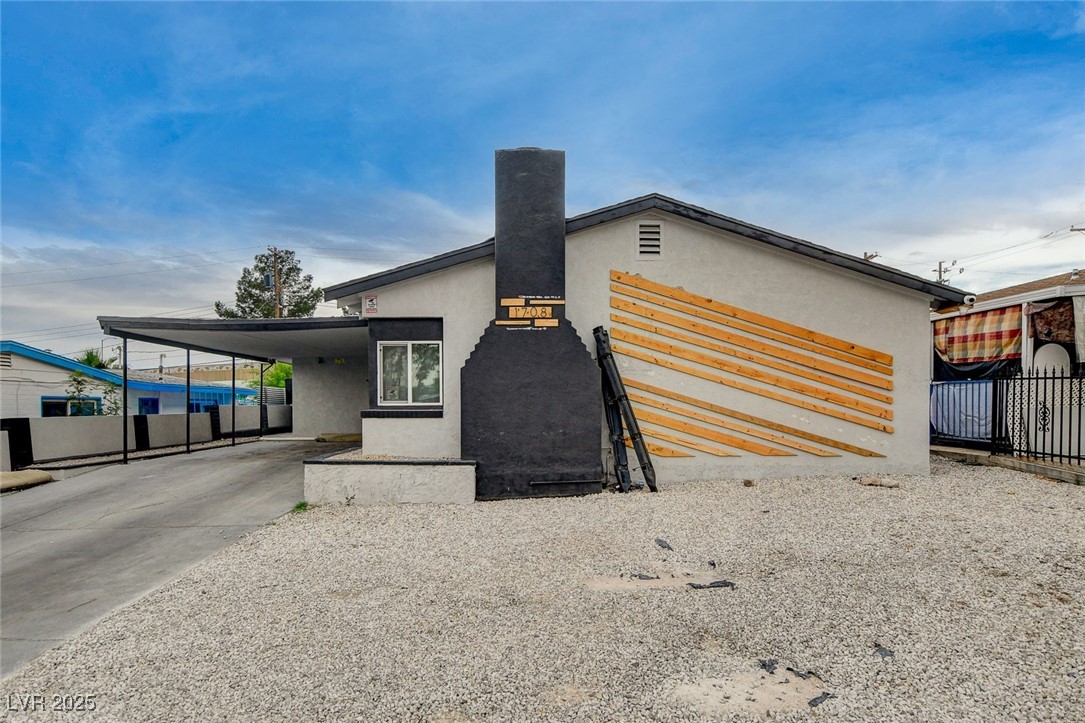
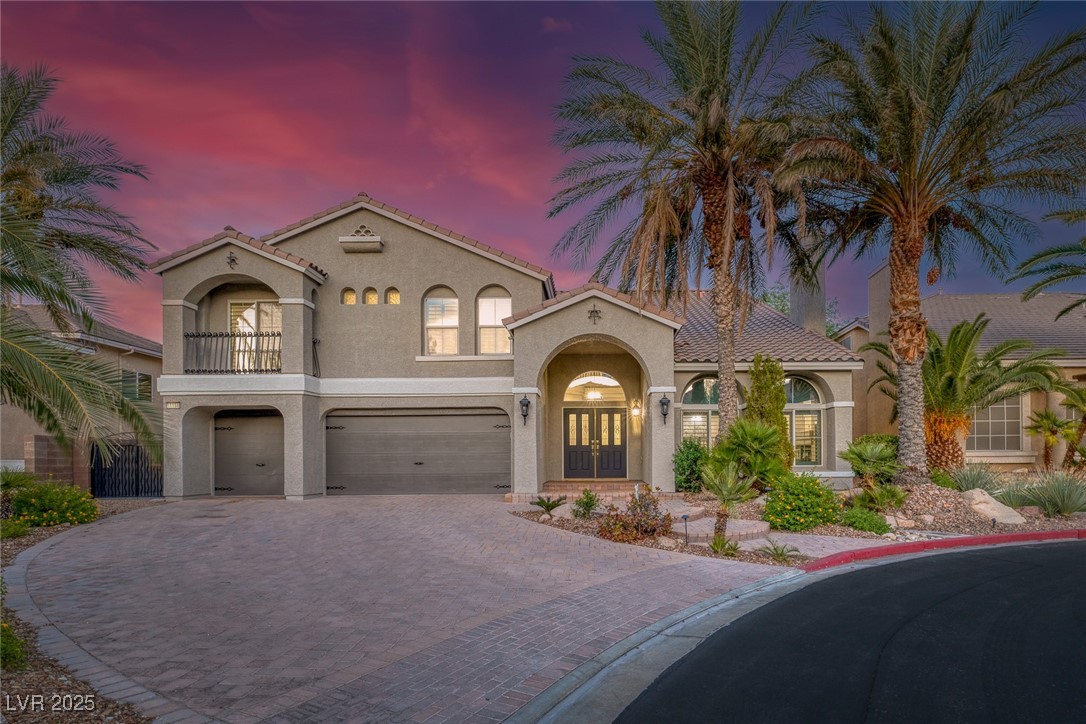
$470,000
4
bds
|
2
ba
|
1,504
sqft
|
built
1952
1708 Poplar Ave, Las Vegas, NV 89101
$-692
Cash flow
-7.7%
Cash-on-Cash Return
3.9%
Cap rate
0.5%
Rent to Value Ratio
5,582 out of 5,714 properties for sale in Las Vegas, NV
Limited Results Shown
Create a free account, or log in to reveal all property listings and enjoy the complete experience.
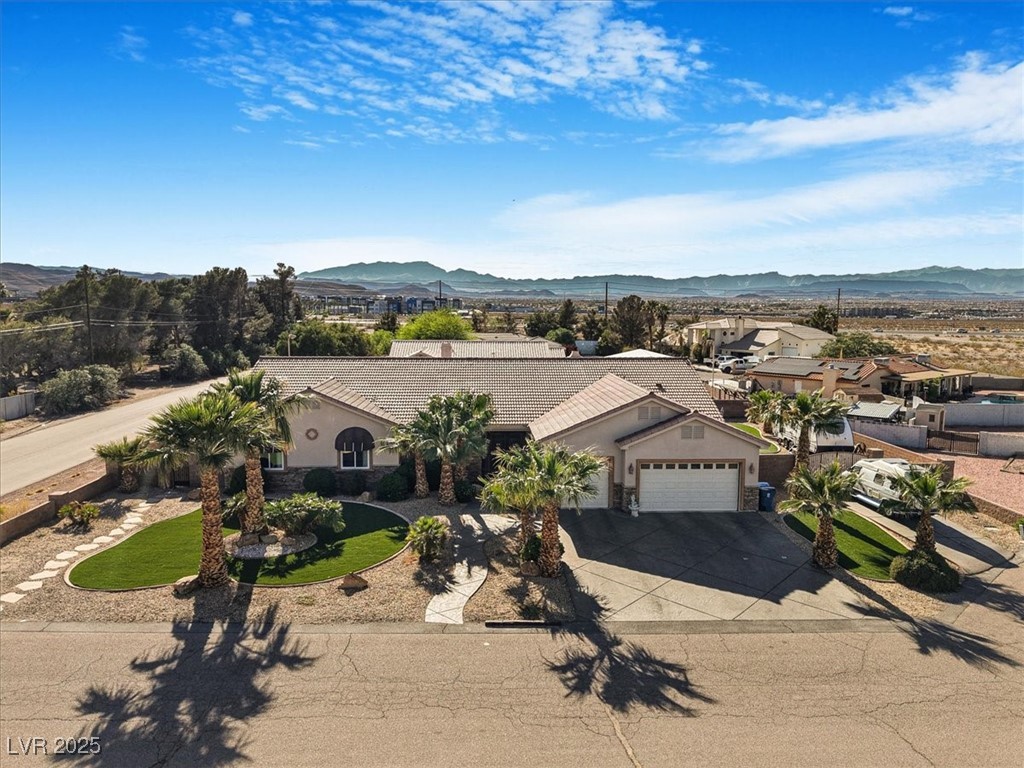
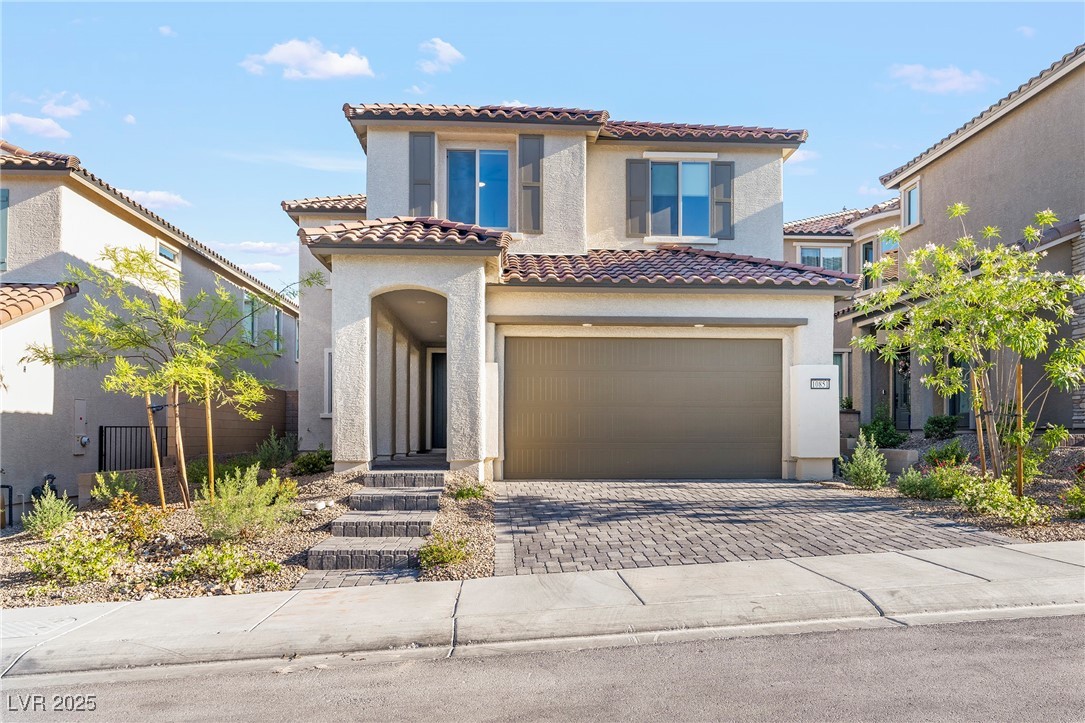
Active
$549,900
3
bds
|
2
ba
|
1,720
sqft
|
built
1997
9324 Pitching Wedge Dr, Las Vegas, NV 89134
$-1,878
Cash flow
-17.8%
Cash-on-Cash Return
1.6%
Cap rate
0.3%
Rent to Value Ratio
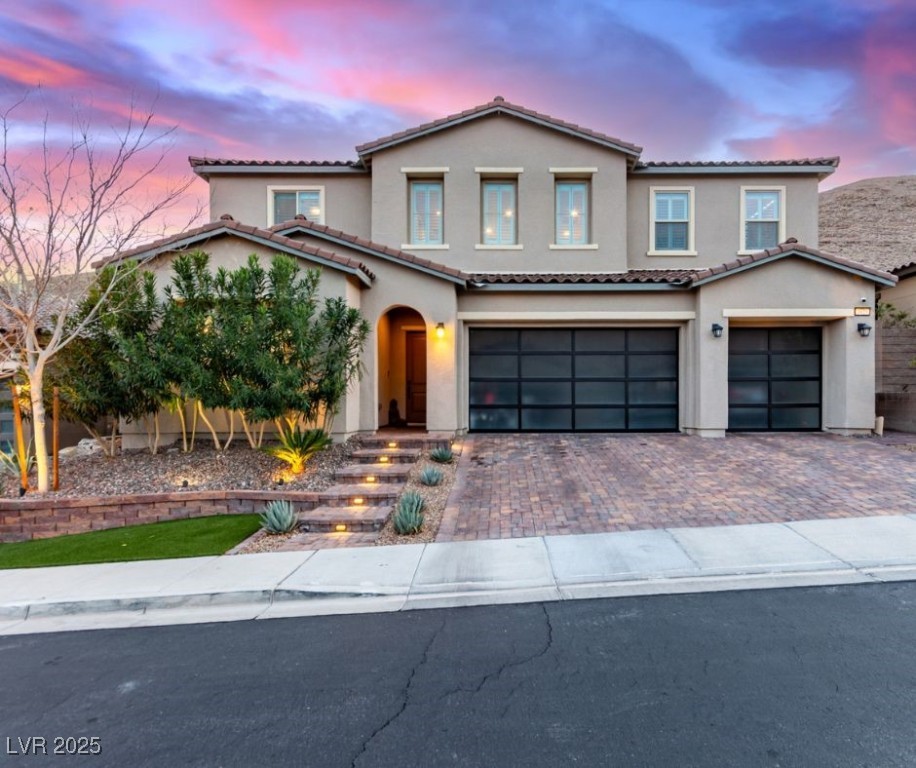
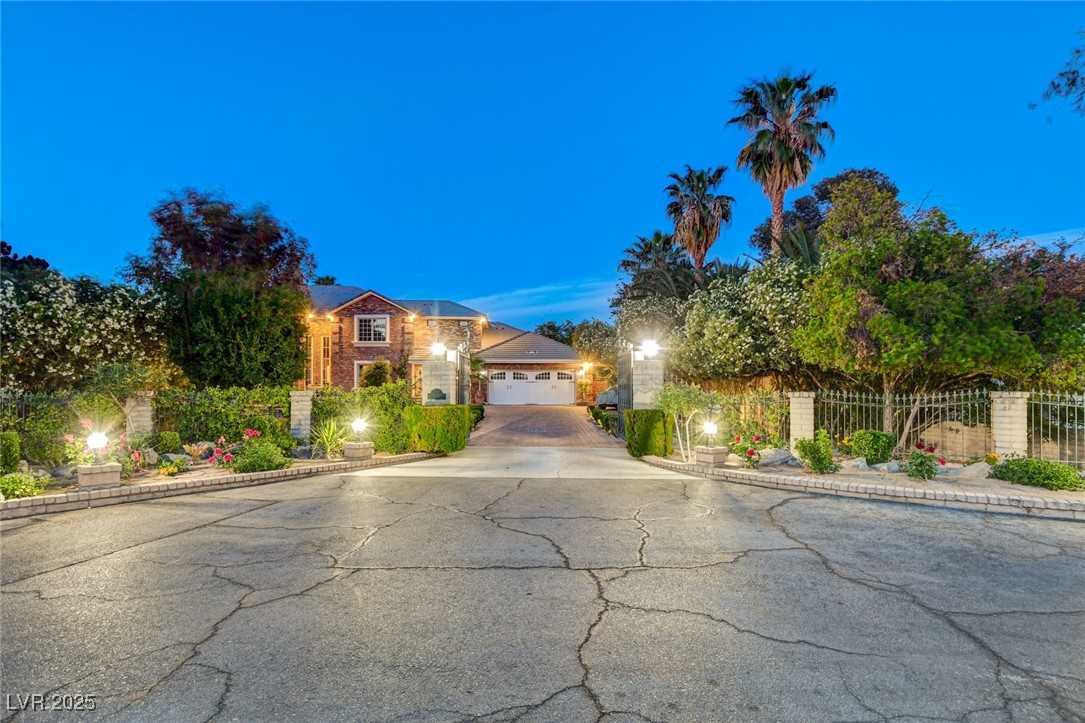
Active
$360,000
3
bds
|
3
ba
|
1,477
sqft
|
built
2023
4924 Chidlaw Ave, Las Vegas, NV 89115
$-944
Cash flow
-13.7%
Cash-on-Cash Return
2.5%
Cap rate
0.5%
Rent to Value Ratio
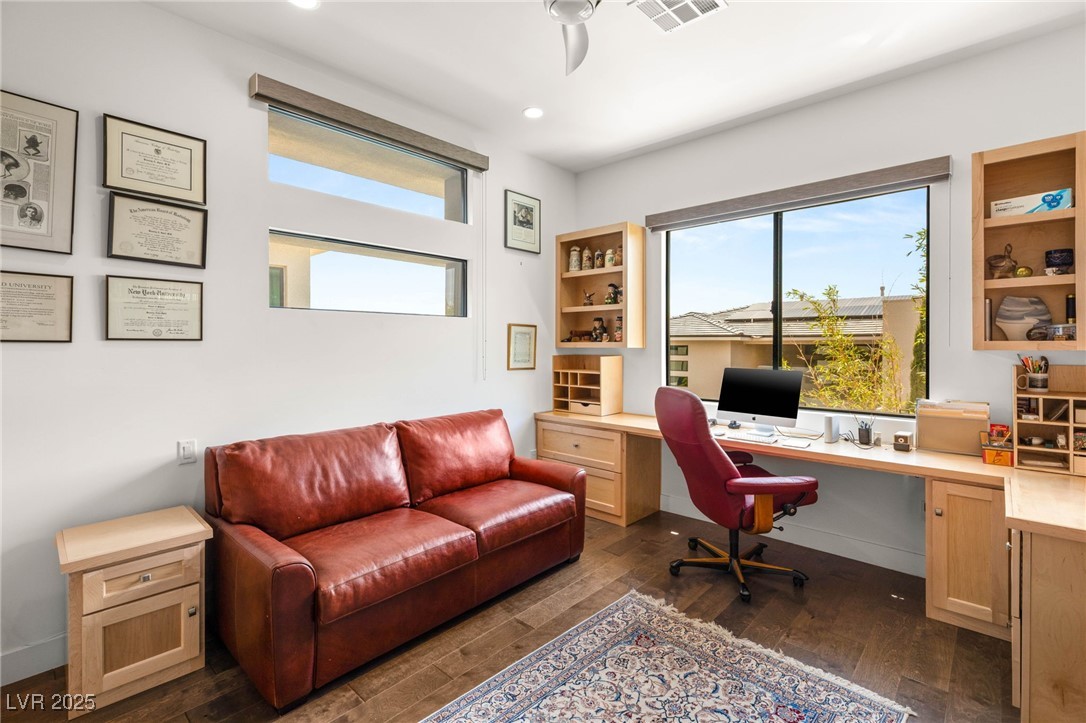
Active
$798,000
2
bds
|
3
ba
|
2,105
sqft
|
built
1987
8169 Pinnacle Peak Ave, Las Vegas, NV 89113
$-2,073
Cash flow
-13.6%
Cash-on-Cash Return
2.6%
Cap rate
0.5%
Rent to Value Ratio
Active
$759,888
5
bds
|
4
ba
|
3,545
sqft
|
built
2005
8828 Monte Oro Dr, Las Vegas, NV 89131
$-1,578
Cash flow
-10.8%
Cash-on-Cash Return
3.2%
Cap rate
0.5%
Rent to Value Ratio
Active
$674,999
4
bds
|
3
ba
|
3,135
sqft
|
built
1988
9909 Barrier Reef Dr, Las Vegas, NV 89117
$-1,065
Cash flow
-8.2%
Cash-on-Cash Return
3.8%
Cap rate
0.5%
Rent to Value Ratio
Active
$1,175,000
5
bds
|
5
ba
|
5,266
sqft
|
built
2005
11158 Antonine Wall Ct, Las Vegas, NV 89141
$-1,903
Cash flow
-8.4%
Cash-on-Cash Return
3.7%
Cap rate
0.5%
Rent to Value Ratio
Active
$1,049,800
3
bds
|
3
ba
|
2,933
sqft
|
built
2015
12273 Catanzaro Ave, Las Vegas, NV 89138
$-2,401
Cash flow
-11.9%
Cash-on-Cash Return
2.9%
Cap rate
0.5%
Rent to Value Ratio
Active
$305,000
3
bds
|
2
ba
|
1,223
sqft
|
built
2004
3500 Cactus Shadow St, Las Vegas, NV 89129
$-712
Cash flow
-12.2%
Cash-on-Cash Return
2.9%
Cap rate
0.5%
Rent to Value Ratio
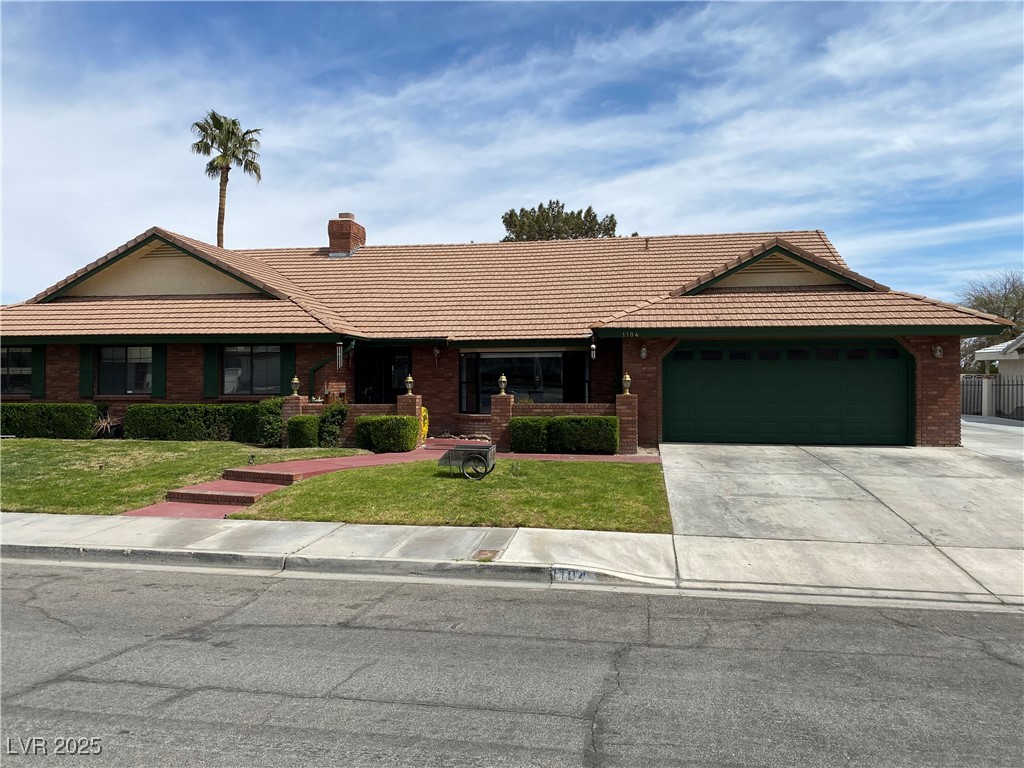
Active
$595,000
4
bds
|
3
ba
|
2,942
sqft
|
built
1987
1104 Oak Tree Ln, Las Vegas, NV 89108
$-1,231
Cash flow
-10.8%
Cash-on-Cash Return
3.2%
Cap rate
0.4%
Rent to Value Ratio
Active
$599,500
3
bds
|
3
ba
|
2,394
sqft
|
built
1995
4381 Flagship Ct, Las Vegas, NV 89121
$-440
Cash flow
-3.8%
Cash-on-Cash Return
4.8%
Cap rate
0.6%
Rent to Value Ratio
Active
$240,000
2
bds
|
2
ba
|
1,256
sqft
|
built
1975
3930 University Center Dr, Las Vegas, NV 89119
$-803
Cash flow
-17.5%
Cash-on-Cash Return
1.7%
Cap rate
0.6%
Rent to Value Ratio
Active
$599,999
3
bds
|
3
ba
|
2,346
sqft
|
built
1993
7821 Paper Flower Ct, Las Vegas, NV 89128
$-1,506
Cash flow
-13.1%
Cash-on-Cash Return
2.7%
Cap rate
0.4%
Rent to Value Ratio
Active
$649,999
3
bds
|
2
ba
|
1,847
sqft
|
built
2022
9993 Skye Gazer Ave, Las Vegas, NV 89166
$-2,073
Cash flow
-16.6%
Cash-on-Cash Return
1.9%
Cap rate
0.4%
Rent to Value Ratio
Active
$725,000
5
bds
|
4
ba
|
3,971
sqft
|
built
2022
6346 Rock Stream Ln, Las Vegas, NV 89141
$-1,978
Cash flow
-14.2%
Cash-on-Cash Return
2.4%
Cap rate
0.4%
Rent to Value Ratio
Active
$273,600
2
bds
|
2
ba
|
1,089
sqft
|
built
1997
2300 E Silverado Ranch Blvd, Las Vegas, NV 89183
$-714
Cash flow
-13.6%
Cash-on-Cash Return
2.5%
Cap rate
0.6%
Rent to Value Ratio
Active
$470,000
4
bds
|
2
ba
|
1,504
sqft
|
built
1952
1708 Poplar Ave, Las Vegas, NV 89101
$-692
Cash flow
-7.7%
Cash-on-Cash Return
3.9%
Cap rate
0.5%
Rent to Value Ratio
Active
$615,000
2
bds
|
2
ba
|
1,405
sqft
|
built
2006
322 Karen Ave, Las Vegas, NV 89109
$-1,480
Cash flow
-12.6%
Cash-on-Cash Return
2.8%
Cap rate
0.6%
Rent to Value Ratio
Active
$925,000
5
bds
|
5
ba
|
3,866
sqft
|
built
2022
7260 Grace Estate Ave, Las Vegas, NV 89113
$-2,528
Cash flow
-14.3%
Cash-on-Cash Return
2.4%
Cap rate
0.4%
Rent to Value Ratio
Active
$1,395,000
4
bds
|
3
ba
|
3,245
sqft
|
built
2014
12283 Lost Treasure Ave, Las Vegas, NV 89138
$-3,575
Cash flow
-13.4%
Cash-on-Cash Return
2.6%
Cap rate
0.4%
Rent to Value Ratio
Active
$875,000
3
bds
|
2
ba
|
3,381
sqft
|
built
2005
5651 Deer Creek Falls Ct, Las Vegas, NV 89118
$-2,187
Cash flow
-13.0%
Cash-on-Cash Return
2.7%
Cap rate
0.4%
Rent to Value Ratio

Active
$6,816,888
6
bds
|
8
ba
|
10,855
sqft
|
built
1994
5020 Spanish Heights Dr, Las Vegas, NV 89148
$-30,261
Cash flow
-23.2%
Cash-on-Cash Return
0.4%
Cap rate
0.1%
Rent to Value Ratio
Active
$1,225,000
4
bds
|
4
ba
|
3,146
sqft
|
built
2022
10196 Sequoia Glen Ave, Las Vegas, NV 89166
$-3,209
Cash flow
-13.7%
Cash-on-Cash Return
2.5%
Cap rate
0.4%
Rent to Value Ratio
Active
$1,590,000
4
bds
|
4
ba
|
4,088
sqft
|
built
2022
5725 El Royale Ct, Las Vegas, NV 89149
$-3,270
Cash flow
-10.7%
Cash-on-Cash Return
3.2%
Cap rate
0.5%
Rent to Value Ratio
Active
$1,149,000
4
bds
|
3
ba
|
2,807
sqft
|
built
2003
78 Siddall Ave, Las Vegas, NV 89183
$-3,373
Cash flow
-15.3%
Cash-on-Cash Return
2.2%
Cap rate
0.3%
Rent to Value Ratio
Active
$1,237,500
6
bds
|
5
ba
|
3,952
sqft
|
built
2020
3929 Reyes Ave, Las Vegas, NV 89141
$-3,925
Cash flow
-16.5%
Cash-on-Cash Return
1.9%
Cap rate
0.3%
Rent to Value Ratio
Active
$1,585,000
4
bds
|
4
ba
|
3,076
sqft
|
built
2023
436 Crown Mesa Ave, Las Vegas, NV 89138
$-5,428
Cash flow
-17.9%
Cash-on-Cash Return
1.6%
Cap rate
0.3%
Rent to Value Ratio
Active
$1,894,999
5
bds
|
5
ba
|
5,288
sqft
|
built
2019
4576 Amazing View St, Las Vegas, NV 89129
$-6,391
Cash flow
-17.6%
Cash-on-Cash Return
1.6%
Cap rate
0.3%
Rent to Value Ratio
Active
$1,999,000
4
bds
|
5
ba
|
4,094
sqft
|
built
2016
12024 Girasole Ave, Las Vegas, NV 89138
$-4,180
Cash flow
-10.9%
Cash-on-Cash Return
3.2%
Cap rate
0.5%
Rent to Value Ratio
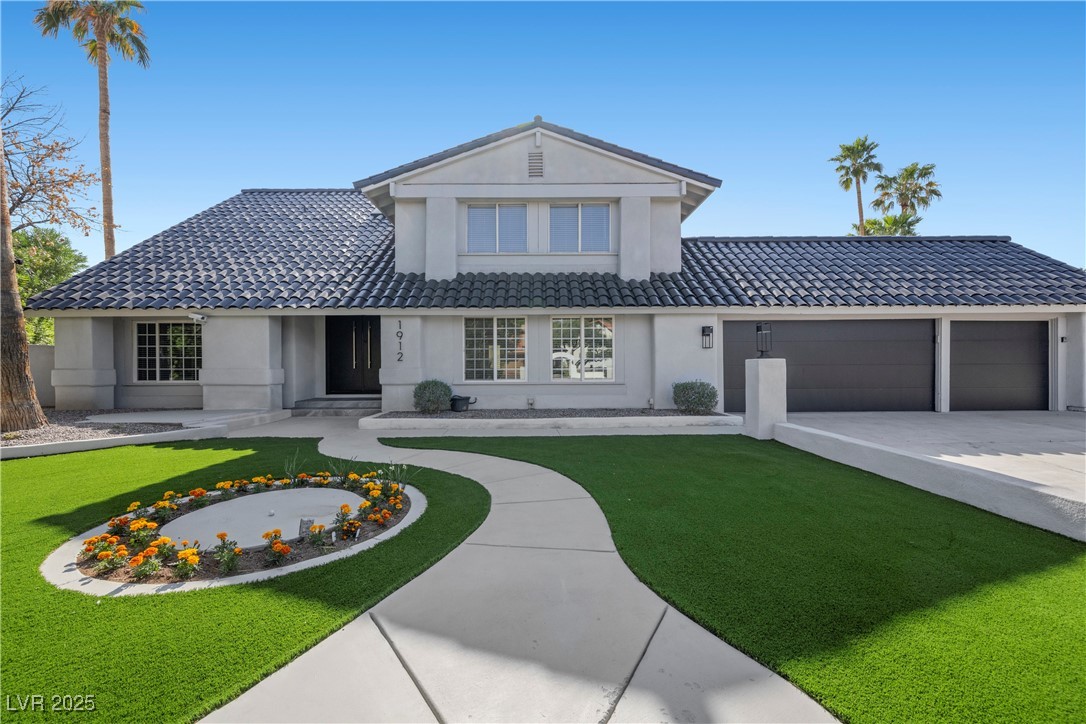
Active
$1,500,000
6
bds
|
5
ba
|
4,395
sqft
|
built
1981
1912 Calanda Ct, Las Vegas, NV 89102
$-2,538
Cash flow
-8.8%
Cash-on-Cash Return
3.6%
Cap rate
0.5%
Rent to Value Ratio
Active
$445,000
3
bds
|
3
ba
|
1,739
sqft
|
built
1996
3919 Lilac Haze St, Las Vegas, NV 89147
$-908
Cash flow
-10.6%
Cash-on-Cash Return
3.2%
Cap rate
0.4%
Rent to Value Ratio
Active
$775,000
5
bds
|
4
ba
|
3,279
sqft
|
built
2024
10851 Hanwicke Harbor Ave, Las Vegas, NV 89166
$-2,716
Cash flow
-18.3%
Cash-on-Cash Return
1.5%
Cap rate
0.3%
Rent to Value Ratio
Active
$2,250,000
4
bds
|
6
ba
|
6,070
sqft
|
built
1983
7001 Alamitos Cir, Las Vegas, NV 89120
$-5,019
Cash flow
-11.6%
Cash-on-Cash Return
3.0%
Cap rate
0.4%
Rent to Value Ratio
Active
$2,560,000
4
bds
|
5
ba
|
3,776
sqft
|
built
2016
15 Gemstar Ln, Las Vegas, NV 89135
$-9,690
Cash flow
-19.7%
Cash-on-Cash Return
1.1%
Cap rate
0.2%
Rent to Value Ratio
Pending
$960,000
3
bds
|
3
ba
|
2,528
sqft
|
built
2014
7763 Brisk Ocean Ave, Las Vegas, NV 89178
$-3,046
Cash flow
-16.6%
Cash-on-Cash Return
1.9%
Cap rate
0.3%
Rent to Value Ratio
Active
$899,000
4
bds
|
3
ba
|
4,078
sqft
|
built
2011
7931 Campers Village Ave, Las Vegas, NV 89178
$-2,476
Cash flow
-14.4%
Cash-on-Cash Return
2.4%
Cap rate
0.4%
Rent to Value Ratio
Active
$899,900
6
bds
|
4
ba
|
3,057
sqft
|
built
1998
6116 Golden Saddle St, Las Vegas, NV 89130
$-2,436
Cash flow
-14.1%
Cash-on-Cash Return
2.4%
Cap rate
0.4%
Rent to Value Ratio

Active
$1,099,000
4
bds
|
4
ba
|
3,807
sqft
|
built
2015
3428 Iron Hagen Ct, Las Vegas, NV 89141
$-2,532
Cash flow
-12.0%
Cash-on-Cash Return
2.9%
Cap rate
0.4%
Rent to Value Ratio
Active
$1,188,000
6
bds
|
4
ba
|
3,720
sqft
|
built
1995
2508 Monarch Bay Dr, Las Vegas, NV 89128
$-3,294
Cash flow
-14.5%
Cash-on-Cash Return
2.4%
Cap rate
0.4%
Rent to Value Ratio
Active
$3,200,000
4
bds
|
6
ba
|
5,283
sqft
|
built
2000
9713 Highridge Dr, Las Vegas, NV 89134
$-13,123
Cash flow
-21.4%
Cash-on-Cash Return
0.8%
Cap rate
0.2%
Rent to Value Ratio
Active
$1,250,000
6
bds
|
6
ba
|
6,148
sqft
|
built
1970
1420 S 8th St, Las Vegas, NV 89104
$-1,268
Cash flow
-5.3%
Cash-on-Cash Return
4.5%
Cap rate
0.6%
Rent to Value Ratio