Las Vegas, NV Investment Properties for Sale
Browse homes for sale and investment properties in Las Vegas, NV. Refine your search by price, property type, or more.
Best cash flowing properties in Las Vegas, NV
Active
$239,999
2
bds
|
2
ba
|
1,052
sqft
|
built
1973
3907 Torsby Pl, Las Vegas, NV 89119
$-759
Cash flow
-16.5%
Cash-on-Cash Return
2.5%
Cap rate
0.5%
Rent to Value Ratio
Active
$299,000
3
bds
|
2
ba
|
1,390
sqft
|
built
1996
8009 Draco Cir, Las Vegas, NV 89128
$-778
Cash flow
-13.6%
Cash-on-Cash Return
3.2%
Cap rate
0.6%
Rent to Value Ratio
5,558 out of 5,689 properties for sale in Las Vegas, NV
Limited Results Shown
Create a free account, or log in to reveal all property listings and enjoy the complete experience.
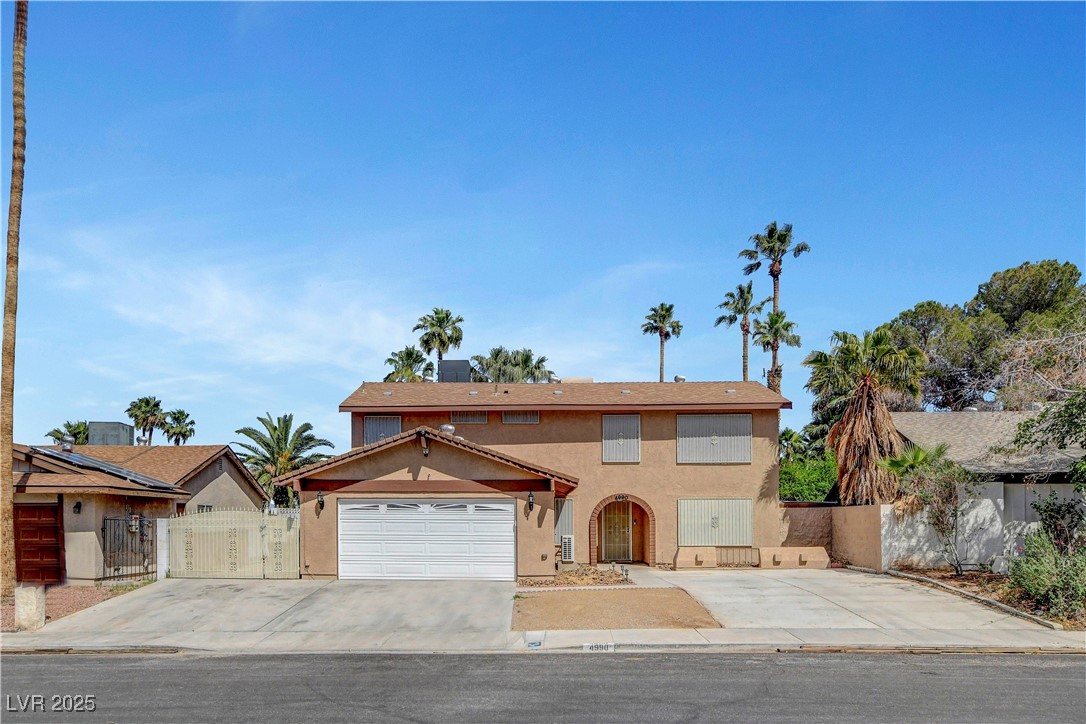
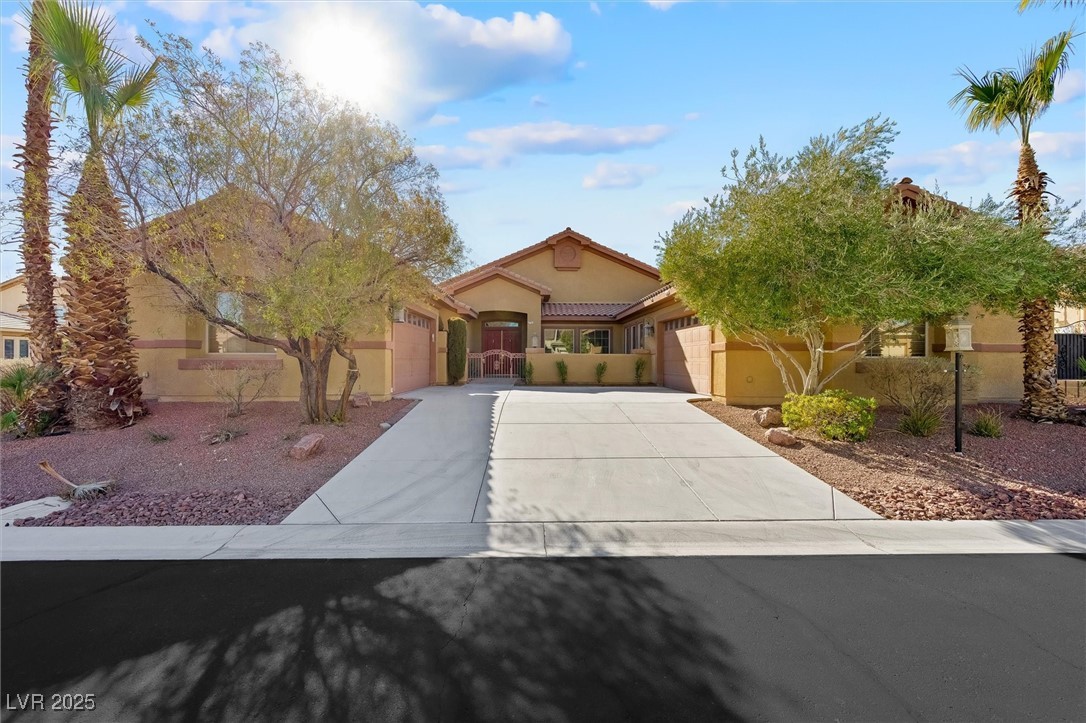
Active
$550,000
4
bds
|
3
ba
|
2,220
sqft
|
built
1976
4990 Spring Oak St, Las Vegas, NV 89120
$-1,295
Cash flow
-12.3%
Cash-on-Cash Return
3.5%
Cap rate
0.5%
Rent to Value Ratio
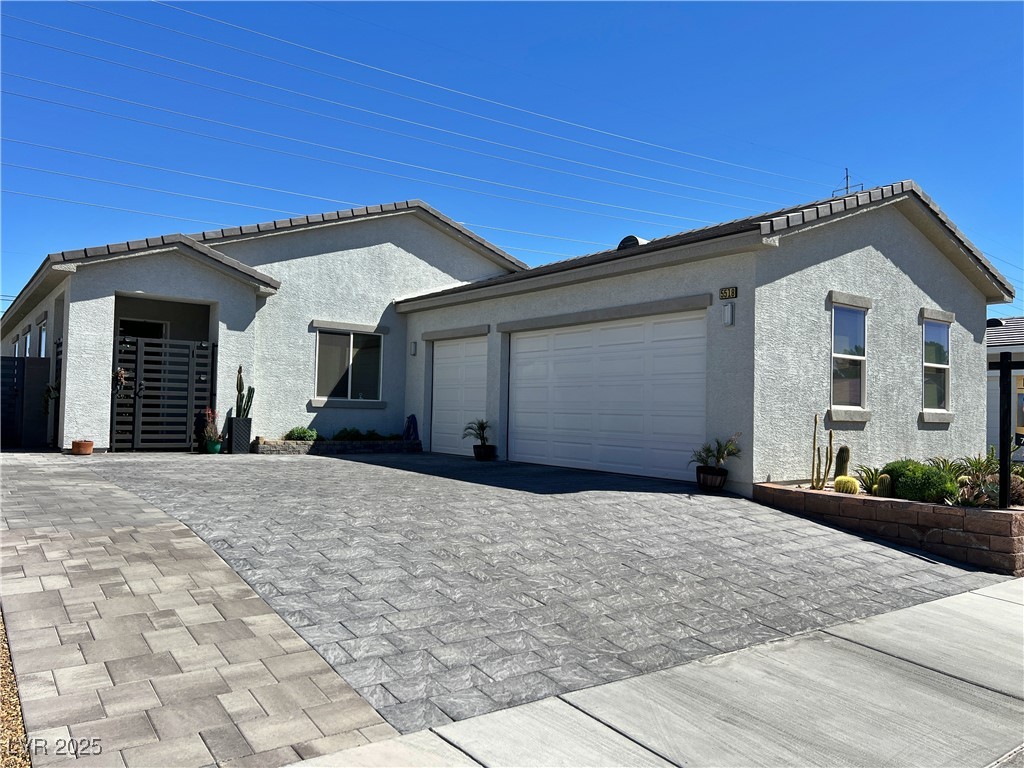
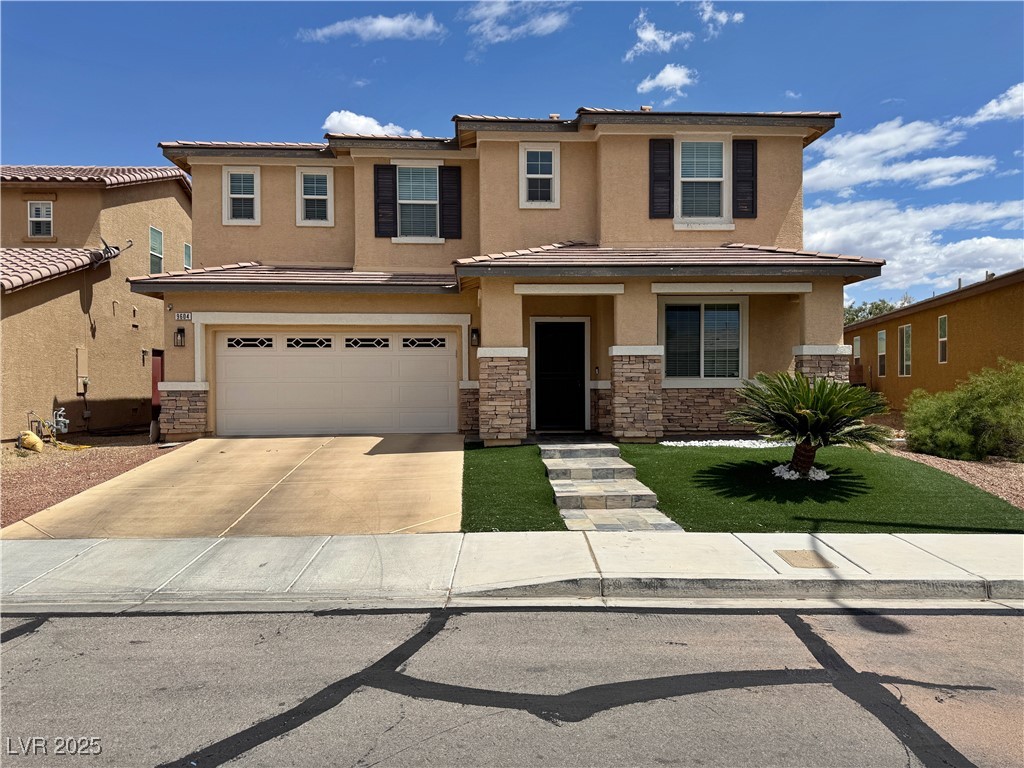
Active
$638,000
4
bds
|
4
ba
|
2,445
sqft
|
built
2020
5518 Stormy Night Ct, Las Vegas, NV 89120
$-1,024
Cash flow
-8.4%
Cash-on-Cash Return
4.4%
Cap rate
0.6%
Rent to Value Ratio
Active
$414,900
3
bds
|
2
ba
|
1,602
sqft
|
built
1998
6030 Halehaven Dr, Las Vegas, NV 89110
$-910
Cash flow
-11.4%
Cash-on-Cash Return
3.7%
Cap rate
0.5%
Rent to Value Ratio
Active
$699,900
5
bds
|
4
ba
|
3,223
sqft
|
built
2005
9628 Scrub Jay Ct, Las Vegas, NV 89148
$-1,907
Cash flow
-14.2%
Cash-on-Cash Return
3.0%
Cap rate
0.4%
Rent to Value Ratio
Active
$366,000
3
bds
|
3
ba
|
1,553
sqft
|
built
2005
9333 Leaping Deer Pl, Las Vegas, NV 89178
$-899
Cash flow
-12.8%
Cash-on-Cash Return
3.3%
Cap rate
0.5%
Rent to Value Ratio

Active
$550,000
5
bds
|
3
ba
|
2,460
sqft
|
built
2022
7006 Sylmar Ave, Las Vegas, NV 89113
$-1,750
Cash flow
-16.6%
Cash-on-Cash Return
2.5%
Cap rate
0.4%
Rent to Value Ratio
Active
$675,000
4
bds
|
3
ba
|
2,616
sqft
|
built
2001
11143 Castellane Dr, Las Vegas, NV 89141
$-1,942
Cash flow
-15.0%
Cash-on-Cash Return
2.8%
Cap rate
0.4%
Rent to Value Ratio

Active
$600,000
4
bds
|
4
ba
|
2,745
sqft
|
built
2023
10375 Rose Palisade St, Las Vegas, NV 89141
$-1,212
Cash flow
-10.5%
Cash-on-Cash Return
3.9%
Cap rate
0.6%
Rent to Value Ratio
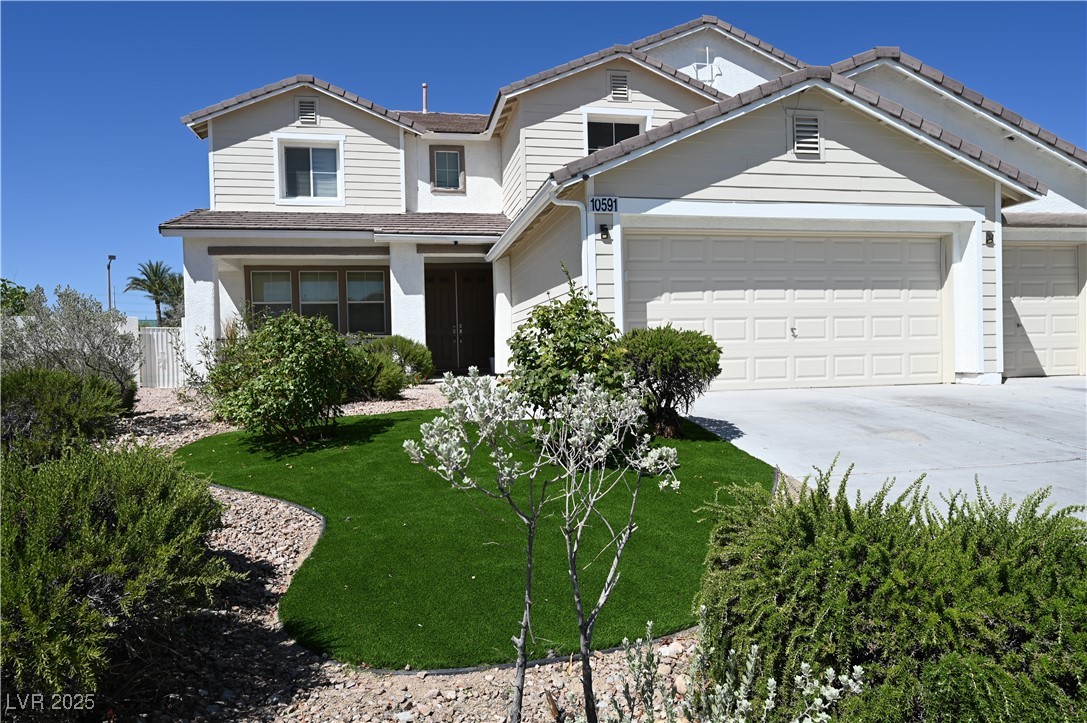
Active
$1,088,000
5
bds
|
3
ba
|
3,382
sqft
|
built
2001
10591 Haywood Dr, Las Vegas, NV 89135
$-2,376
Cash flow
-11.4%
Cash-on-Cash Return
3.7%
Cap rate
0.5%
Rent to Value Ratio
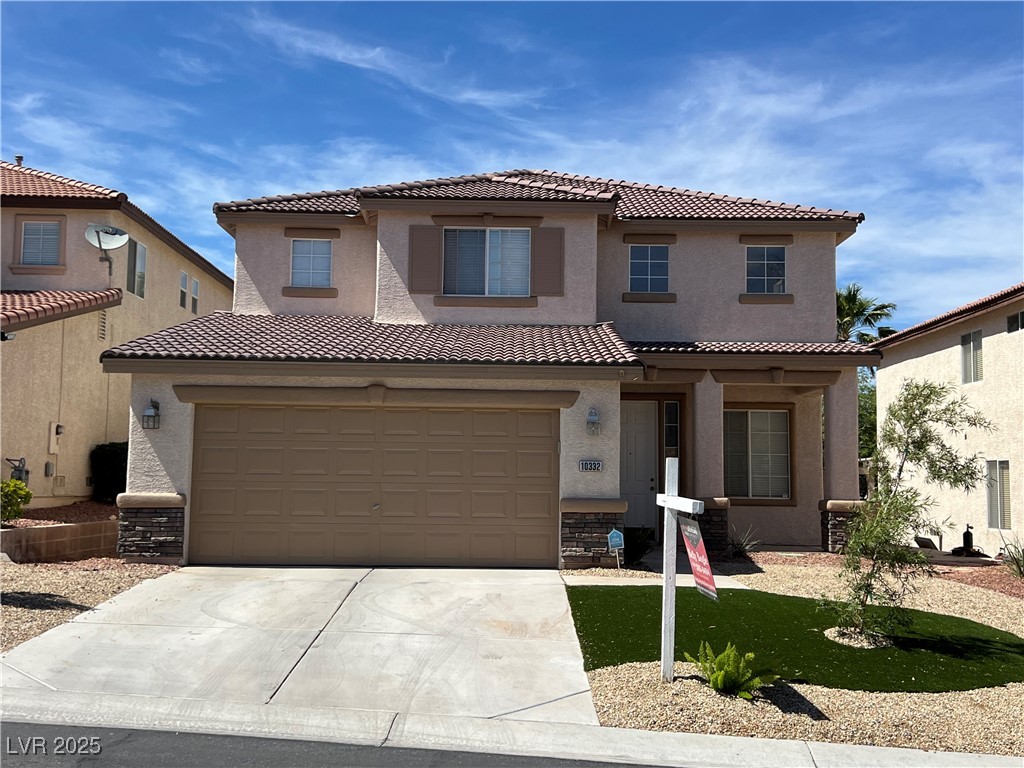
Active
$500,000
4
bds
|
3
ba
|
2,023
sqft
|
built
2001
10332 George Hart Ct, Las Vegas, NV 89129
$-1,433
Cash flow
-15.0%
Cash-on-Cash Return
2.8%
Cap rate
0.4%
Rent to Value Ratio
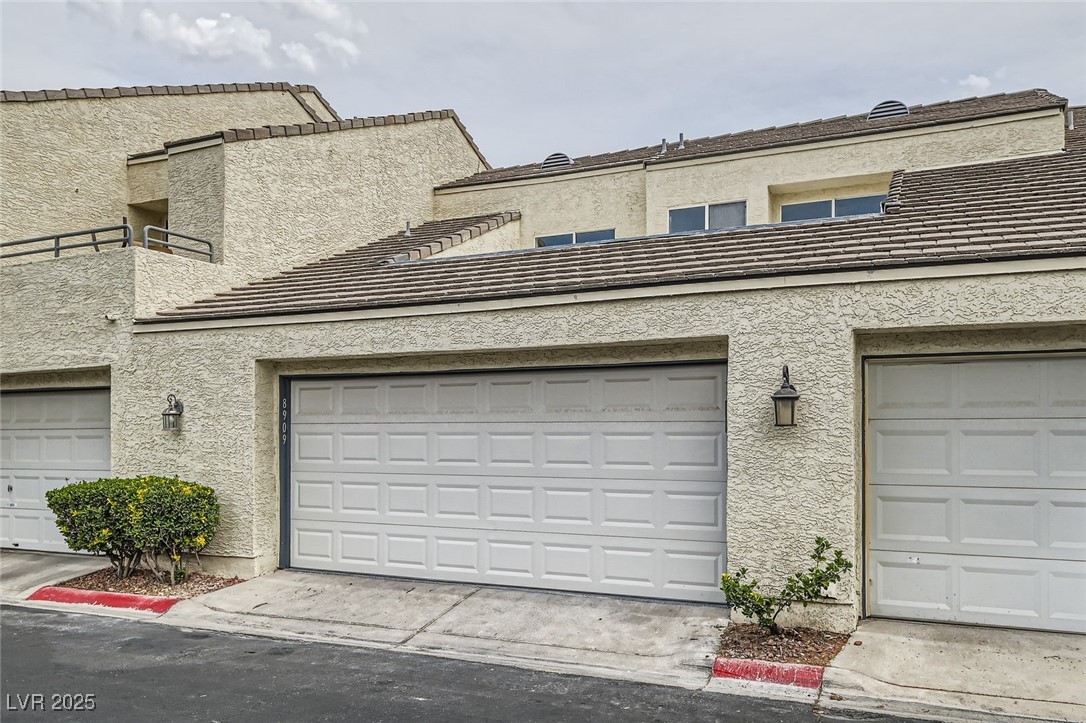
Active
$384,000
3
bds
|
3
ba
|
1,417
sqft
|
built
1988
8909 Antioch Way, Las Vegas, NV 89117
$-1,079
Cash flow
-14.7%
Cash-on-Cash Return
2.9%
Cap rate
0.5%
Rent to Value Ratio
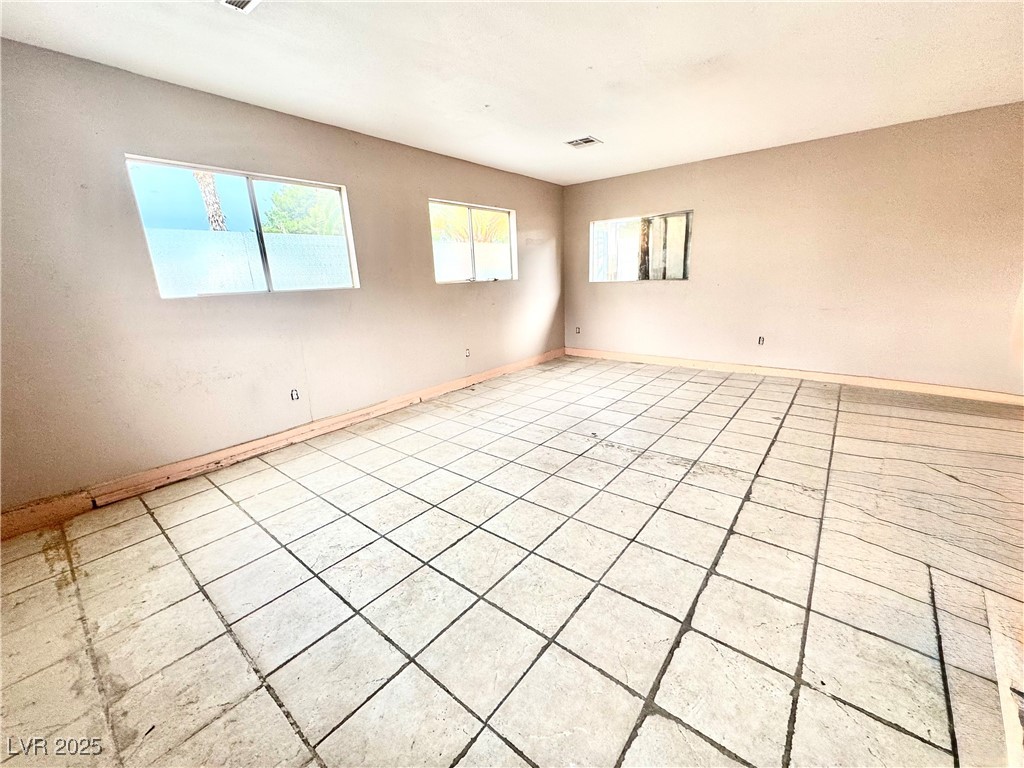
Active
$239,999
2
bds
|
2
ba
|
1,052
sqft
|
built
1973
3907 Torsby Pl, Las Vegas, NV 89119
$-759
Cash flow
-16.5%
Cash-on-Cash Return
2.5%
Cap rate
0.5%
Rent to Value Ratio
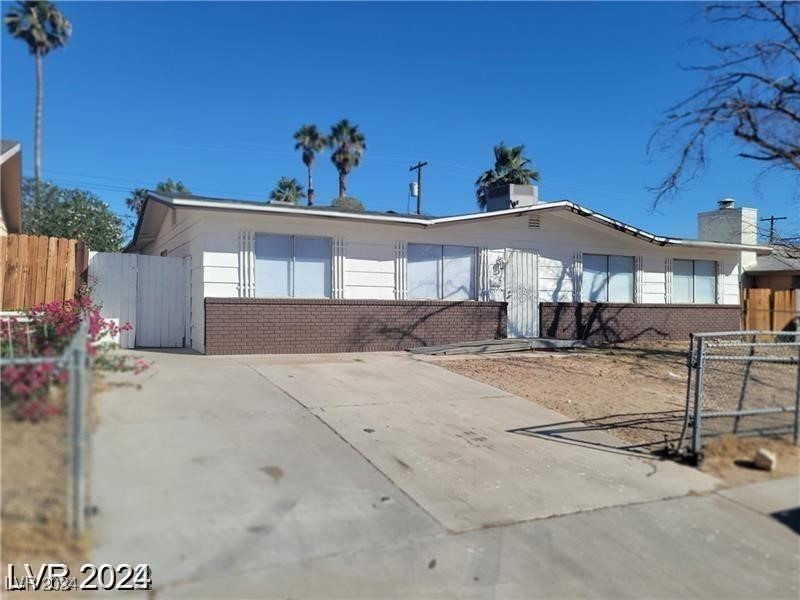
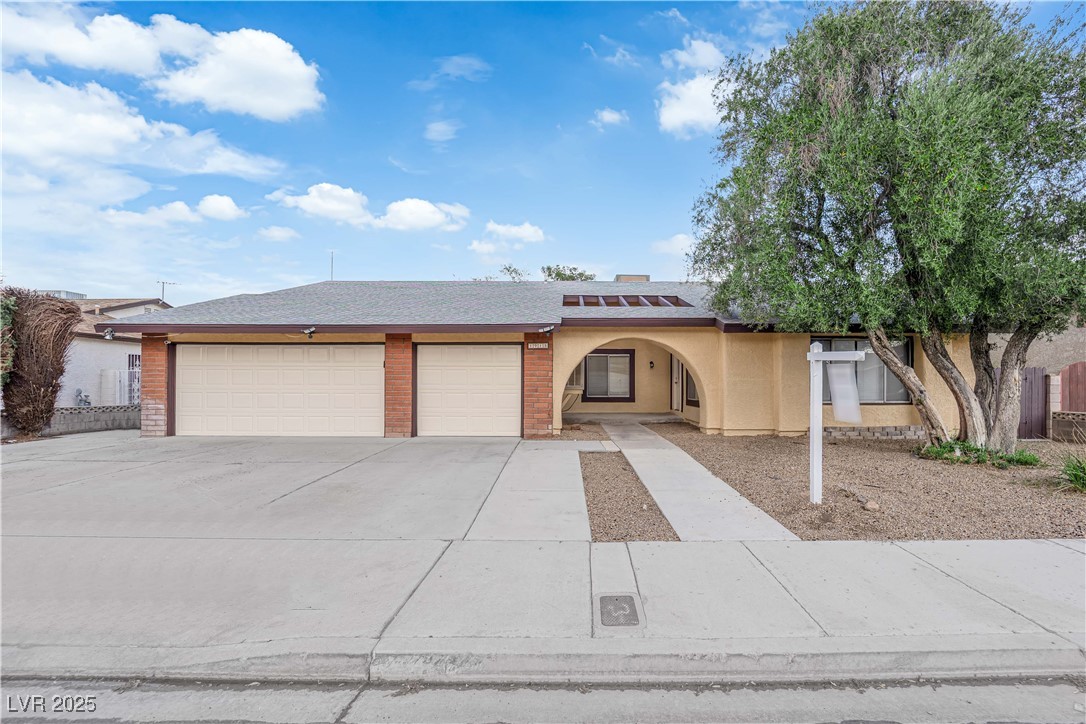
Active
$370,000
4
bds
|
2
ba
|
1,812
sqft
|
built
1983
3620 Park Oliver Dr, Las Vegas, NV 89110
$-816
Cash flow
-11.5%
Cash-on-Cash Return
3.6%
Cap rate
0.5%
Rent to Value Ratio
Active
$299,000
3
bds
|
2
ba
|
1,390
sqft
|
built
1996
8009 Draco Cir, Las Vegas, NV 89128
$-778
Cash flow
-13.6%
Cash-on-Cash Return
3.2%
Cap rate
0.6%
Rent to Value Ratio
Active
$399,999
3
bds
|
2
ba
|
1,460
sqft
|
built
1977
6231 Santa Maria Ave, Las Vegas, NV 89108
$-919
Cash flow
-12.0%
Cash-on-Cash Return
3.5%
Cap rate
0.5%
Rent to Value Ratio
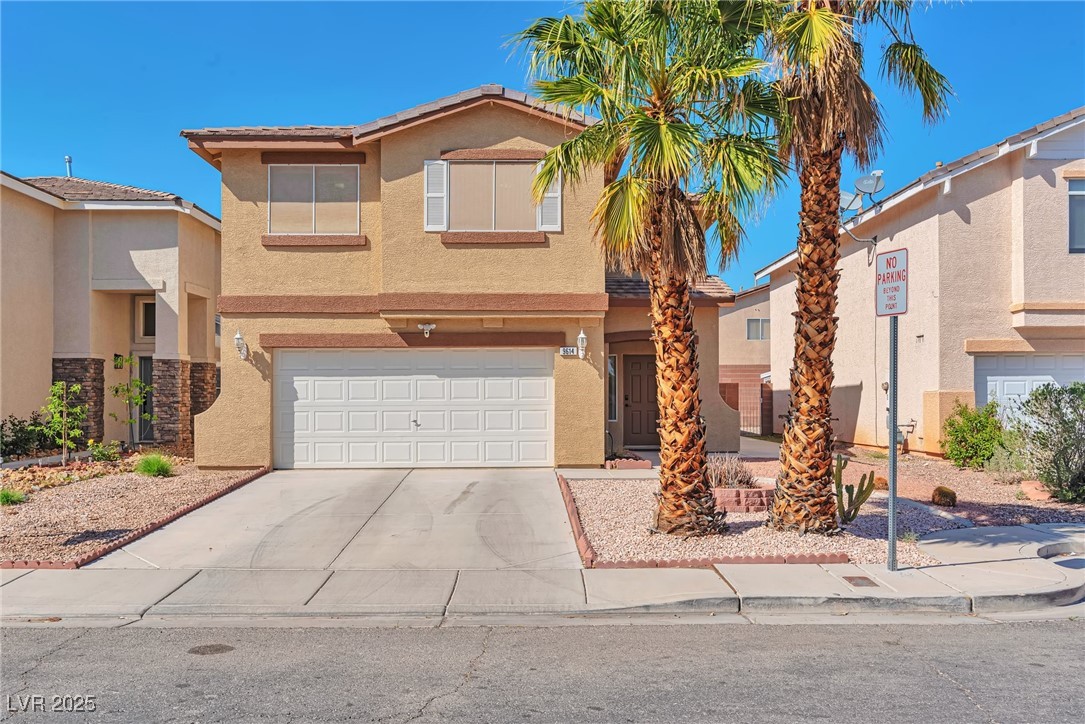
Active
$374,900
2
bds
|
2
ba
|
1,225
sqft
|
built
1997
3401 Conan St, Las Vegas, NV 89129
$-1,224
Cash flow
-17.0%
Cash-on-Cash Return
2.4%
Cap rate
0.4%
Rent to Value Ratio
Active
$669,900
5
bds
|
3
ba
|
2,933
sqft
|
built
2023
629 Soaring Wings Ave, Las Vegas, NV 89183
$-1,590
Cash flow
-12.4%
Cash-on-Cash Return
3.4%
Cap rate
0.5%
Rent to Value Ratio
Active
$499,000
4
bds
|
3
ba
|
1,862
sqft
|
built
2021
5269 Acadia Leaf St, Las Vegas, NV 89166
$-1,356
Cash flow
-14.2%
Cash-on-Cash Return
3.0%
Cap rate
0.5%
Rent to Value Ratio
Active
$449,400
3
bds
|
3
ba
|
1,769
sqft
|
built
2019
6619 Frosted Harvest Ave, Las Vegas, NV 89108
$-1,109
Cash flow
-12.9%
Cash-on-Cash Return
3.3%
Cap rate
0.5%
Rent to Value Ratio
Active
$680,000
4
bds
|
2
ba
|
2,247
sqft
|
built
1969
3753 S Rosecrest Cir, Las Vegas, NV 89121
$-1,966
Cash flow
-15.1%
Cash-on-Cash Return
2.8%
Cap rate
0.4%
Rent to Value Ratio
Active under contract
$675,000
5
bds
|
5
ba
|
3,971
sqft
|
built
2014
5490 Tulip Hill Ave, Las Vegas, NV 89141
$-1,502
Cash flow
-11.6%
Cash-on-Cash Return
3.6%
Cap rate
0.5%
Rent to Value Ratio
Active
$699,000
5
bds
|
3
ba
|
2,792
sqft
|
built
1998
2196 Pescara Ct, Las Vegas, NV 89123
$-1,467
Cash flow
-10.9%
Cash-on-Cash Return
3.8%
Cap rate
0.5%
Rent to Value Ratio
Active
$389,950
2
bds
|
2
ba
|
1,348
sqft
|
built
2006
7400 Quail Heights Ave, Las Vegas, NV 89131
$-972
Cash flow
-13.0%
Cash-on-Cash Return
3.3%
Cap rate
0.6%
Rent to Value Ratio
Active
$275,000
3
bds
|
2
ba
|
1,183
sqft
|
built
1991
2200 S Fort Apache Rd, Las Vegas, NV 89117
$-816
Cash flow
-15.5%
Cash-on-Cash Return
2.7%
Cap rate
0.6%
Rent to Value Ratio
Active
$724,777
4
bds
|
3
ba
|
3,136
sqft
|
built
2005
5820 Amber Station Ave, Las Vegas, NV 89131
$-1,812
Cash flow
-13.0%
Cash-on-Cash Return
3.3%
Cap rate
0.5%
Rent to Value Ratio
Active
$685,000
3
bds
|
3
ba
|
1,782
sqft
|
built
2021
12426 Oregon Cherry Ave, Las Vegas, NV 89138
$-2,127
Cash flow
-16.2%
Cash-on-Cash Return
2.6%
Cap rate
0.4%
Rent to Value Ratio
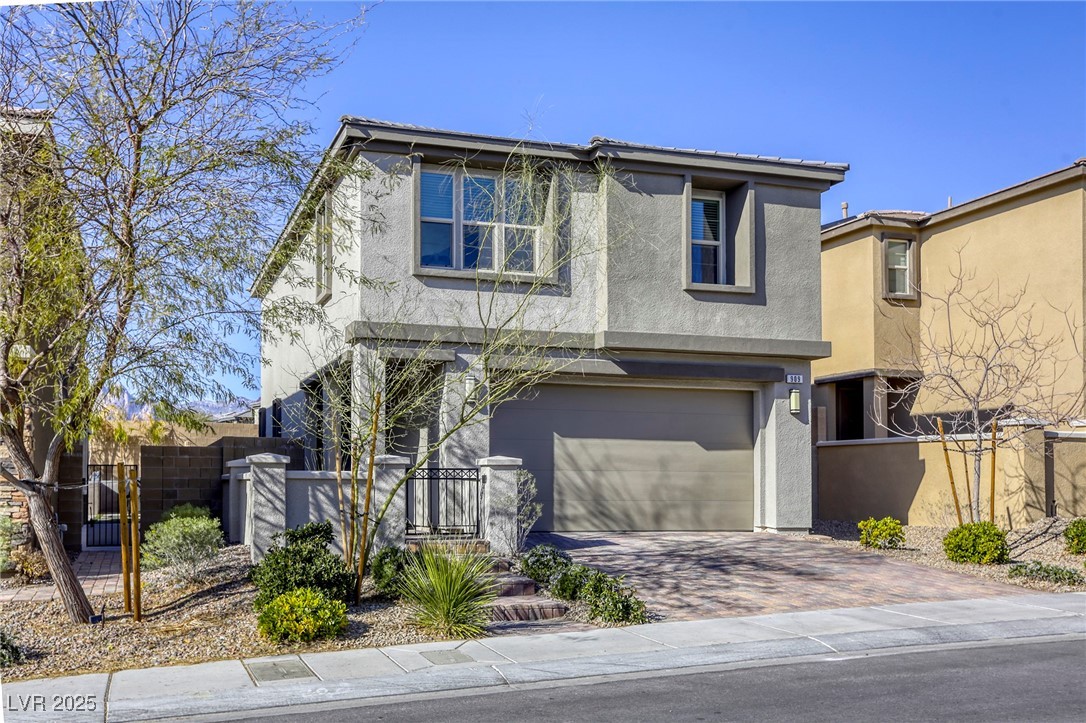
Active
$599,900
3
bds
|
3
ba
|
1,592
sqft
|
built
2019
909 Cirrus Cloud Ave, Las Vegas, NV 89138
$-1,994
Cash flow
-17.3%
Cash-on-Cash Return
2.3%
Cap rate
0.4%
Rent to Value Ratio
Active
$479,900
4
bds
|
2
ba
|
1,722
sqft
|
built
1968
6232 Blair Way, Las Vegas, NV 89107
$-1,452
Cash flow
-15.8%
Cash-on-Cash Return
2.7%
Cap rate
0.4%
Rent to Value Ratio

Active
$505,000
2
bds
|
2
ba
|
1,682
sqft
|
built
1990
7929 Ben Hogan Dr, Las Vegas, NV 89149
$-1,300
Cash flow
-13.4%
Cash-on-Cash Return
3.2%
Cap rate
0.5%
Rent to Value Ratio
Active
$359,000
2
bds
|
2
ba
|
974
sqft
|
built
1992
210 E Flamingo Rd, Las Vegas, NV 89169
$-834
Cash flow
-12.1%
Cash-on-Cash Return
3.5%
Cap rate
0.7%
Rent to Value Ratio
Active
$555,000
4
bds
|
3
ba
|
2,118
sqft
|
built
2023
5692 Tinar St, Las Vegas, NV 89113
$-1,722
Cash flow
-16.2%
Cash-on-Cash Return
2.6%
Cap rate
0.4%
Rent to Value Ratio
Active
$425,000
3
bds
|
3
ba
|
1,643
sqft
|
built
1984
6633 Wheelbarrow Peak Dr, Las Vegas, NV 89108
$-1,050
Cash flow
-12.9%
Cash-on-Cash Return
3.3%
Cap rate
0.4%
Rent to Value Ratio
Active
$969,000
4
bds
|
4
ba
|
3,708
sqft
|
built
2008
549 Via Balizan Ave, Las Vegas, NV 89123
$-2,104
Cash flow
-11.3%
Cash-on-Cash Return
3.7%
Cap rate
0.5%
Rent to Value Ratio
Active
$635,000
4
bds
|
3
ba
|
2,539
sqft
|
built
2014
6567 American Eagle Ave, Las Vegas, NV 89131
$-1,775
Cash flow
-14.6%
Cash-on-Cash Return
2.9%
Cap rate
0.4%
Rent to Value Ratio
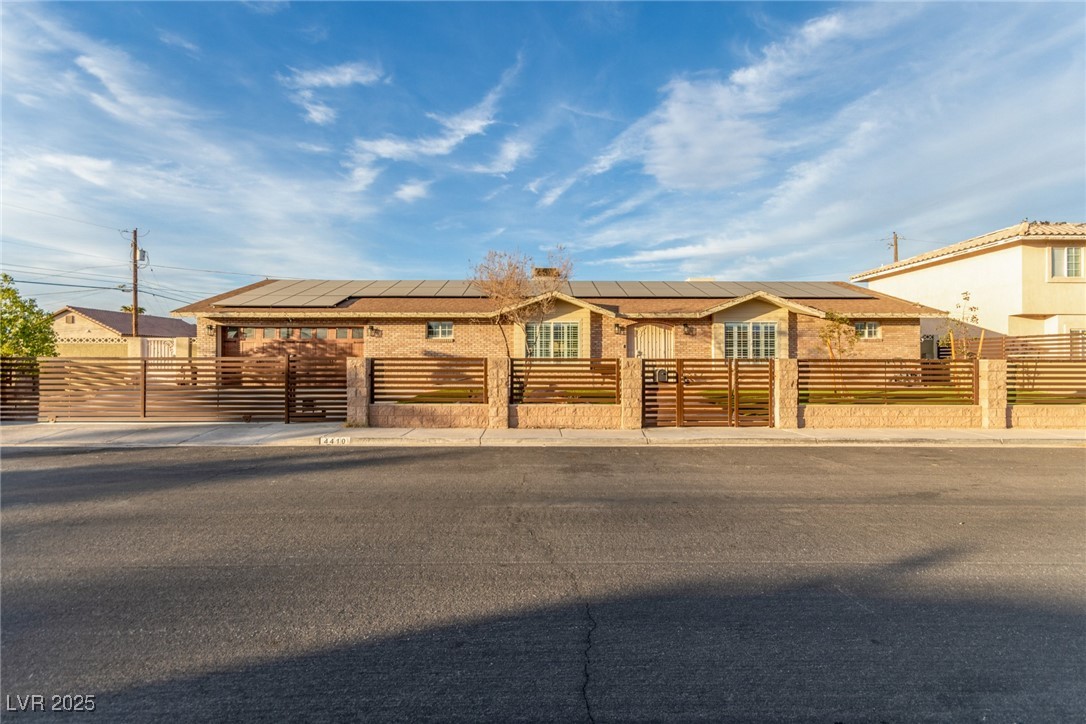
Active
$623,000
5
bds
|
3
ba
|
3,828
sqft
|
built
1990
4410 E Boston Ave, Las Vegas, NV 89104
$-836
Cash flow
-7.0%
Cash-on-Cash Return
4.7%
Cap rate
0.6%
Rent to Value Ratio
Active
$1,099,900
4
bds
|
4
ba
|
4,109
sqft
|
built
2007
3757 Brittany Nicole Ct, Las Vegas, NV 89139
$-2,831
Cash flow
-13.4%
Cash-on-Cash Return
3.2%
Cap rate
0.5%
Rent to Value Ratio
Active
$605,000
5
bds
|
3
ba
|
2,656
sqft
|
built
2013
9604 Vital Crest St, Las Vegas, NV 89123
$-1,582
Cash flow
-13.6%
Cash-on-Cash Return
3.1%
Cap rate
0.4%
Rent to Value Ratio
Active
$459,900
4
bds
|
2
ba
|
1,989
sqft
|
built
1979
1913 Piccolo Way, Las Vegas, NV 89146
$-1,057
Cash flow
-12.0%
Cash-on-Cash Return
3.5%
Cap rate
0.5%
Rent to Value Ratio

Active
$685,000
3
bds
|
4
ba
|
1,857
sqft
|
built
2022
11551 Earth Stone Ave, Las Vegas, NV 89138
$-1,227
Cash flow
-9.3%
Cash-on-Cash Return
4.1%
Cap rate
0.6%
Rent to Value Ratio
Active
$475,000
3
bds
|
3
ba
|
1,951
sqft
|
built
2000
9614 Orchard Oasis Ct, Las Vegas, NV 89147
$-1,191
Cash flow
-13.1%
Cash-on-Cash Return
3.3%
Cap rate
0.4%
Rent to Value Ratio