Las Vegas, NV Investment Properties for Sale
Browse homes for sale and investment properties in Las Vegas, NV. Refine your search by price, property type, or more.
Best cash flowing properties in Las Vegas, NV
Pending
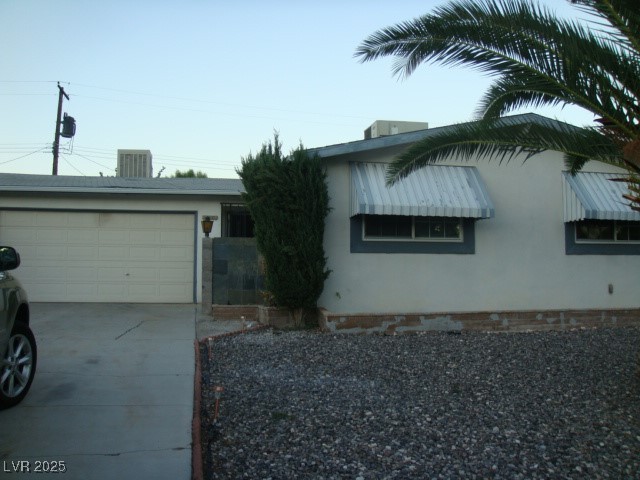
$190,000
2
bds
|
2
ba
|
935
sqft
|
built
2004
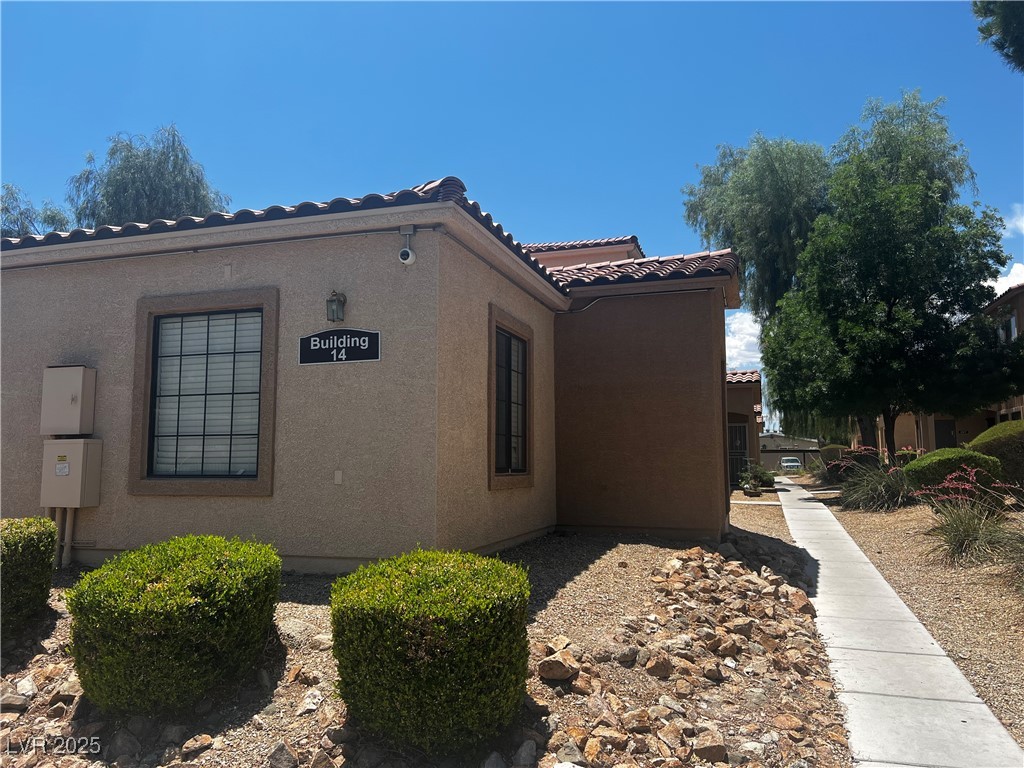
2041 Hussium Hills St, Las Vegas, NV 89108
$-405
Cash flow
-11.1%
Cash-on-Cash Return
3.7%
Cap rate
0.7%
Rent to Value Ratio
Active
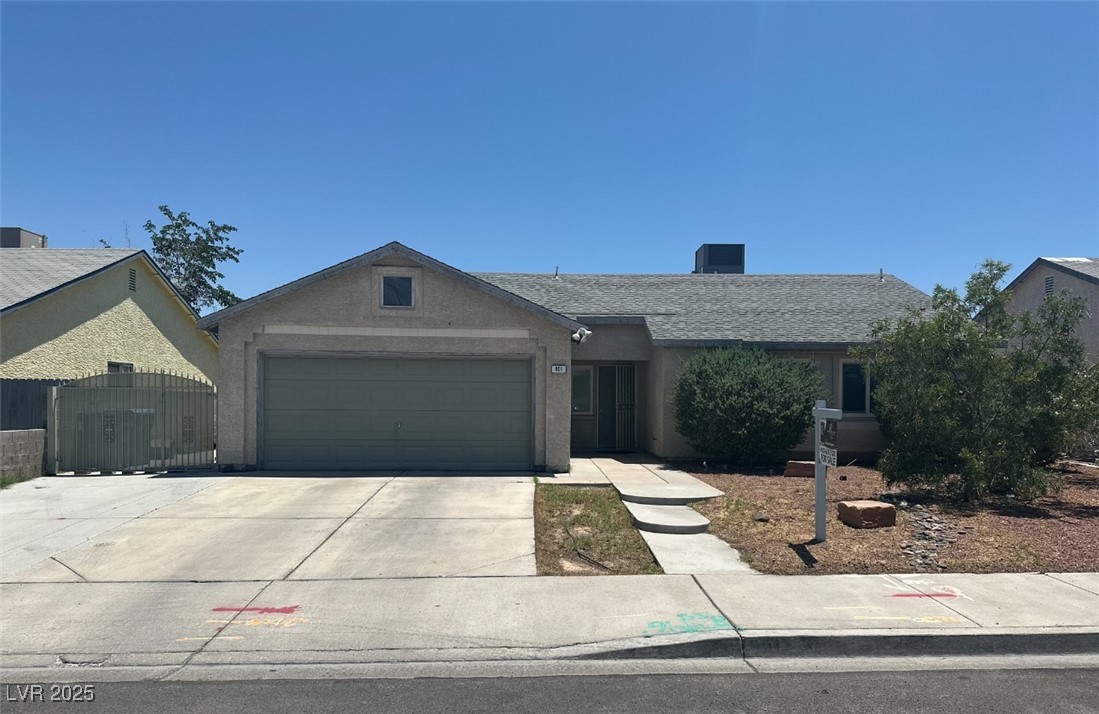
$170,000
2
bds
|
2
ba
|
928
sqft
|
built
1996
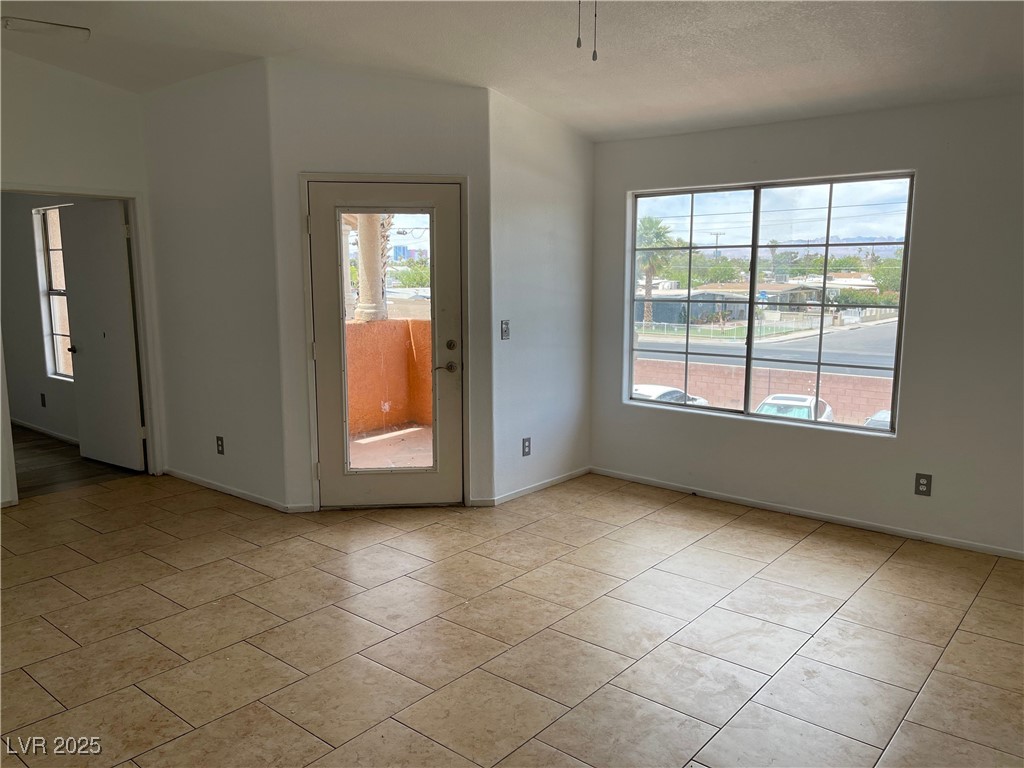
1830 N Pecos Rd, Las Vegas, NV 89115
$-438
Cash flow
-13.4%
Cash-on-Cash Return
3.2%
Cap rate
0.6%
Rent to Value Ratio
5,530 out of 5,662 properties for sale in Las Vegas, NV
Limited Results Shown
Create a free account, or log in to reveal all property listings and enjoy the complete experience.
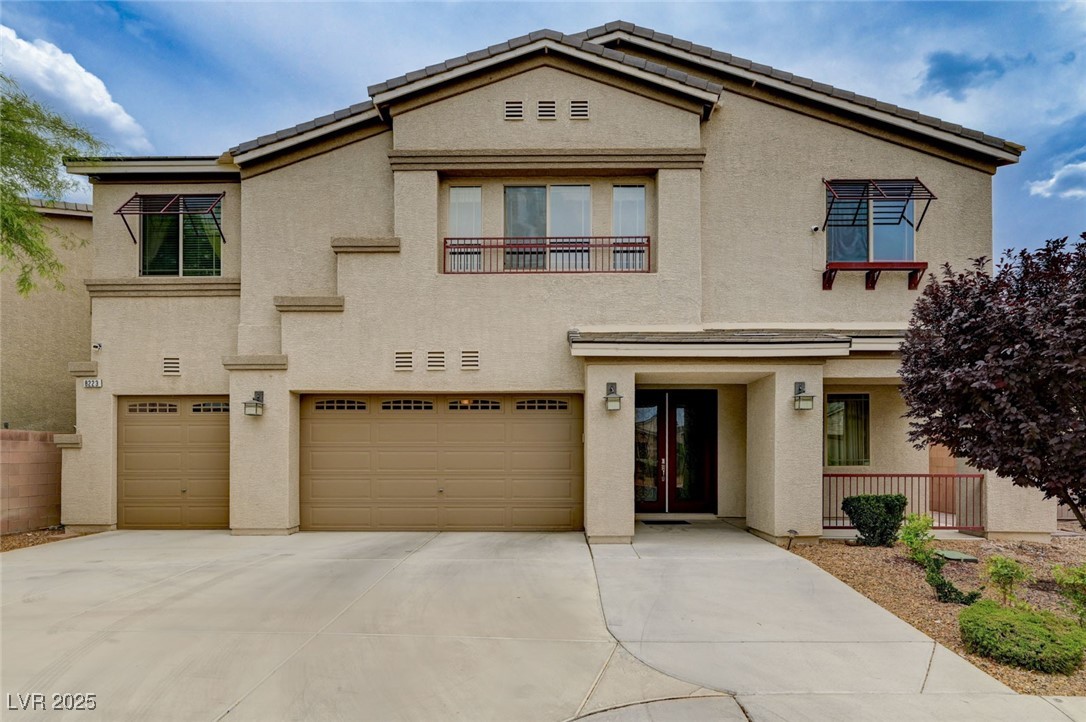
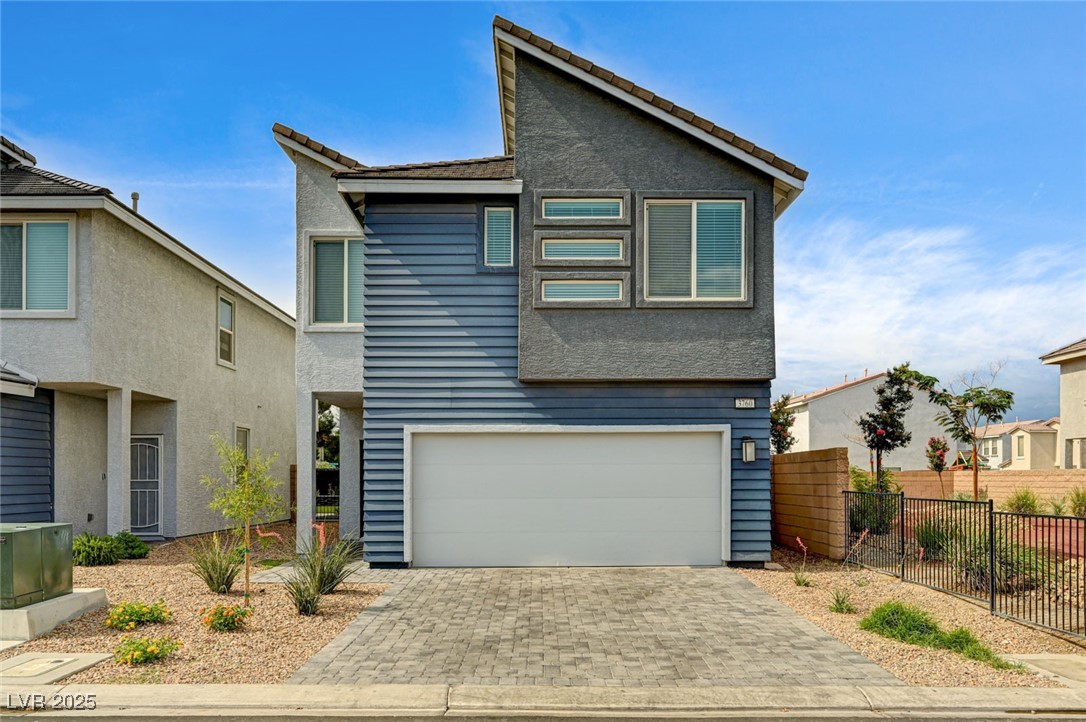
Active
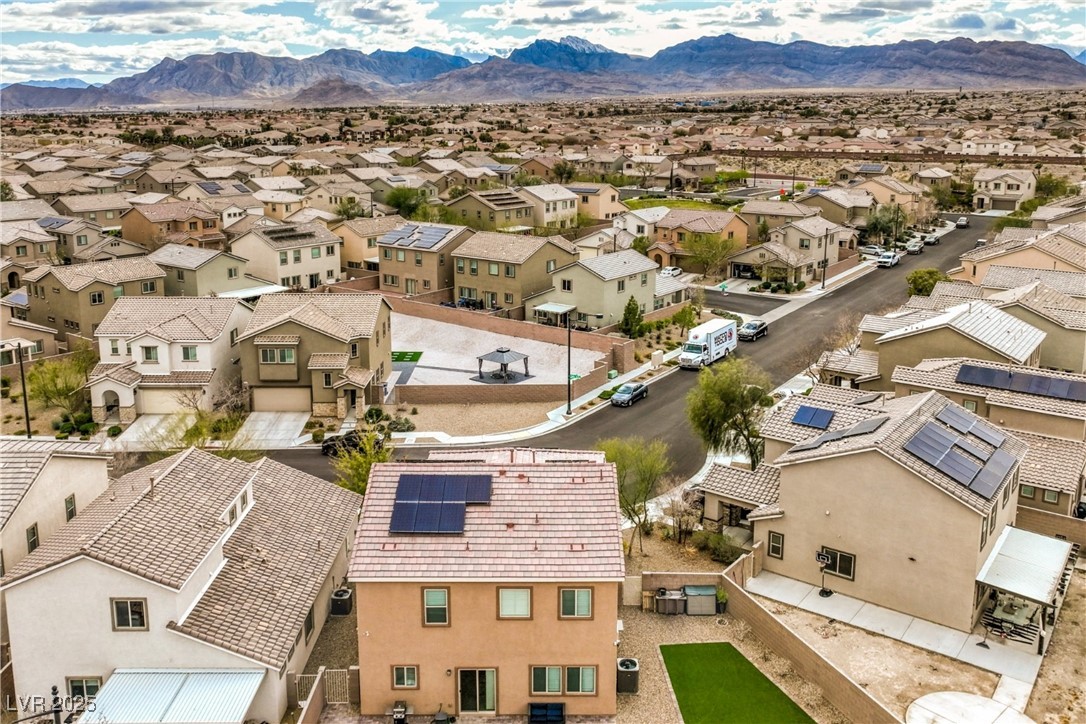
$500,000
4
bds
|
3
ba
|
2,261
sqft
|
built
2017
7948 Eastern Elk St, Las Vegas, NV 89149
$-1,344
Cash flow
-14.0%
Cash-on-Cash Return
3.1%
Cap rate
0.5%
Rent to Value Ratio
Active
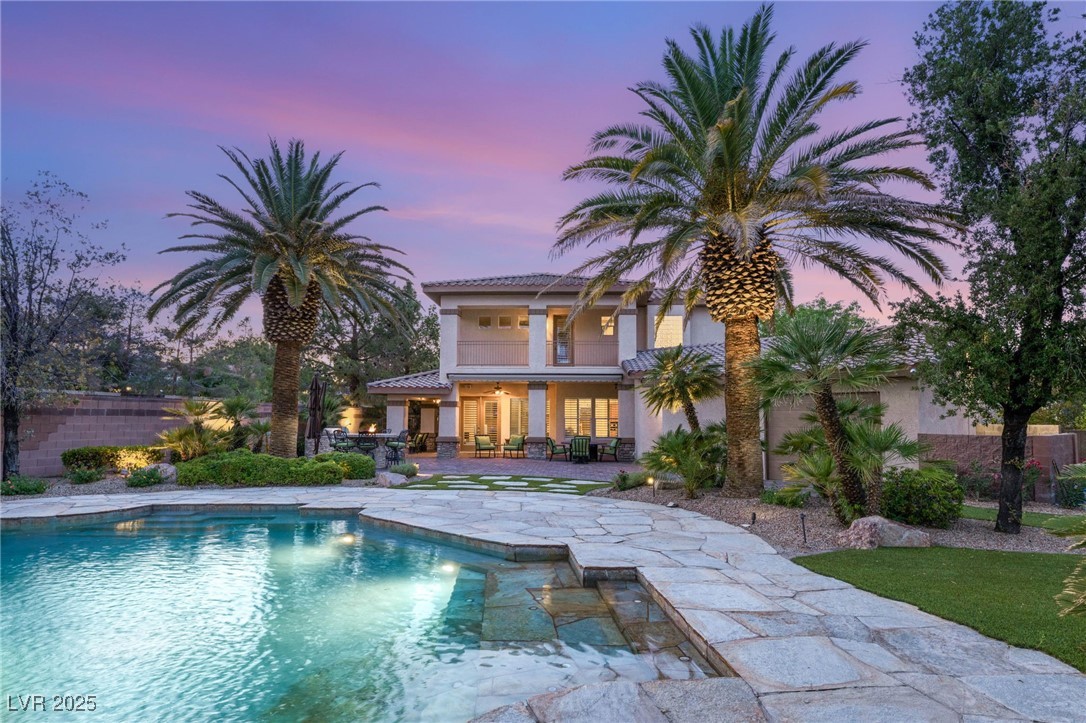
$2,100,000
4
bds
|
6
ba
|
5,249
sqft
|
built
2003
2285 Villefort Ct, Las Vegas, NV 89117
$-6,121
Cash flow
-15.2%
Cash-on-Cash Return
2.8%
Cap rate
0.4%
Rent to Value Ratio
Active
$689,999
5
bds
|
5
ba
|
3,971
sqft
|
built
2013
5448 Tulip Hill Ave, Las Vegas, NV 89141
$-1,680
Cash flow
-12.7%
Cash-on-Cash Return
3.4%
Cap rate
0.5%
Rent to Value Ratio
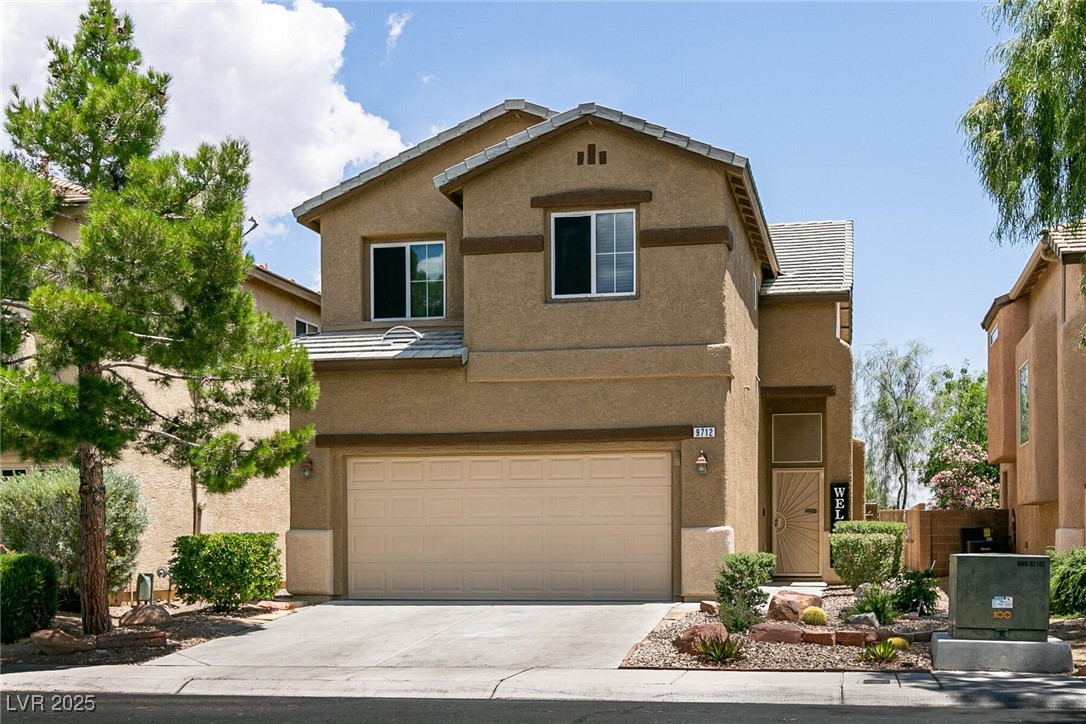
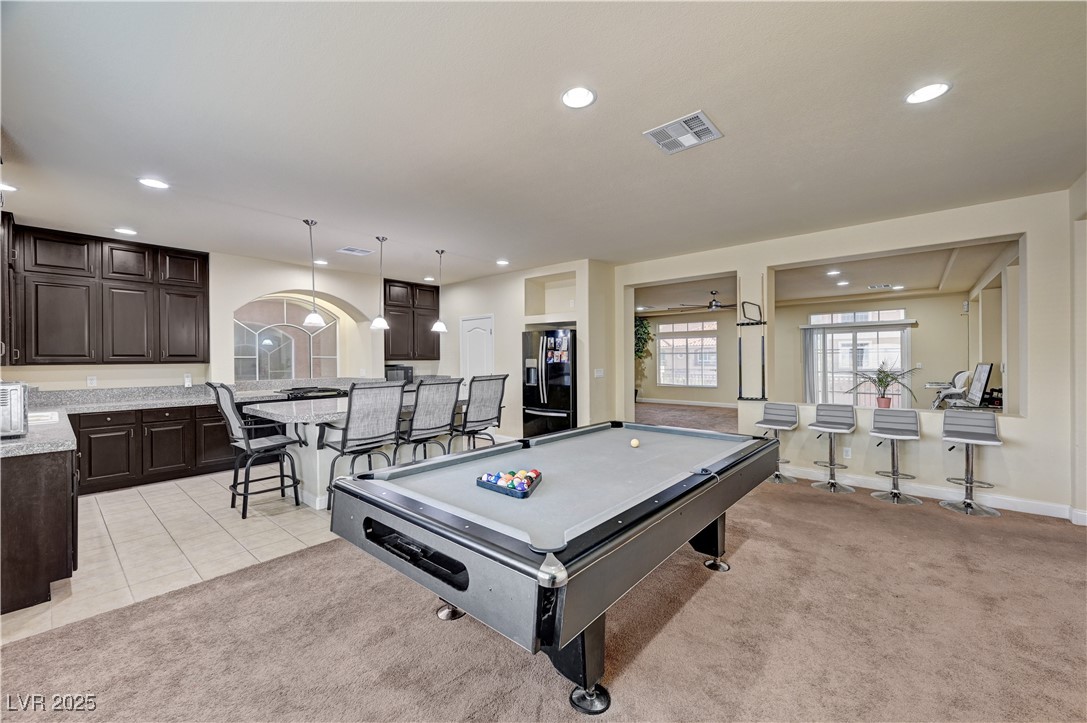
Pending
$469,900
5
bds
|
3
ba
|
1,954
sqft
|
built
2004
9712 Red Horse St, Las Vegas, NV 89143
$-971
Cash flow
-10.8%
Cash-on-Cash Return
3.8%
Cap rate
0.5%
Rent to Value Ratio
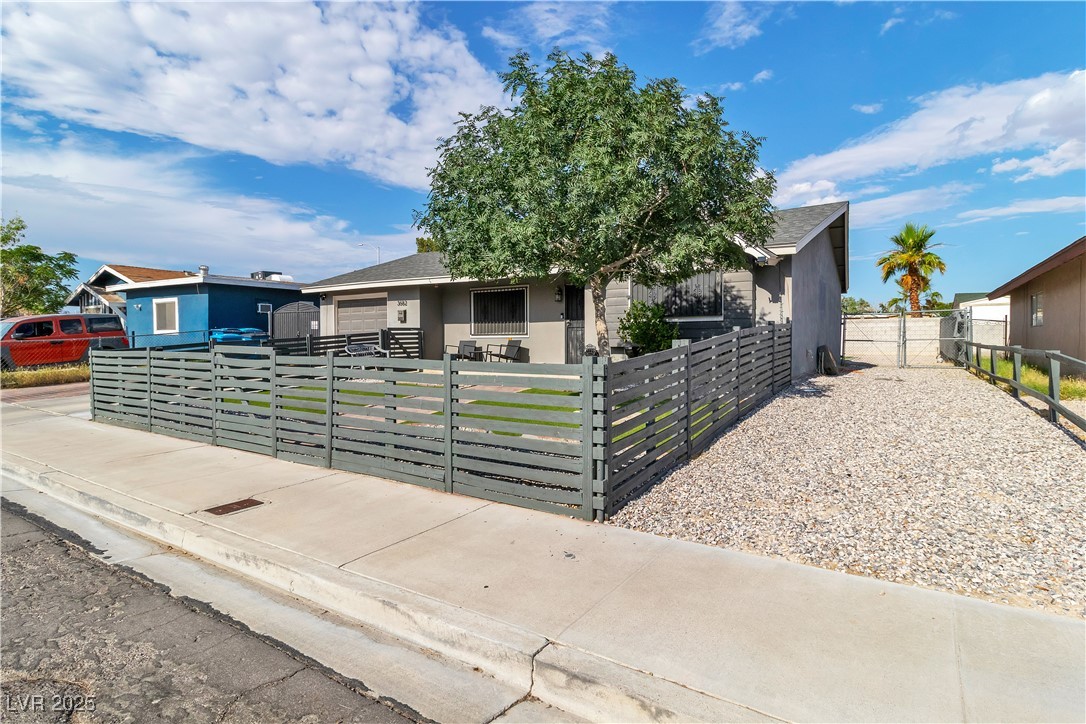
Active
$378,500
4
bds
|
2
ba
|
1,477
sqft
|
built
1955
2105 Berkley Ave, Las Vegas, NV 89101
$-923
Cash flow
-12.7%
Cash-on-Cash Return
3.4%
Cap rate
0.4%
Rent to Value Ratio
Active
$539,900
3
bds
|
3
ba
|
2,494
sqft
|
built
1998
7517 Apple Cider St, Las Vegas, NV 89131
$-1,637
Cash flow
-15.8%
Cash-on-Cash Return
2.6%
Cap rate
0.4%
Rent to Value Ratio
Active
$435,000
4
bds
|
2
ba
|
1,828
sqft
|
built
1963
4324 El Conlon Ave, Las Vegas, NV 89102
$-1,133
Cash flow
-13.6%
Cash-on-Cash Return
3.2%
Cap rate
0.4%
Rent to Value Ratio
Active
$485,000
3
bds
|
2
ba
|
1,680
sqft
|
built
1997
3640 Snowy Pines St, Las Vegas, NV 89147
$-1,247
Cash flow
-13.4%
Cash-on-Cash Return
3.2%
Cap rate
0.5%
Rent to Value Ratio
Active
$285,000
2
bds
|
2
ba
|
1,131
sqft
|
built
1996
9000 Las Vegas Blvd S, Las Vegas, NV 89123
$-514
Cash flow
-9.4%
Cash-on-Cash Return
4.1%
Cap rate
0.7%
Rent to Value Ratio
Active
$532,990
4
bds
|
3
ba
|
2,034
sqft
|
built
1985
3200 Mariner Bay St, Las Vegas, NV 89117
$-1,082
Cash flow
-10.6%
Cash-on-Cash Return
3.8%
Cap rate
0.5%
Rent to Value Ratio
Active
$420,000
4
bds
|
3
ba
|
1,937
sqft
|
built
2004
9053 Starling Wing Pl, Las Vegas, NV 89143
$-1,066
Cash flow
-13.2%
Cash-on-Cash Return
3.2%
Cap rate
0.5%
Rent to Value Ratio

Pending
$274,990
2
bds
|
2
ba
|
1,148
sqft
|
built
1997
8410 Eldora Ave, Las Vegas, NV 89117
$-604
Cash flow
-11.5%
Cash-on-Cash Return
3.6%
Cap rate
0.6%
Rent to Value Ratio
Active
$299,900
3
bds
|
4
ba
|
1,740
sqft
|
built
1976
2819 Calle Del Oro, Las Vegas, NV 89120
$-672
Cash flow
-11.7%
Cash-on-Cash Return
3.6%
Cap rate
0.6%
Rent to Value Ratio
Active
$735,000
4
bds
|
3
ba
|
2,829
sqft
|
built
2000
10680 Sapphire Vista Ave, Las Vegas, NV 89144
$-2,017
Cash flow
-14.3%
Cash-on-Cash Return
3.0%
Cap rate
0.4%
Rent to Value Ratio
Active
$470,000
3
bds
|
2
ba
|
1,912
sqft
|
built
1959
1304 Bonita Ave, Las Vegas, NV 89104
$-1,018
Cash flow
-11.3%
Cash-on-Cash Return
3.7%
Cap rate
0.5%
Rent to Value Ratio
Active
$559,888
3
bds
|
3
ba
|
2,462
sqft
|
built
2007
9792 Crescent Lodge Ct, Las Vegas, NV 89178
$-1,524
Cash flow
-14.2%
Cash-on-Cash Return
3.0%
Cap rate
0.5%
Rent to Value Ratio
Active
$1,495,000
5
bds
|
5
ba
|
4,378
sqft
|
built
2013
7504 Frittata Ave, Las Vegas, NV 89113
$-3,622
Cash flow
-12.6%
Cash-on-Cash Return
3.4%
Cap rate
0.5%
Rent to Value Ratio
Pending
$190,000
2
bds
|
2
ba
|
935
sqft
|
built
2004
2041 Hussium Hills St, Las Vegas, NV 89108
$-405
Cash flow
-11.1%
Cash-on-Cash Return
3.7%
Cap rate
0.7%
Rent to Value Ratio
Active
$170,000
2
bds
|
2
ba
|
928
sqft
|
built
1996
1830 N Pecos Rd, Las Vegas, NV 89115
$-438
Cash flow
-13.4%
Cash-on-Cash Return
3.2%
Cap rate
0.6%
Rent to Value Ratio
Active
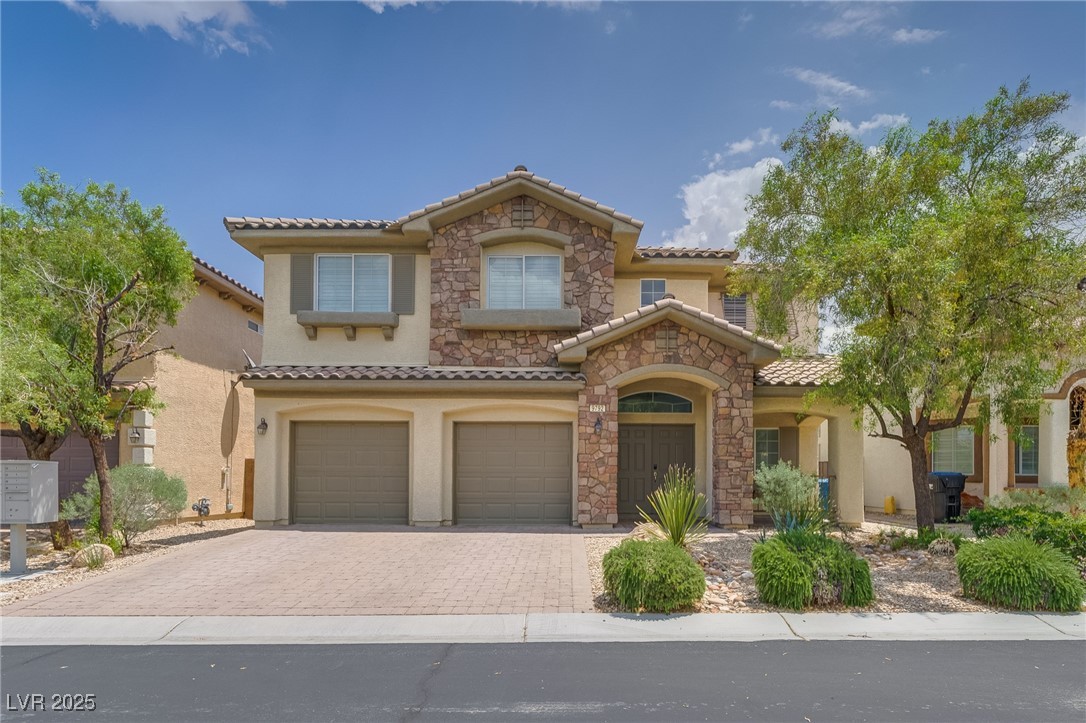
$485,000
3
bds
|
3
ba
|
1,794
sqft
|
built
2000
3717 Shanagolden St, Las Vegas, NV 89129
$-1,079
Cash flow
-11.6%
Cash-on-Cash Return
3.6%
Cap rate
0.5%
Rent to Value Ratio
Active
$349,000
3
bds
|
2
ba
|
1,377
sqft
|
built
2003
9975 Peace Way, Las Vegas, NV 89147
$-936
Cash flow
-14.0%
Cash-on-Cash Return
3.1%
Cap rate
0.5%
Rent to Value Ratio
Active
$775,000
4
bds
|
3
ba
|
2,002
sqft
|
built
2021
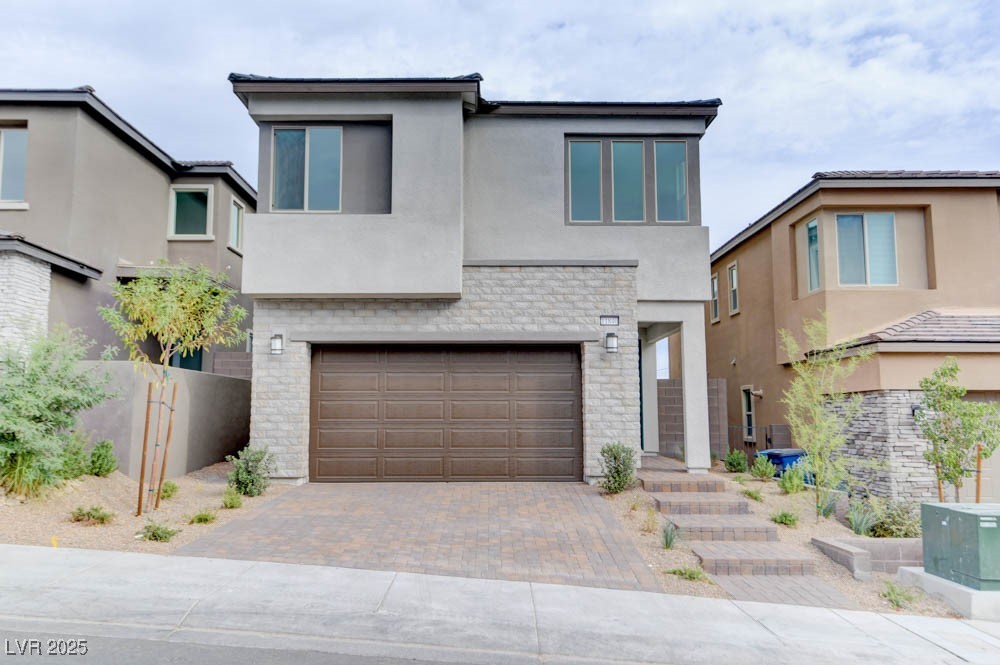
11840 Pelican Butte Ave, Las Vegas, NV 89138
$-2,842
Cash flow
-19.1%
Cash-on-Cash Return
1.9%
Cap rate
0.4%
Rent to Value Ratio
Active
$575,000
4
bds
|
3
ba
|
2,467
sqft
|
built
2019
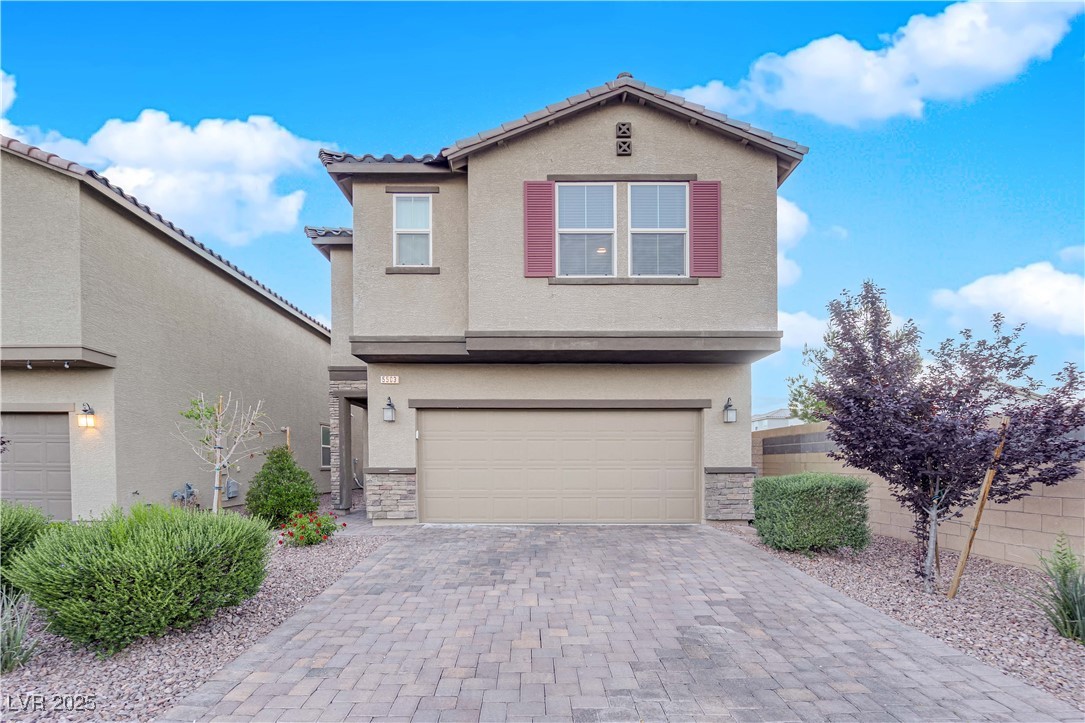
5503 Jinan St, Las Vegas, NV 89148
$-1,684
Cash flow
-15.3%
Cash-on-Cash Return
2.8%
Cap rate
0.5%
Rent to Value Ratio
Active
$775,000
5
bds
|
4
ba
|
3,061
sqft
|
built
1996
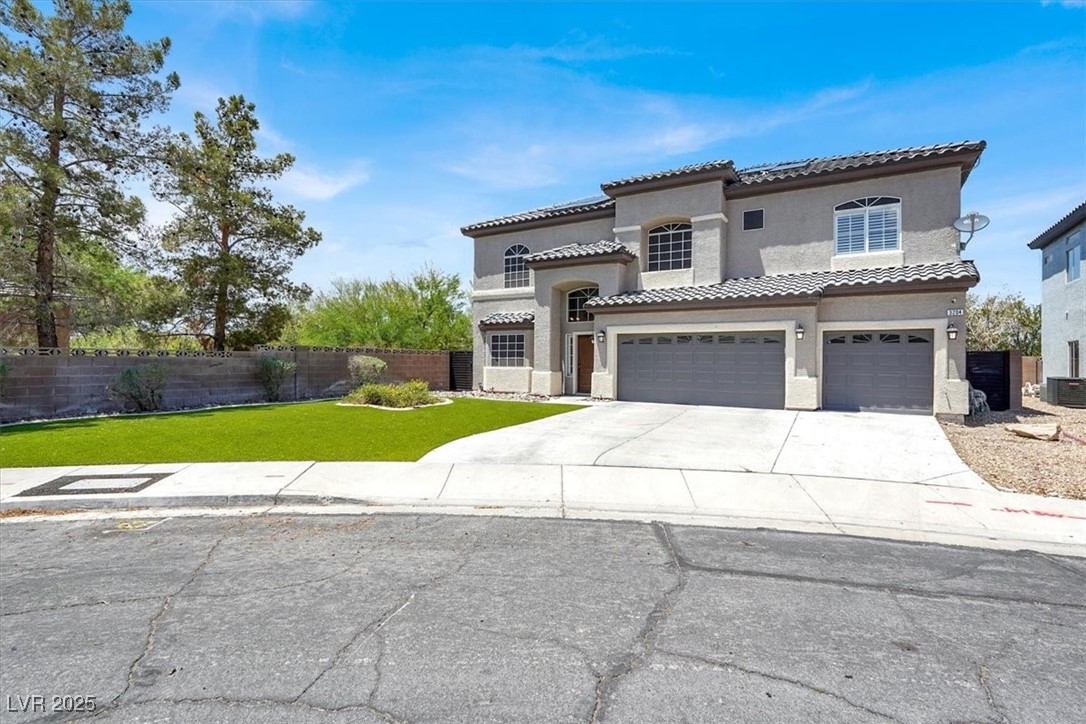
3204 Rutledge Dr, Las Vegas, NV 89120
$-1,613
Cash flow
-10.9%
Cash-on-Cash Return
3.8%
Cap rate
0.5%
Rent to Value Ratio
Active
$739,000
4
bds
|
4
ba
|
3,063
sqft
|
built
2004
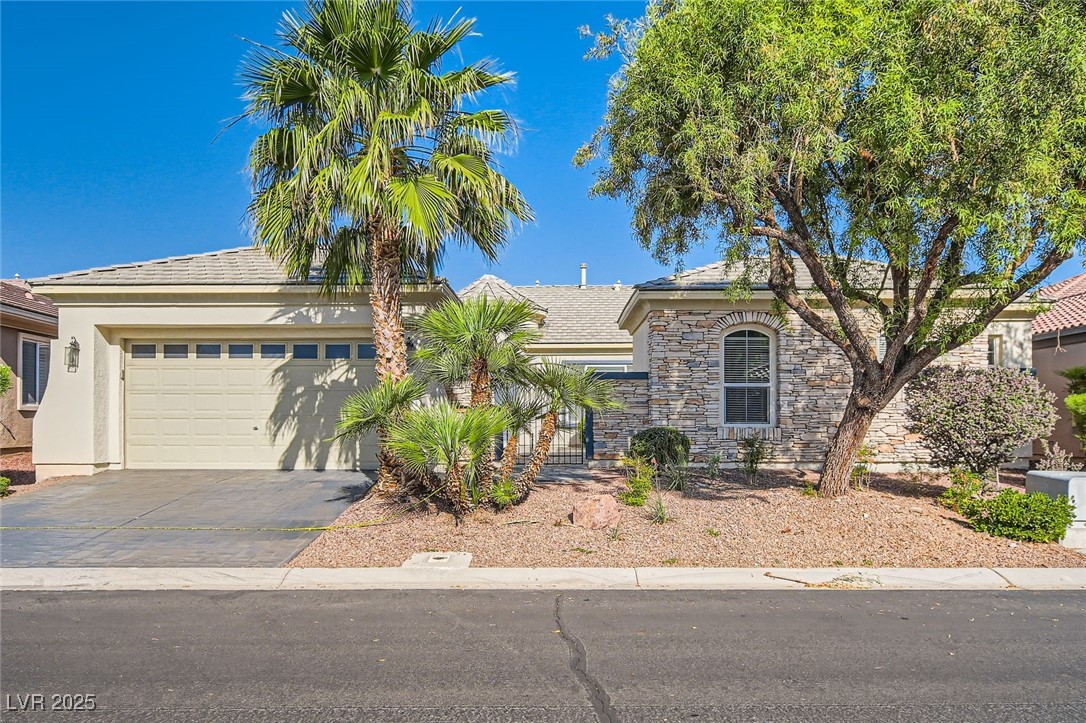
8305 Chapelle Ct, Las Vegas, NV 89131
$-2,244
Cash flow
-15.8%
Cash-on-Cash Return
2.6%
Cap rate
0.4%
Rent to Value Ratio
Active
$828,888
5
bds
|
4
ba
|
4,398
sqft
|
built
2014
8223 Saddleback Ledge Ave, Las Vegas, NV 89147
$-2,542
Cash flow
-16.0%
Cash-on-Cash Return
2.6%
Cap rate
0.4%
Rent to Value Ratio
Pending
$335,000
3
bds
|
1
ba
|
1,014
sqft
|
built
1971
3682 Deer Creek Way, Las Vegas, NV 89115
$-620
Cash flow
-9.7%
Cash-on-Cash Return
4.1%
Cap rate
0.5%
Rent to Value Ratio
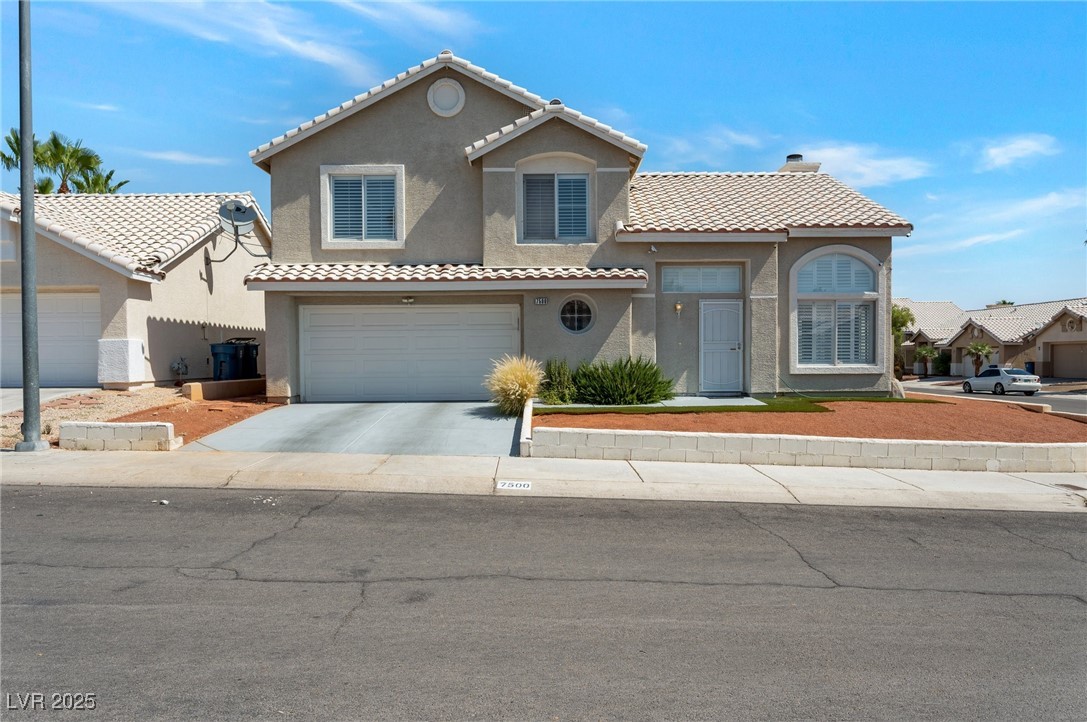
Active under contract
$470,000
3
bds
|
3
ba
|
1,531
sqft
|
built
1993
7500 Sea Spray Ave, Las Vegas, NV 89128
$-1,105
Cash flow
-12.3%
Cash-on-Cash Return
3.5%
Cap rate
0.5%
Rent to Value Ratio
Active under contract
$450,000
3
bds
|
2
ba
|
1,612
sqft
|
built
2000
9622 Emeraude Ave, Las Vegas, NV 89147
$-1,361
Cash flow
-15.8%
Cash-on-Cash Return
2.7%
Cap rate
0.4%
Rent to Value Ratio
Pending
$328,800
3
bds
|
2
ba
|
1,036
sqft
|
built
1960
313 View Dr, Las Vegas, NV 89107
$-553
Cash flow
-8.8%
Cash-on-Cash Return
4.3%
Cap rate
0.5%
Rent to Value Ratio
Active
$1,800,000
3
bds
|
3
ba
|
3,169
sqft
|
built
2018
10228 Shell Star Ave, Las Vegas, NV 89135
$-7,382
Cash flow
-21.4%
Cash-on-Cash Return
1.4%
Cap rate
0.2%
Rent to Value Ratio
Active
$405,000
3
bds
|
2
ba
|
1,363
sqft
|
built
1989
901 Rockaway St, Las Vegas, NV 89145
$-1,012
Cash flow
-13.0%
Cash-on-Cash Return
3.3%
Cap rate
0.4%
Rent to Value Ratio
Active under contract
$384,900
3
bds
|
3
ba
|
1,914
sqft
|
built
2021
3760 Paseo De Paz Ave, Las Vegas, NV 89115
$-954
Cash flow
-12.9%
Cash-on-Cash Return
3.3%
Cap rate
0.5%
Rent to Value Ratio
Active
$520,000
4
bds
|
3
ba
|
1,899
sqft
|
built
1994
6101 Browning Way, Las Vegas, NV 89130
$-1,157
Cash flow
-11.6%
Cash-on-Cash Return
3.6%
Cap rate
0.5%
Rent to Value Ratio
Active
$226,000
1
bds
|
1
ba
|
853
sqft
|
built
1996
9000 Las Vegas Blvd S, Las Vegas, NV 89123
$-675
Cash flow
-15.6%
Cash-on-Cash Return
2.7%
Cap rate
0.6%
Rent to Value Ratio
Active
$315,000
3
bds
|
2
ba
|
1,344
sqft
|
built
1996
1404 Seward St, Las Vegas, NV 89128
$-787
Cash flow
-13.0%
Cash-on-Cash Return
3.3%
Cap rate
0.6%
Rent to Value Ratio
Active
$369,990
4
bds
|
2
ba
|
1,316
sqft
|
built
1971
3309 Marionette Ave, Las Vegas, NV 89101
$-1,042
Cash flow
-14.7%
Cash-on-Cash Return
2.9%
Cap rate
0.4%
Rent to Value Ratio
Active
$597,000
3
bds
|
2
ba
|
1,939
sqft
|
built
2020
10182 Skye Run Ave, Las Vegas, NV 89166
$-1,493
Cash flow
-13.0%
Cash-on-Cash Return
3.3%
Cap rate
0.5%
Rent to Value Ratio
Active
$1,699,999
5
bds
|
5
ba
|
4,583
sqft
|
built
1966
3108 Sonia Dr, Las Vegas, NV 89107
$-6,489
Cash flow
-19.9%
Cash-on-Cash Return
1.7%
Cap rate
0.3%
Rent to Value Ratio
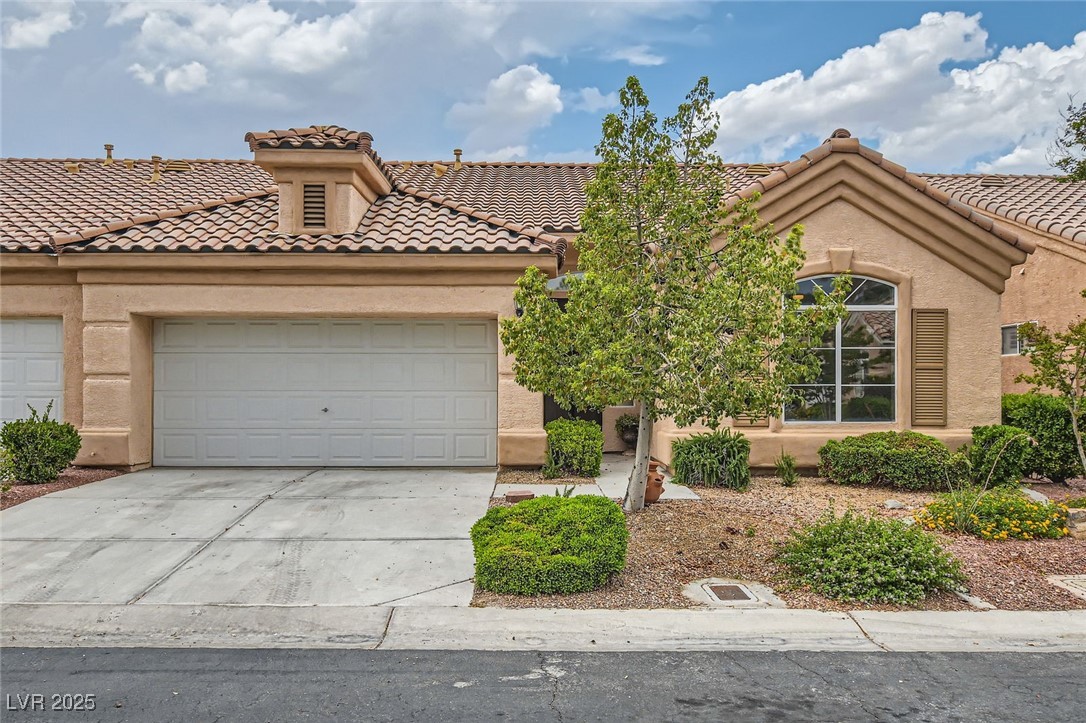
Active
$494,000
4
bds
|
3
ba
|
1,946
sqft
|
built
1990
7625 Raven Hills Dr, Las Vegas, NV 89149
$-1,333
Cash flow
-14.1%
Cash-on-Cash Return
3.0%
Cap rate
0.4%
Rent to Value Ratio