Las Vegas, NV Investment Properties for Sale
Browse homes for sale and investment properties in Las Vegas, NV. Refine your search by price, property type, or more.
Best cash flowing properties in Las Vegas, NV
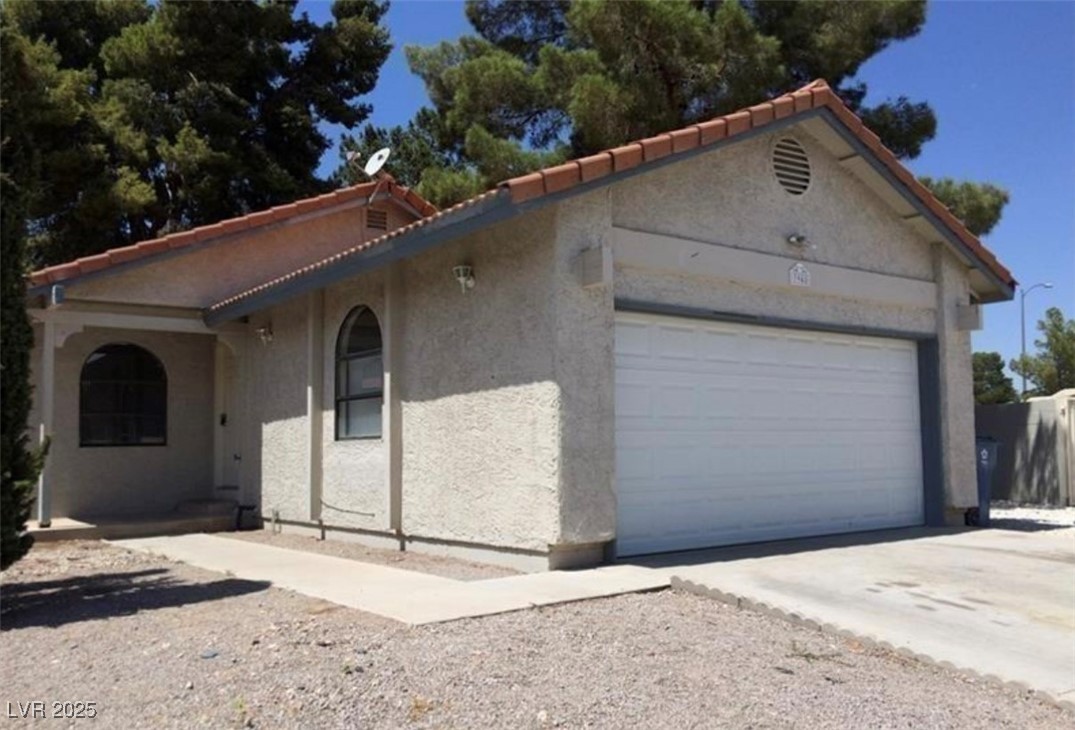
Active
$220,000
2
bds
|
2
ba
|
1,029
sqft
|
built
1995
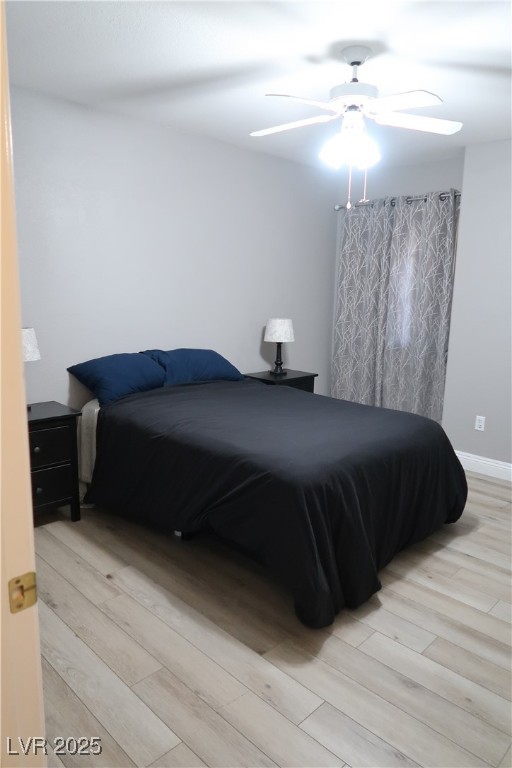
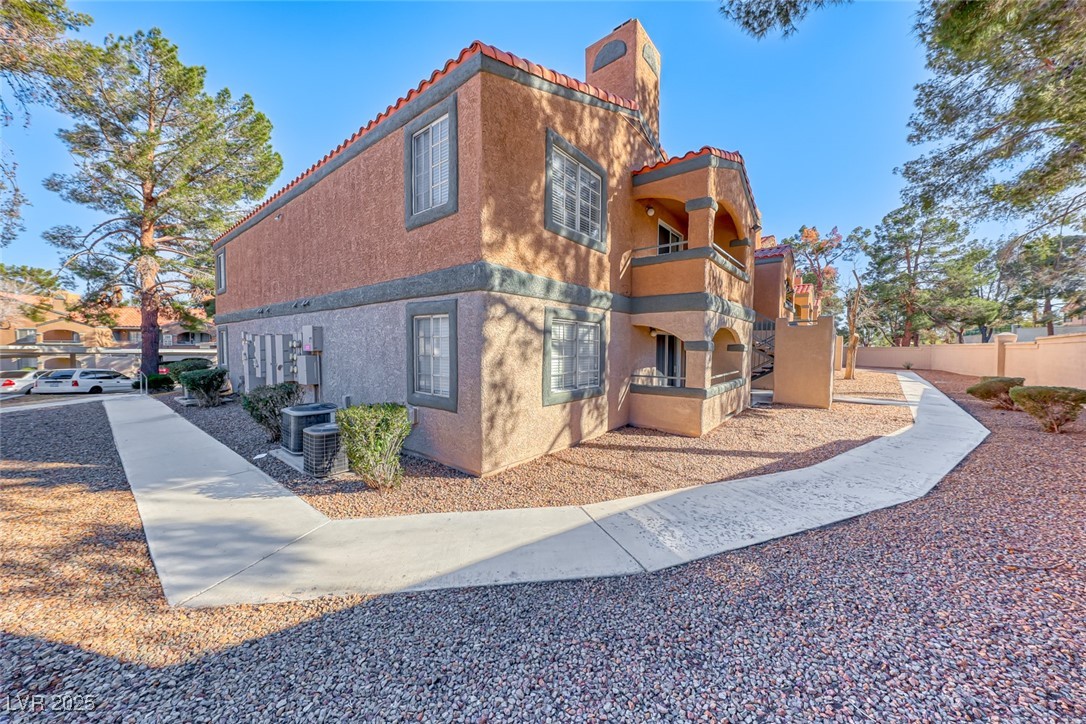
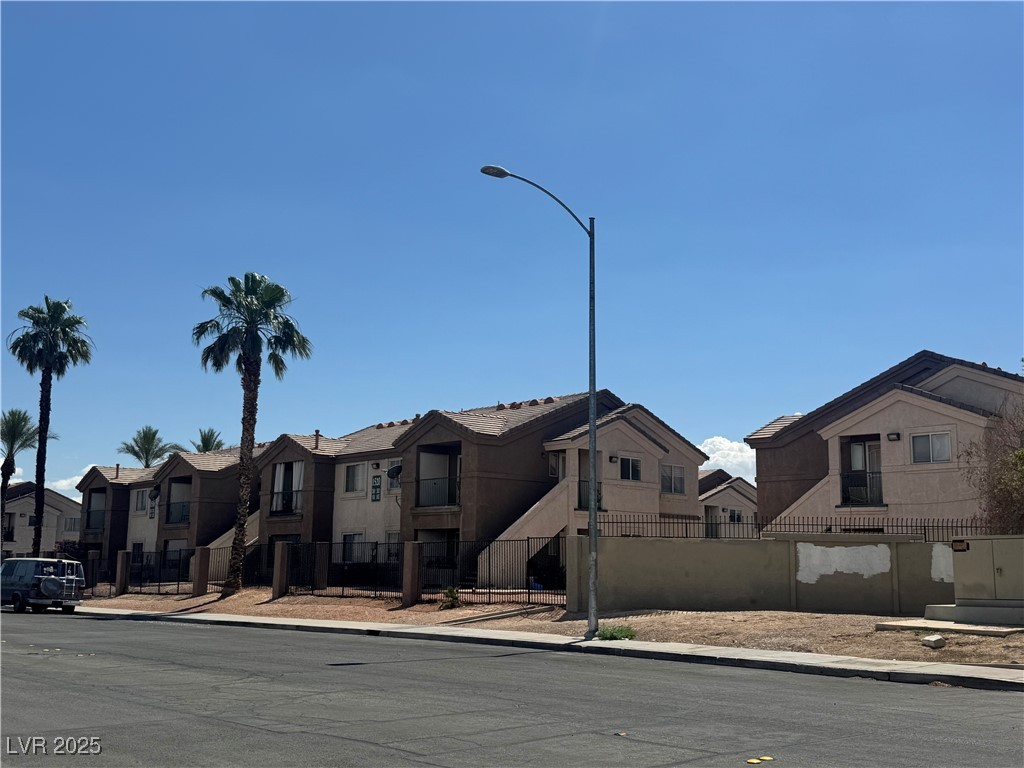
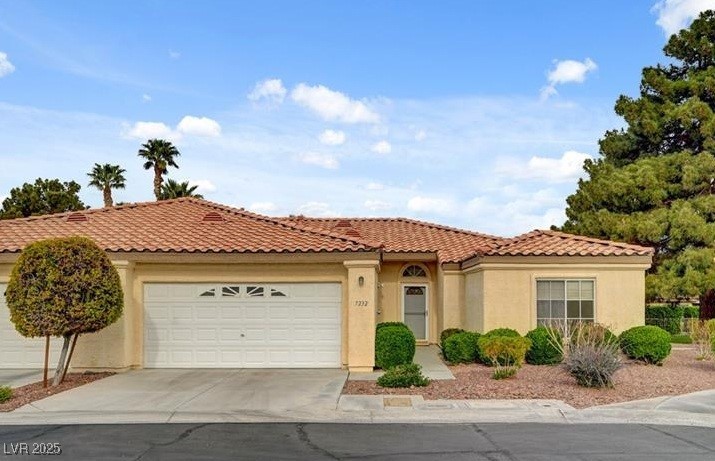
2725 S Nellis Blvd, Las Vegas, NV 89121
$-461
Cash flow
-10.9%
Cash-on-Cash Return
3.8%
Cap rate
0.6%
Rent to Value Ratio
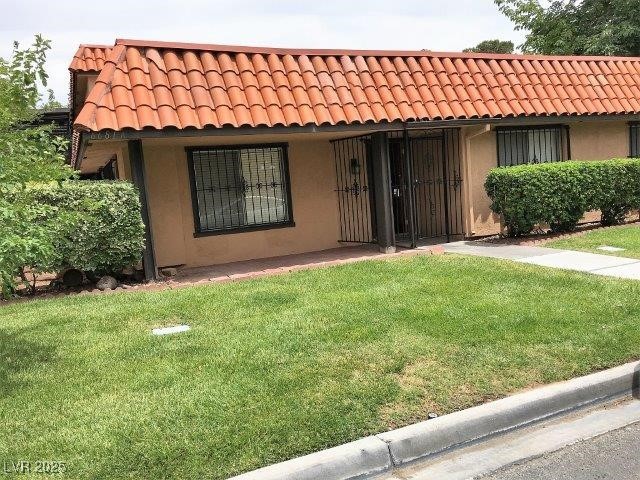
Active
$224,000
2
bds
|
2
ba
|
978
sqft
|
built
1989
227 N Lamb Blvd, Las Vegas, NV 89110
$-474
Cash flow
-11.0%
Cash-on-Cash Return
3.7%
Cap rate
0.6%
Rent to Value Ratio
5,530 out of 5,662 properties for sale in Las Vegas, NV
Limited Results Shown
Create a free account, or log in to reveal all property listings and enjoy the complete experience.
Active
$1,975,000
4
bds
|
5
ba
|
4,335
sqft
|
built
2006
7682 Rafter Ct, Las Vegas, NV 89139
$-6,547
Cash flow
-17.3%
Cash-on-Cash Return
2.3%
Cap rate
0.3%
Rent to Value Ratio
Active
$3,395,000
3
bds
|
4
ba
|
2,795
sqft
|
built
2006
9101 Alta Dr, Las Vegas, NV 89145
$-17,989
Cash flow
-27.6%
Cash-on-Cash Return
-0.1%
Cap rate
0.2%
Rent to Value Ratio
Active under contract
$984,500
5
bds
|
3
ba
|
2,819
sqft
|
built
1985
2721 Family Ct, Las Vegas, NV 89117
$-3,015
Cash flow
-16.0%
Cash-on-Cash Return
2.6%
Cap rate
0.4%
Rent to Value Ratio
Active
$2,775,000
4
bds
|
6
ba
|
7,713
sqft
|
built
1989
42 Sawgrass Ct, Las Vegas, NV 89113
$-9,542
Cash flow
-17.9%
Cash-on-Cash Return
2.2%
Cap rate
0.4%
Rent to Value Ratio
Active
$950,000
4
bds
|
3
ba
|
3,219
sqft
|
built
2018
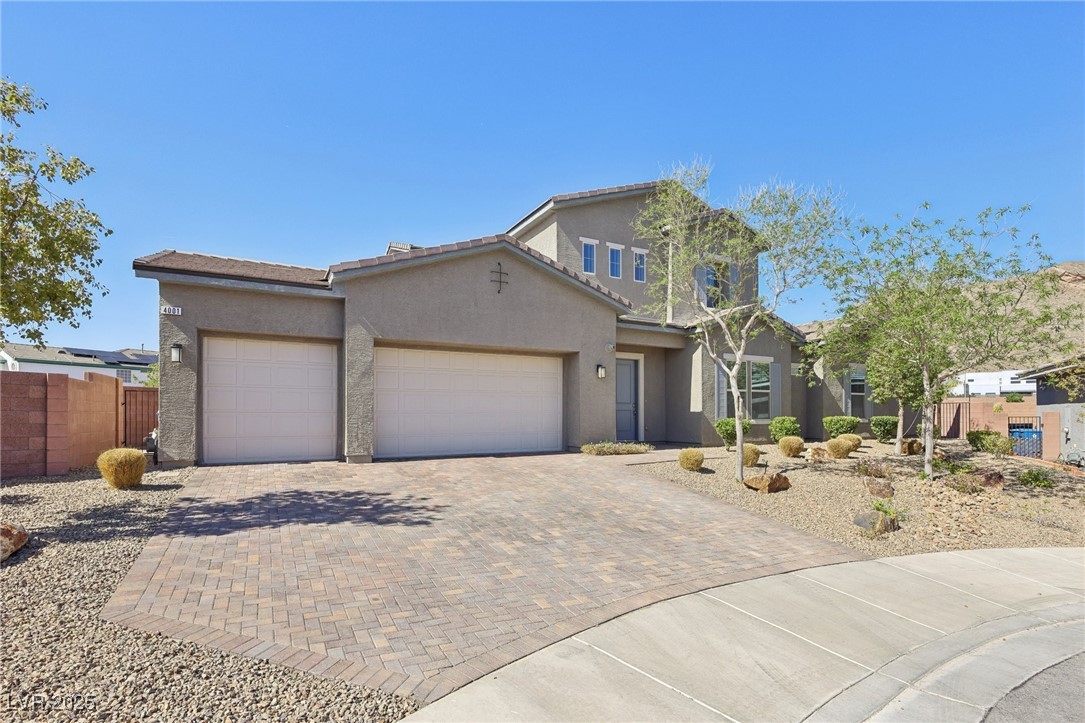
4001 Turquoise Falls St, Las Vegas, NV 89129
$-3,159
Cash flow
-17.3%
Cash-on-Cash Return
2.3%
Cap rate
0.4%
Rent to Value Ratio
Active
$1,283,000
4
bds
|
4
ba
|
2,999
sqft
|
built
1951
2711 Ashby Ave, Las Vegas, NV 89102
$-2,836
Cash flow
-11.5%
Cash-on-Cash Return
3.6%
Cap rate
0.5%
Rent to Value Ratio

Active
$785,000
5
bds
|
4
ba
|
3,496
sqft
|
built
2008
10220 Radcliffe Peak Ave, Las Vegas, NV 89166
$-1,817
Cash flow
-12.1%
Cash-on-Cash Return
3.5%
Cap rate
0.5%
Rent to Value Ratio
Active
$224,000
2
bds
|
2
ba
|
978
sqft
|
built
1989
227 N Lamb Blvd, Las Vegas, NV 89110
$-474
Cash flow
-11.0%
Cash-on-Cash Return
3.7%
Cap rate
0.6%
Rent to Value Ratio
Active
$250,000
2
bds
|
2
ba
|
876
sqft
|
built
1989
211 Mission Laguna Ln, Las Vegas, NV 89107
$-849
Cash flow
-17.7%
Cash-on-Cash Return
2.2%
Cap rate
0.5%
Rent to Value Ratio
Active under contract
$375,000
3
bds
|
2
ba
|
1,244
sqft
|
built
1994
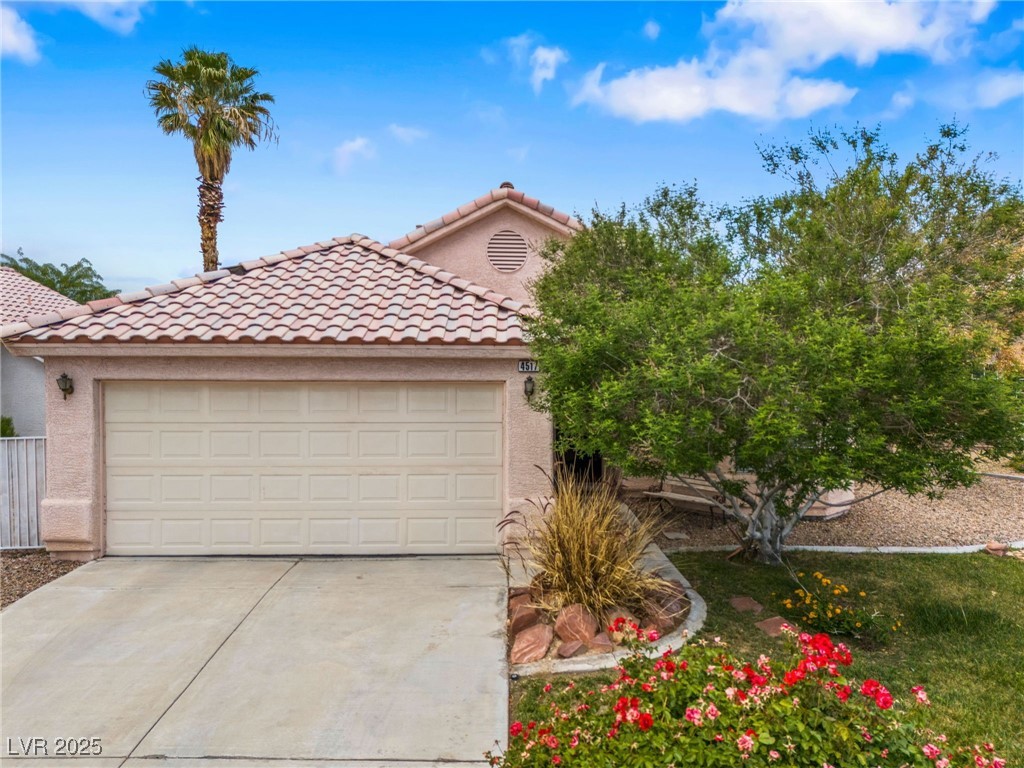
4517 Rodman Dr, Las Vegas, NV 89130
$-845
Cash flow
-11.8%
Cash-on-Cash Return
3.6%
Cap rate
0.5%
Rent to Value Ratio
Active
$515,000
4
bds
|
3
ba
|
1,927
sqft
|
built
1988
2416 Sun Shores Dr, Las Vegas, NV 89128
$-1,385
Cash flow
-14.0%
Cash-on-Cash Return
3.1%
Cap rate
0.4%
Rent to Value Ratio
Pending
$430,000
2
bds
|
2
ba
|
1,307
sqft
|
built
1989
5010 Crooked Stick Way, Las Vegas, NV 89113
$-1,948
Cash flow
-23.6%
Cash-on-Cash Return
0.8%
Cap rate
0.5%
Rent to Value Ratio
Active
$190,000
2
bds
|
2
ba
|
895
sqft
|
built
1999
1505 Frank Aved St, Las Vegas, NV 89110
$-624
Cash flow
-17.1%
Cash-on-Cash Return
2.3%
Cap rate
0.6%
Rent to Value Ratio
Active
$1,050,000
5
bds
|
3
ba
|
2,967
sqft
|
built
1995
9435 Westwind Rd, Las Vegas, NV 89139
$-2,818
Cash flow
-14.0%
Cash-on-Cash Return
3.1%
Cap rate
0.4%
Rent to Value Ratio
Active
$809,990
4
bds
|
5
ba
|
3,250
sqft
|
built
1992
2000 White Falls St, Las Vegas, NV 89128
$-1,936
Cash flow
-12.5%
Cash-on-Cash Return
3.4%
Cap rate
0.5%
Rent to Value Ratio
Active
$619,999
3
bds
|
3
ba
|
2,328
sqft
|
built
2021
7445 Tinley Creek Ave, Las Vegas, NV 89113
$-1,939
Cash flow
-16.3%
Cash-on-Cash Return
2.5%
Cap rate
0.4%
Rent to Value Ratio
Active
$429,900
3
bds
|
2
ba
|
1,552
sqft
|
built
1981
6733 E Carey Ave, Las Vegas, NV 89156
$-1,427
Cash flow
-17.3%
Cash-on-Cash Return
2.3%
Cap rate
0.3%
Rent to Value Ratio
Active
$459,997
4
bds
|
4
ba
|
2,520
sqft
|
built
2021
2964 Gunnery Forge St, Las Vegas, NV 89156
$-1,123
Cash flow
-12.7%
Cash-on-Cash Return
3.4%
Cap rate
0.5%
Rent to Value Ratio
Active
$229,900
2
bds
|
2
ba
|
1,029
sqft
|
built
1994
2725 S Nellis Blvd, Las Vegas, NV 89121
$-949
Cash flow
-21.5%
Cash-on-Cash Return
1.3%
Cap rate
0.4%
Rent to Value Ratio
Active
$600,000
4
bds
|
2
ba
|
1,683
sqft
|
built
1963
1778 Cypress Trl, Las Vegas, NV 89108
$-1,866
Cash flow
-16.2%
Cash-on-Cash Return
2.6%
Cap rate
0.4%
Rent to Value Ratio
Active
$799,999
5
bds
|
4
ba
|
4,398
sqft
|
built
2014
8137 Cape Flattery Ave, Las Vegas, NV 89147
$-2,143
Cash flow
-14.0%
Cash-on-Cash Return
3.1%
Cap rate
0.5%
Rent to Value Ratio

Active
$525,000
5
bds
|
3
ba
|
2,085
sqft
|
built
2013
4806 Ranch Estates Ct, Las Vegas, NV 89139
$-1,686
Cash flow
-16.8%
Cash-on-Cash Return
2.4%
Cap rate
0.4%
Rent to Value Ratio
Active
$220,000
2
bds
|
2
ba
|
1,029
sqft
|
built
1995
2725 S Nellis Blvd, Las Vegas, NV 89121
$-461
Cash flow
-10.9%
Cash-on-Cash Return
3.8%
Cap rate
0.6%
Rent to Value Ratio
Active
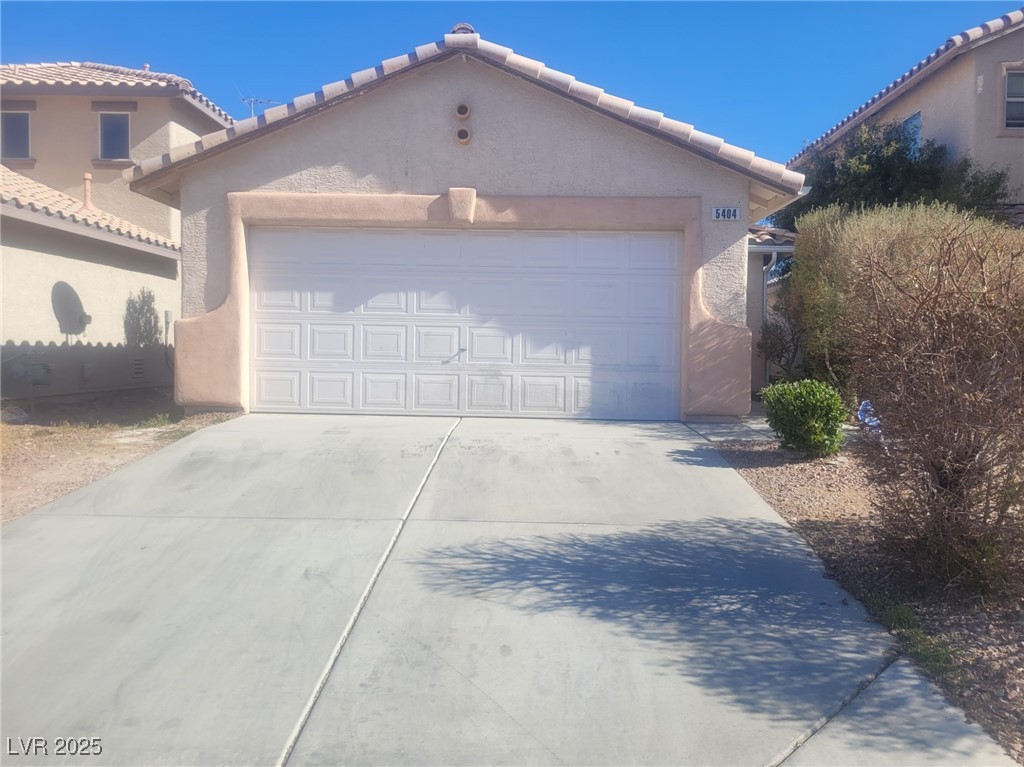
$359,999
3
bds
|
2
ba
|
975
sqft
|
built
2001
5404 Walcott Dr, Las Vegas, NV 89118
$-940
Cash flow
-13.6%
Cash-on-Cash Return
3.2%
Cap rate
0.4%
Rent to Value Ratio
Active
$880,000
3
bds
|
4
ba
|
5,036
sqft
|
built
1977
485 Sari Dr, Las Vegas, NV 89110
$-1,458
Cash flow
-8.6%
Cash-on-Cash Return
4.3%
Cap rate
0.6%
Rent to Value Ratio

Active
$469,000
4
bds
|
2
ba
|
1,840
sqft
|
built
1973
4000 E Twain Ave, Las Vegas, NV 89121
$-1,011
Cash flow
-11.2%
Cash-on-Cash Return
3.7%
Cap rate
0.5%
Rent to Value Ratio
Active
$239,000
2
bds
|
2
ba
|
1,053
sqft
|
built
1991
2200 S Fort Apache Rd, Las Vegas, NV 89117
$-711
Cash flow
-15.5%
Cash-on-Cash Return
2.7%
Cap rate
0.6%
Rent to Value Ratio
Active
$429,900
3
bds
|
2
ba
|
1,214
sqft
|
built
1983
3948 Applecrest St, Las Vegas, NV 89108
$-1,258
Cash flow
-15.3%
Cash-on-Cash Return
2.8%
Cap rate
0.4%
Rent to Value Ratio
Active
$330,000
3
bds
|
2
ba
|
1,176
sqft
|
built
1974
6681 Bubbling Brook Dr, Las Vegas, NV 89107
$-1,098
Cash flow
-17.4%
Cash-on-Cash Return
2.3%
Cap rate
0.5%
Rent to Value Ratio
Active
$314,990
3
bds
|
2
ba
|
1,131
sqft
|
built
1997
5250 S Rainbow Blvd, Las Vegas, NV 89118
$-960
Cash flow
-15.9%
Cash-on-Cash Return
2.6%
Cap rate
0.6%
Rent to Value Ratio
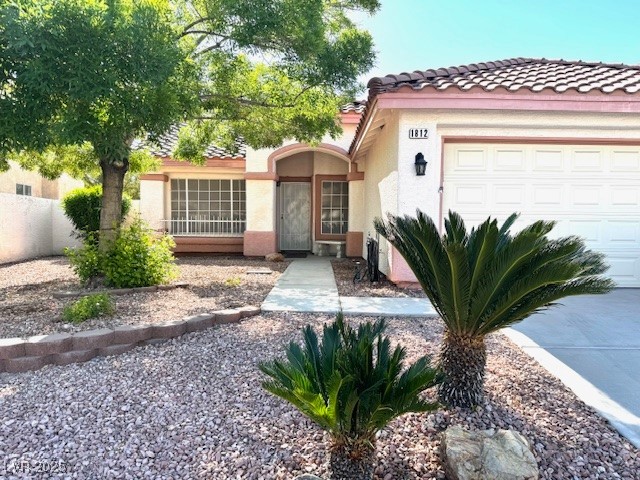
Active
$485,000
3
bds
|
2
ba
|
1,628
sqft
|
built
1996
1812 Jack Rabbit Way, Las Vegas, NV 89128
$-1,440
Cash flow
-15.5%
Cash-on-Cash Return
2.7%
Cap rate
0.4%
Rent to Value Ratio
Active
$359,000
2
bds
|
2
ba
|
1,608
sqft
|
built
1995
7232 Vista Bonita Dr, Las Vegas, NV 89149
$-1,107
Cash flow
-16.1%
Cash-on-Cash Return
2.6%
Cap rate
0.6%
Rent to Value Ratio
Active
$644,900
4
bds
|
4
ba
|
3,169
sqft
|
built
1979
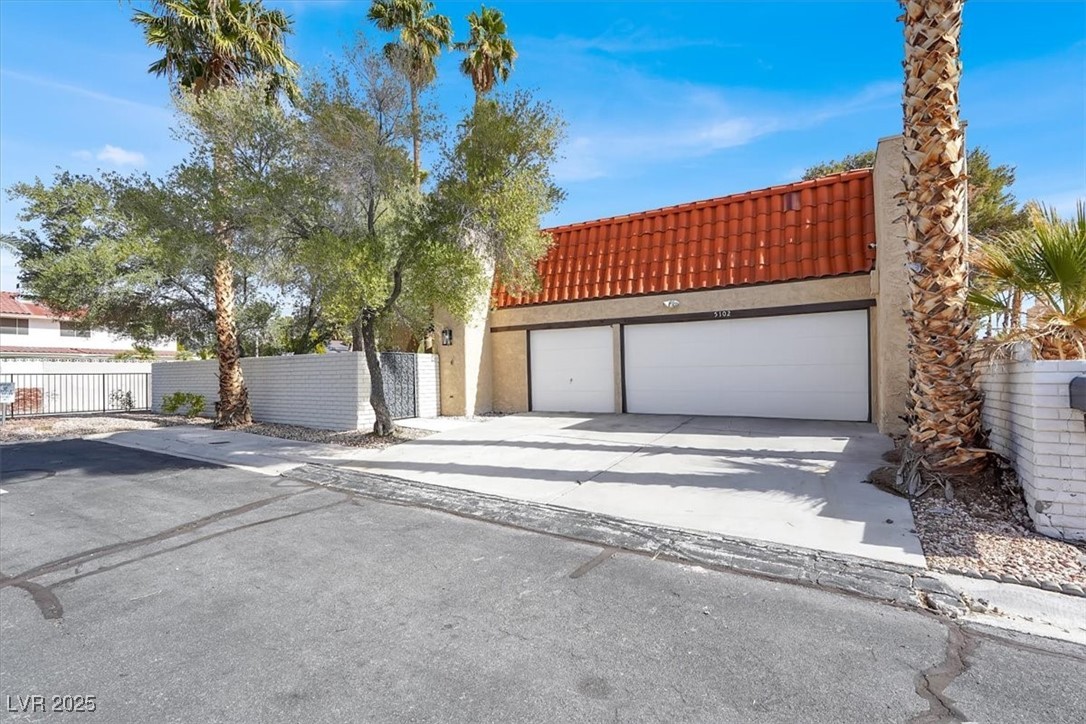
5102 Tennis Ct E, Las Vegas, NV 89120
$-1,199
Cash flow
-9.7%
Cash-on-Cash Return
4.1%
Cap rate
0.6%
Rent to Value Ratio
Active
$415,000
3
bds
|
3
ba
|
1,845
sqft
|
built
2022
2795 Atomic Tangerine Way, Las Vegas, NV 89183
$-1,046
Cash flow
-13.2%
Cash-on-Cash Return
3.3%
Cap rate
0.6%
Rent to Value Ratio
Active
$515,000
2
bds
|
3
ba
|
1,856
sqft
|
built
1974
3111 Bel Air Dr, Las Vegas, NV 89109
$-2,652
Cash flow
-26.9%
Cash-on-Cash Return
0.1%
Cap rate
0.4%
Rent to Value Ratio
Active
$618,000
5
bds
|
3
ba
|
2,206
sqft
|
built
1998
3751 Morning Canyon St, Las Vegas, NV 89147
$-1,516
Cash flow
-12.8%
Cash-on-Cash Return
3.3%
Cap rate
0.5%
Rent to Value Ratio
Active
$1,550,000
5
bds
|
5
ba
|
4,364
sqft
|
built
2003
10644 San Vercelli Ct, Las Vegas, NV 89141
$-3,236
Cash flow
-10.9%
Cash-on-Cash Return
3.8%
Cap rate
0.5%
Rent to Value Ratio
Active
$1,675,000
5
bds
|
5
ba
|
5,436
sqft
|
built
1976
3132 El Camino Rd, Las Vegas, NV 89146
$-4,460
Cash flow
-13.9%
Cash-on-Cash Return
3.1%
Cap rate
0.4%
Rent to Value Ratio
Active
$2,000,000
8
bds
|
6
ba
|
5,577
sqft
|
built
1979
120 Chartan Ave, Las Vegas, NV 89183
$-6,341
Cash flow
-16.5%
Cash-on-Cash Return
2.5%
Cap rate
0.3%
Rent to Value Ratio
Active
$1,750,000
3
bds
|
3
ba
|
3,169
sqft
|
built
2018
10271 Meridian Hill Ave, Las Vegas, NV 89135
$-4,519
Cash flow
-13.5%
Cash-on-Cash Return
3.2%
Cap rate
0.5%
Rent to Value Ratio