Las Vegas, NV Investment Properties for Sale
Browse homes for sale and investment properties in Las Vegas, NV. Refine your search by price, property type, or more.
Best cash flowing properties in Las Vegas, NV
Active
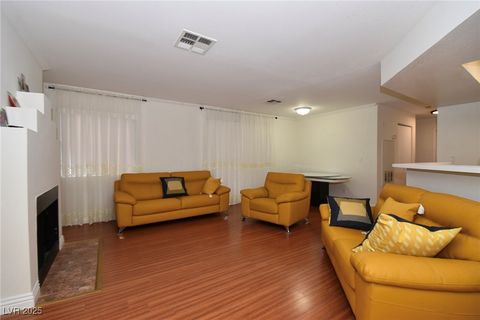
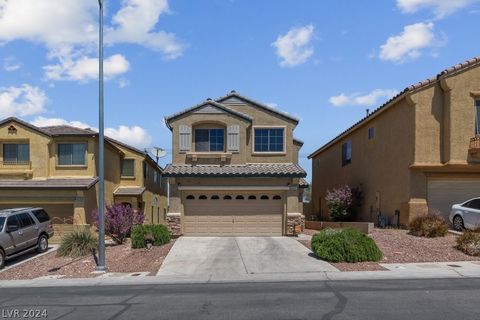
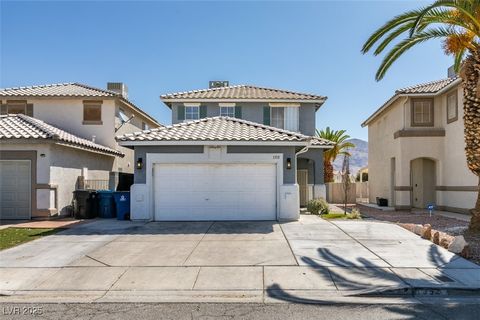
$248,000
2
bds
|
2
ba
|
998
sqft
|
built
1990
8600 W Charleston Blvd, Las Vegas, NV 89117
$-501
Cash flow
-10.5%
Cash-on-Cash Return
3.8%
Cap rate
0.6%
Rent to Value Ratio
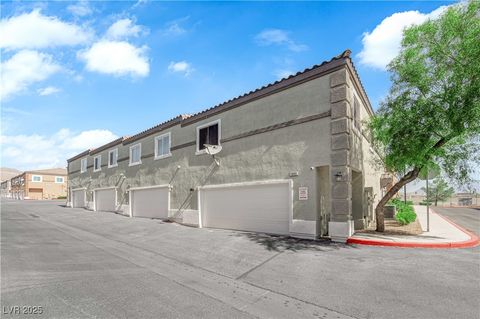
Active
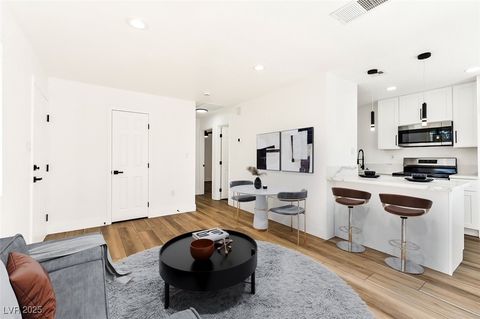
$215,000
2
bds
|
1
ba
|
680
sqft
|
built
1972
5078 Mountain Vista St, Las Vegas, NV 89120
$-513
Cash flow
-12.4%
Cash-on-Cash Return
3.4%
Cap rate
0.6%
Rent to Value Ratio
6,275 out of 6,409 properties for sale in Las Vegas, NV
Limited Results Shown
Create a free account, or log in to reveal all property listings and enjoy the complete experience.
Active
$215,000
2
bds
|
1
ba
|
680
sqft
|
built
1972
5078 Mountain Vista St, Las Vegas, NV 89120
$-513
Cash flow
-12.4%
Cash-on-Cash Return
3.4%
Cap rate
0.6%
Rent to Value Ratio
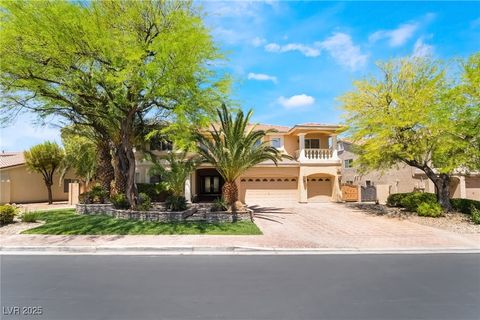
Active
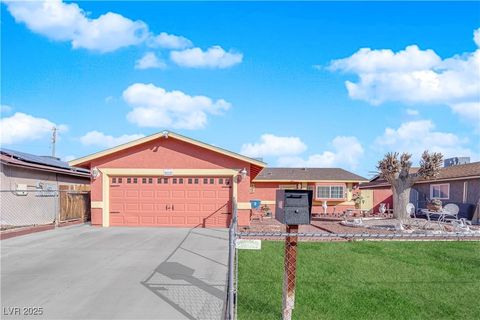
$370,000
3
bds
|
2
ba
|
1,104
sqft
|
built
1980
3920 Geist Ave, Las Vegas, NV 89115
$-772
Cash flow
-10.9%
Cash-on-Cash Return
3.8%
Cap rate
0.5%
Rent to Value Ratio
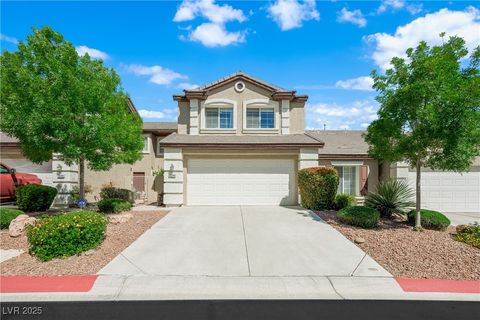
Active
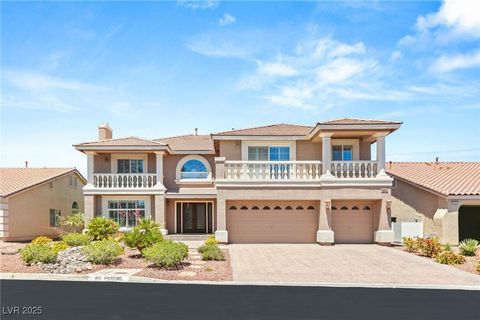
$1,175,000
5
bds
|
4
ba
|
5,025
sqft
|
built
2006
4542 Grey Spencer Dr, Las Vegas, NV 89141
$-2,462
Cash flow
-10.9%
Cash-on-Cash Return
3.8%
Cap rate
0.5%
Rent to Value Ratio
Active
$653,000
3
bds
|
2
ba
|
2,079
sqft
|
built
2021
8269 Skye Peak St, Las Vegas, NV 89166
$-2,137
Cash flow
-17.1%
Cash-on-Cash Return
2.3%
Cap rate
0.4%
Rent to Value Ratio
Active
$659,000
5
bds
|
4
ba
|
2,300
sqft
|
built
2004
11484 Roncat Ct, Las Vegas, NV 89141
$-1,409
Cash flow
-11.2%
Cash-on-Cash Return
3.7%
Cap rate
0.5%
Rent to Value Ratio
Active
$950,000
4
bds
|
2
ba
|
2,552
sqft
|
built
1997
4045 N Chieftain St, Las Vegas, NV 89129
$-3,065
Cash flow
-16.8%
Cash-on-Cash Return
2.4%
Cap rate
0.3%
Rent to Value Ratio

Active
$2,325,000
4
bds
|
5
ba
|
3,415
sqft
|
built
2024
10739 Agate Cliffs Ave, Las Vegas, NV 89135
$-5,734
Cash flow
-12.9%
Cash-on-Cash Return
3.3%
Cap rate
0.4%
Rent to Value Ratio
Active
$529,000
4
bds
|
3
ba
|
2,567
sqft
|
built
2007
10118 Farmington Hall Ct, Las Vegas, NV 89129
$-1,399
Cash flow
-13.8%
Cash-on-Cash Return
3.1%
Cap rate
0.5%
Rent to Value Ratio

Active
$499,900
3
bds
|
3
ba
|
2,197
sqft
|
built
2017
3854 Stadium Ave, Las Vegas, NV 89120
$-1,501
Cash flow
-15.7%
Cash-on-Cash Return
2.7%
Cap rate
0.4%
Rent to Value Ratio
Active
$688,000
4
bds
|
3
ba
|
2,503
sqft
|
built
2003
11237 Newbury Hills Ave, Las Vegas, NV 89138
$-1,988
Cash flow
-15.1%
Cash-on-Cash Return
2.8%
Cap rate
0.4%
Rent to Value Ratio
Active
$359,999
3
bds
|
2
ba
|
1,145
sqft
|
built
1987
2711 Sesame Dr, Las Vegas, NV 89142
$-902
Cash flow
-13.1%
Cash-on-Cash Return
3.3%
Cap rate
0.4%
Rent to Value Ratio
Active
$4,900,000
5
bds
|
7
ba
|
5,934
sqft
|
built
2003
33 Promontory Ridge Dr, Las Vegas, NV 89135
$-20,729
Cash flow
-22.1%
Cash-on-Cash Return
1.2%
Cap rate
0.2%
Rent to Value Ratio
Active
$434,000
3
bds
|
2
ba
|
1,353
sqft
|
built
1996
5263 Shasta Lake Way, Las Vegas, NV 89118
$-1,139
Cash flow
-13.7%
Cash-on-Cash Return
3.1%
Cap rate
0.5%
Rent to Value Ratio

Active
$1,750,000
4
bds
|
5
ba
|
3,892
sqft
|
built
2023
11911 Sandstone Arch Dr, Las Vegas, NV 89138
$-3,652
Cash flow
-10.9%
Cash-on-Cash Return
3.8%
Cap rate
0.6%
Rent to Value Ratio
Active
$699,000
3
bds
|
3
ba
|
1,802
sqft
|
built
2023
11652 Desert Hollow Ave, Las Vegas, NV 89138
$-2,341
Cash flow
-17.5%
Cash-on-Cash Return
2.2%
Cap rate
0.4%
Rent to Value Ratio

Active
$625,000
5
bds
|
3
ba
|
2,646
sqft
|
built
2021
8324 S Miller Ln, Las Vegas, NV 89113
$-2,020
Cash flow
-16.9%
Cash-on-Cash Return
2.4%
Cap rate
0.4%
Rent to Value Ratio
Active
$699,900
4
bds
|
2
ba
|
2,125
sqft
|
built
2001
3882 Genoa Dr, Las Vegas, NV 89141
$-2,059
Cash flow
-15.3%
Cash-on-Cash Return
2.7%
Cap rate
0.4%
Rent to Value Ratio
Active
$450,000
4
bds
|
3
ba
|
1,906
sqft
|
built
1973
4602 Inland Ct, Las Vegas, NV 89147
$-780
Cash flow
-9.0%
Cash-on-Cash Return
4.2%
Cap rate
0.6%
Rent to Value Ratio
Active
$680,000
4
bds
|
3
ba
|
2,311
sqft
|
built
2002
10638 La Spezia Way, Las Vegas, NV 89141
$-1,623
Cash flow
-12.5%
Cash-on-Cash Return
3.4%
Cap rate
0.5%
Rent to Value Ratio

Active
$370,000
3
bds
|
3
ba
|
1,302
sqft
|
built
2005
9613 Eland Ct, Las Vegas, NV 89149
$-532
Cash flow
-7.5%
Cash-on-Cash Return
4.5%
Cap rate
0.6%
Rent to Value Ratio
Active
$435,000
5
bds
|
3
ba
|
2,122
sqft
|
built
2005
6434 Diego Dr, Las Vegas, NV 89156
$-901
Cash flow
-10.8%
Cash-on-Cash Return
3.8%
Cap rate
0.5%
Rent to Value Ratio

Active
$615,000
4
bds
|
2
ba
|
2,192
sqft
|
built
1964
2129 N Michael Way, Las Vegas, NV 89108
$-1,594
Cash flow
-13.5%
Cash-on-Cash Return
3.2%
Cap rate
0.4%
Rent to Value Ratio
Active
$384,900
3
bds
|
3
ba
|
1,611
sqft
|
built
2007
10450 Gold Shadow Ave, Las Vegas, NV 89129
$-1,030
Cash flow
-14.0%
Cash-on-Cash Return
3.1%
Cap rate
0.5%
Rent to Value Ratio
Active
$1,349,000
5
bds
|
4
ba
|
5,383
sqft
|
built
2005
11237 Campsie Fells Ct, Las Vegas, NV 89141
$-2,868
Cash flow
-11.1%
Cash-on-Cash Return
3.7%
Cap rate
0.5%
Rent to Value Ratio
Active
$469,500
3
bds
|
3
ba
|
1,873
sqft
|
built
1997
10244 Amber Hue Ln, Las Vegas, NV 89144
$-1,275
Cash flow
-14.2%
Cash-on-Cash Return
3.0%
Cap rate
0.5%
Rent to Value Ratio

Active
$769,972
4
bds
|
3
ba
|
3,293
sqft
|
built
2008
8537 Eureka Heights Ct, Las Vegas, NV 89178
$-2,205
Cash flow
-14.9%
Cash-on-Cash Return
2.8%
Cap rate
0.4%
Rent to Value Ratio
Active
$730,000
3
bds
|
3
ba
|
2,046
sqft
|
built
2005
11625 Cabo Del Verde Ave, Las Vegas, NV 89138
$-2,489
Cash flow
-17.8%
Cash-on-Cash Return
2.2%
Cap rate
0.4%
Rent to Value Ratio
Active
$210,000
1
bds
|
1
ba
|
690
sqft
|
built
1989
3150 Soft Breezes Dr, Las Vegas, NV 89128
$-668
Cash flow
-16.6%
Cash-on-Cash Return
2.4%
Cap rate
0.6%
Rent to Value Ratio
Active
$209,500
1
bds
|
1
ba
|
690
sqft
|
built
1989
3150 Soft Breezes Dr, Las Vegas, NV 89128
$-590
Cash flow
-14.7%
Cash-on-Cash Return
2.9%
Cap rate
0.6%
Rent to Value Ratio
Active
$625,000
5
bds
|
4
ba
|
3,590
sqft
|
built
1978
4360 Flandes St, Las Vegas, NV 89121
$-1,256
Cash flow
-10.5%
Cash-on-Cash Return
3.9%
Cap rate
0.5%
Rent to Value Ratio
Active
$449,900
4
bds
|
3
ba
|
1,712
sqft
|
built
2000
1352 Angel Falls St, Las Vegas, NV 89142
$-1,103
Cash flow
-12.8%
Cash-on-Cash Return
3.3%
Cap rate
0.4%
Rent to Value Ratio
Active
$735,000
3
bds
|
3
ba
|
2,425
sqft
|
built
1970
940 Vegas Valley Dr, Las Vegas, NV 89109
$-1,508
Cash flow
-10.7%
Cash-on-Cash Return
3.8%
Cap rate
0.5%
Rent to Value Ratio
Active
$270,000
2
bds
|
2
ba
|
1,192
sqft
|
built
1992
1320 Driscoll Dr, Las Vegas, NV 89128
$-670
Cash flow
-12.9%
Cash-on-Cash Return
3.3%
Cap rate
0.6%
Rent to Value Ratio
Active
$274,888
2
bds
|
2
ba
|
1,204
sqft
|
built
1996
1505 Blackcombe St, Las Vegas, NV 89128
$-793
Cash flow
-15.1%
Cash-on-Cash Return
2.8%
Cap rate
0.5%
Rent to Value Ratio
Active
$275,000
2
bds
|
2
ba
|
1,119
sqft
|
built
1989
305 Crosswind Way, Las Vegas, NV 89145
$-565
Cash flow
-10.7%
Cash-on-Cash Return
3.8%
Cap rate
0.6%
Rent to Value Ratio

Active
$330,000
2
bds
|
3
ba
|
1,205
sqft
|
built
2007
7653 Fabled Filigree St, Las Vegas, NV 89149
$-681
Cash flow
-10.8%
Cash-on-Cash Return
3.8%
Cap rate
0.5%
Rent to Value Ratio
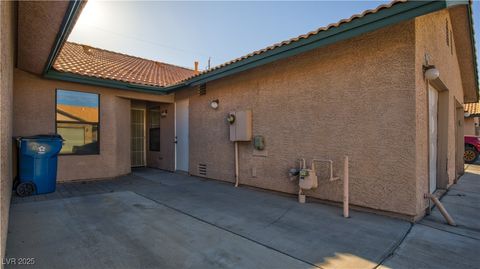
Active
$248,000
2
bds
|
2
ba
|
998
sqft
|
built
1990
8600 W Charleston Blvd, Las Vegas, NV 89117
$-501
Cash flow
-10.5%
Cash-on-Cash Return
3.8%
Cap rate
0.6%
Rent to Value Ratio
Active
$610,000
4
bds
|
3
ba
|
2,730
sqft
|
built
2006
10568 Salmon Leap St, Las Vegas, NV 89183
$-1,733
Cash flow
-14.8%
Cash-on-Cash Return
2.9%
Cap rate
0.4%
Rent to Value Ratio
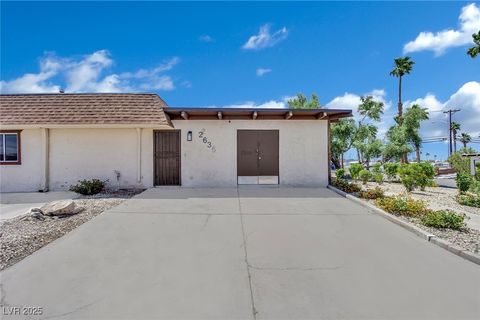
Active
$350,000
2
bds
|
2
ba
|
2,040
sqft
|
built
1971
2635 Heritage Ct, Las Vegas, NV 89121
$-540
Cash flow
-8.0%
Cash-on-Cash Return
4.4%
Cap rate
0.6%
Rent to Value Ratio
Active
$240,000
2
bds
|
2
ba
|
1,016
sqft
|
built
1997
350 S Durango Dr, Las Vegas, NV 89145
$-565
Cash flow
-12.3%
Cash-on-Cash Return
3.4%
Cap rate
0.6%
Rent to Value Ratio