Las Vegas, NV Investment Properties for Sale
Browse homes for sale and investment properties in Las Vegas, NV. Refine your search by price, property type, or more.
Best cash flowing properties in Las Vegas, NV

Active
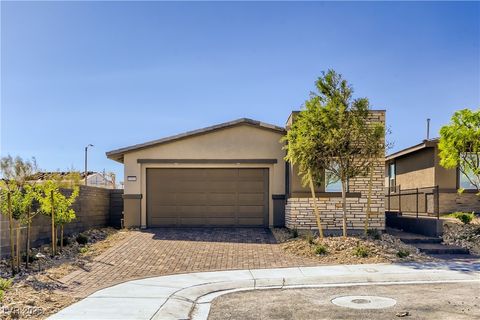
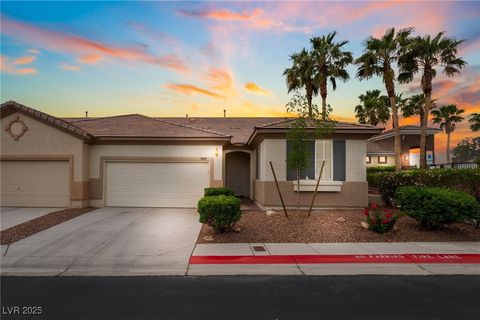
$535,000
4
bds
|
3
ba
|
2,103
sqft
|
built
1962
1564 Vegas Valley Dr, Las Vegas, NV 89169
$-199
Cash flow
-1.9%
Cash-on-Cash Return
5.2%
Cap rate
0.7%
Rent to Value Ratio
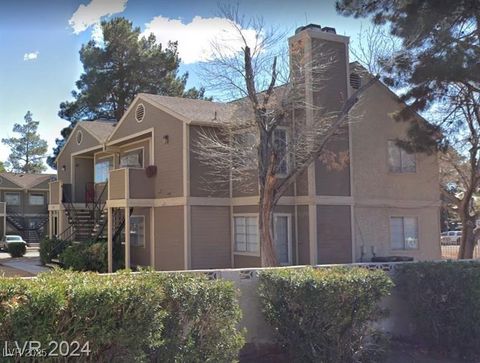
Active
$219,000
2
bds
|
2
ba
|
1,002
sqft
|
built
1992
7100 Pirates Cove Rd, Las Vegas, NV 89145
$-242
Cash flow
-5.8%
Cash-on-Cash Return
4.4%
Cap rate
0.7%
Rent to Value Ratio
6,294 out of 6,429 properties for sale in Las Vegas, NV
Limited Results Shown
Create a free account, or log in to reveal all property listings and enjoy the complete experience.
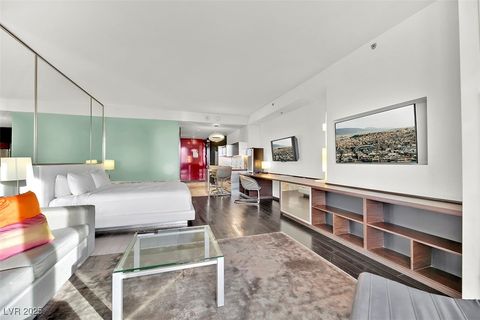
Active
$389,888
1
bds
|
2
ba
|
874
sqft
|
built
2006
125 E Harmon Ave, Las Vegas, NV 89109
$-2,217
Cash flow
-29.7%
Cash-on-Cash Return
-1.1%
Cap rate
0.6%
Rent to Value Ratio
Active
$200,000
2
bds
|
1
ba
|
792
sqft
|
built
1972
1553 Dorothy Ave, Las Vegas, NV 89119
$-438
Cash flow
-11.4%
Cash-on-Cash Return
3.0%
Cap rate
0.6%
Rent to Value Ratio
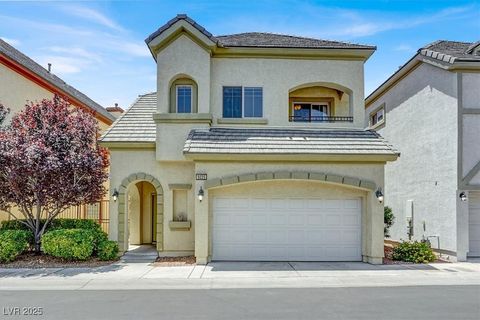
Active
$530,000
4
bds
|
3
ba
|
2,125
sqft
|
built
2003
189 Paxon Hollow Ct, Las Vegas, NV 89148
$-1,427
Cash flow
-14.0%
Cash-on-Cash Return
2.4%
Cap rate
0.4%
Rent to Value Ratio
Active
$339,900
3
bds
|
3
ba
|
1,329
sqft
|
built
2023
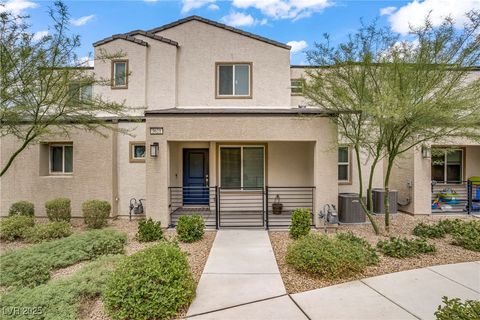
3621 Arcadian Sea St, Las Vegas, NV 89106
$-513
Cash flow
-7.9%
Cash-on-Cash Return
3.9%
Cap rate
0.6%
Rent to Value Ratio

Active
$575,000
4
bds
|
2
ba
|
1,959
sqft
|
built
2007
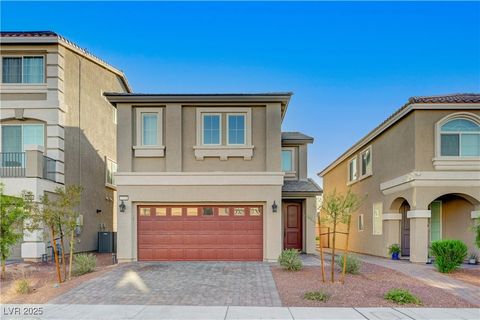
10311 Slope Ridge St, Las Vegas, NV 89131
$-1,073
Cash flow
-9.7%
Cash-on-Cash Return
3.4%
Cap rate
0.5%
Rent to Value Ratio
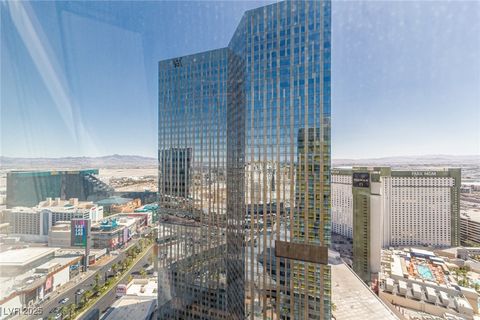
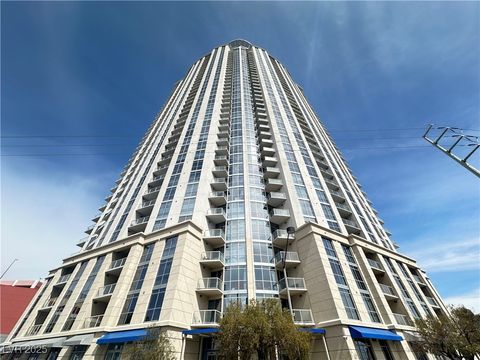
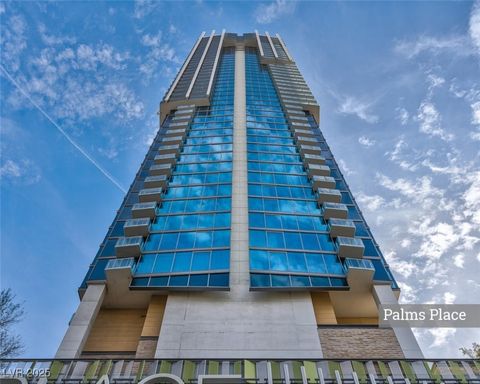
Active
$469,000
1
bds
|
1
ba
|
716
sqft
|
built
2007
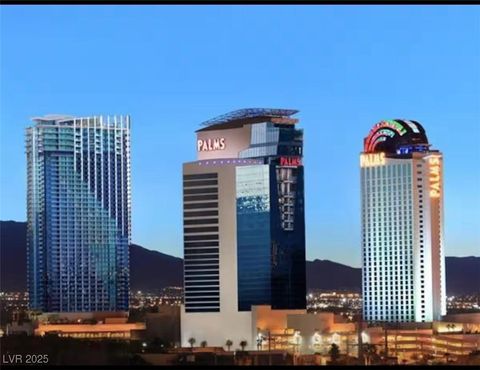
3722 Las Vegas Blvd S, Las Vegas, NV 89158
$-1,477
Cash flow
-16.4%
Cash-on-Cash Return
1.9%
Cap rate
0.6%
Rent to Value Ratio
Active
$555,000
8
bds
|
0
ba
|
3,112
sqft
|
built
1984
2705 Jennydiane Dr, Las Vegas, NV 89121
$-1,789
Cash flow
-16.8%
Cash-on-Cash Return
1.8%
Cap rate
0.3%
Rent to Value Ratio
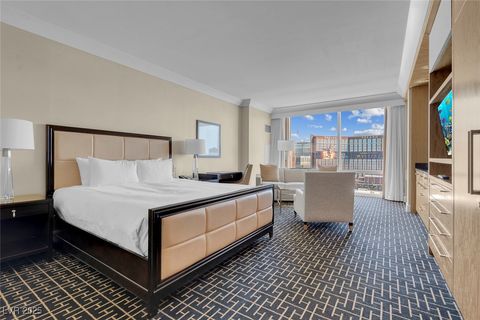
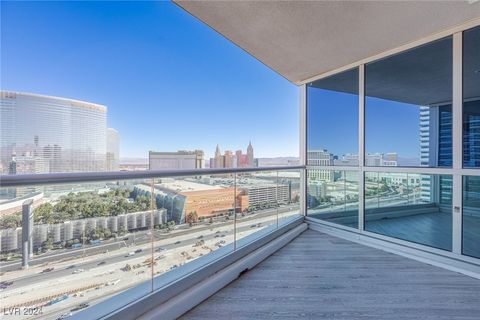
Active
$335,000
1
bds
|
1
ba
|
534
sqft
|
built
2006
2000 N Fashion Show Dr, Las Vegas, NV 89109
$-1,035
Cash flow
-16.1%
Cash-on-Cash Return
2.0%
Cap rate
0.6%
Rent to Value Ratio
Active
$275,000
1
bds
|
1
ba
|
615
sqft
|
built
2006
4381 W Flamingo Rd, Las Vegas, NV 89103
$-1,202
Cash flow
-22.8%
Cash-on-Cash Return
0.4%
Cap rate
0.6%
Rent to Value Ratio
Active
$599,999
5
bds
|
4
ba
|
3,030
sqft
|
built
2003
5005 Wild Thyme Ave, Las Vegas, NV 89131
$-824
Cash flow
-7.2%
Cash-on-Cash Return
4.0%
Cap rate
0.6%
Rent to Value Ratio
Active
$3,999,899
5
bds
|
7
ba
|
5,981
sqft
|
built
1999
9408 Players Canyon Ct, Las Vegas, NV 89144
$-12,914
Cash flow
-16.8%
Cash-on-Cash Return
1.8%
Cap rate
0.3%
Rent to Value Ratio
Active
$995,000
5
bds
|
4
ba
|
3,433
sqft
|
built
2001
105 Chateau Whistler Ct, Las Vegas, NV 89148
$-2,724
Cash flow
-14.3%
Cash-on-Cash Return
2.4%
Cap rate
0.4%
Rent to Value Ratio
Active
$595,000
4
bds
|
3
ba
|
1,863
sqft
|
built
2005
1013 Brinkman St, Las Vegas, NV 89138
$-1,462
Cash flow
-12.8%
Cash-on-Cash Return
2.7%
Cap rate
0.4%
Rent to Value Ratio
Active
$695,194
3
bds
|
3
ba
|
2,151
sqft
|
built
2018
4523 Herbert River Ave, Las Vegas, NV 89141
$-1,870
Cash flow
-14.0%
Cash-on-Cash Return
2.5%
Cap rate
0.4%
Rent to Value Ratio
Active
$1,299,000
4
bds
|
4
ba
|
3,720
sqft
|
built
2001
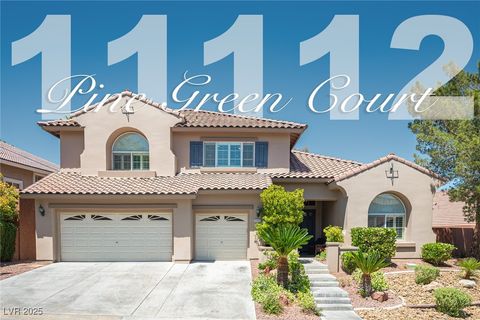
11112 Pine Greens Ct, Las Vegas, NV 89144
$-3,295
Cash flow
-13.2%
Cash-on-Cash Return
2.6%
Cap rate
0.4%
Rent to Value Ratio
Active
$519,000
4
bds
|
3
ba
|
1,860
sqft
|
built
2021
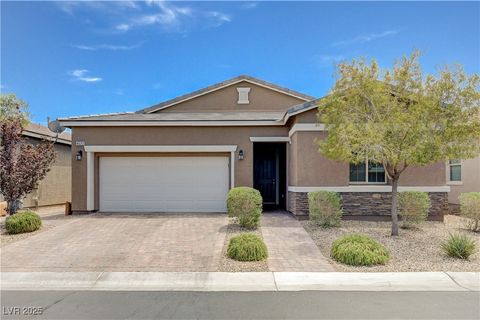
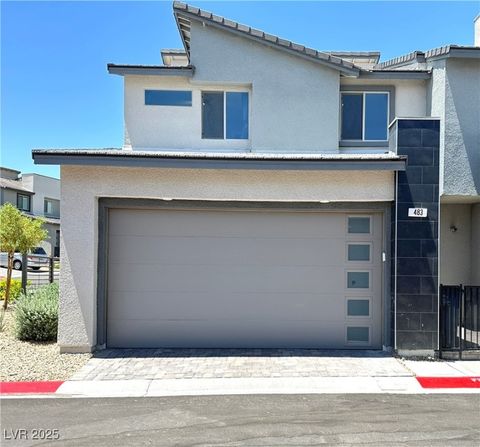
483 Fairview Hills St, Las Vegas, NV 89138
$-960
Cash flow
-9.7%
Cash-on-Cash Return
3.5%
Cap rate
0.5%
Rent to Value Ratio
Active
$380,000
3
bds
|
2
ba
|
1,175
sqft
|
built
1993
2832 Sing Song Way, Las Vegas, NV 89106
$-642
Cash flow
-8.8%
Cash-on-Cash Return
3.7%
Cap rate
0.5%
Rent to Value Ratio
Active
$299,000
3
bds
|
3
ba
|
1,448
sqft
|
built
2005
3905 Sweet Pine St, Las Vegas, NV 89108
$-511
Cash flow
-8.9%
Cash-on-Cash Return
3.6%
Cap rate
0.6%
Rent to Value Ratio
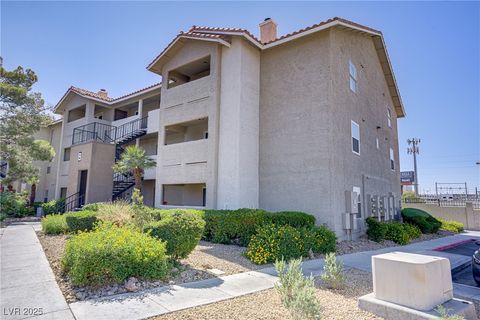
Active
$224,800
2
bds
|
2
ba
|
1,074
sqft
|
built
1989
3151 Soaring Gulls Dr, Las Vegas, NV 89128
$-571
Cash flow
-13.3%
Cash-on-Cash Return
2.6%
Cap rate
0.6%
Rent to Value Ratio
Active
$879,990
4
bds
|
4
ba
|
2,387
sqft
|
built
2023
11695 Gentle Birdsong Ave, Las Vegas, NV 89138
$-2,664
Cash flow
-15.8%
Cash-on-Cash Return
2.0%
Cap rate
0.4%
Rent to Value Ratio
Active
$509,990
4
bds
|
3
ba
|
2,161
sqft
|
built
2022
7775 Tyrell Peaks St, Las Vegas, NV 89139
$-1,235
Cash flow
-12.6%
Cash-on-Cash Return
2.8%
Cap rate
0.5%
Rent to Value Ratio
Active
$219,000
2
bds
|
2
ba
|
1,002
sqft
|
built
1992
7100 Pirates Cove Rd, Las Vegas, NV 89145
$-242
Cash flow
-5.8%
Cash-on-Cash Return
4.4%
Cap rate
0.7%
Rent to Value Ratio

Active
$3,249,900
4
bds
|
6
ba
|
4,826
sqft
|
built
2006
9103 Alta Dr, Las Vegas, NV 89145
$-14,208
Cash flow
-22.8%
Cash-on-Cash Return
0.4%
Cap rate
0.3%
Rent to Value Ratio
Active
$339,000
1
bds
|
1
ba
|
1,090
sqft
|
built
2006
200 W Sahara Ave, Las Vegas, NV 89102
$-1,009
Cash flow
-15.5%
Cash-on-Cash Return
2.1%
Cap rate
0.7%
Rent to Value Ratio
Active
$318,000
1
bds
|
1
ba
|
534
sqft
|
built
2006
2000 N Fashion Show Dr, Las Vegas, NV 89109
$-985
Cash flow
-16.2%
Cash-on-Cash Return
2.0%
Cap rate
0.6%
Rent to Value Ratio

Active
$1,144,528
5
bds
|
5
ba
|
4,476
sqft
|
built
2002
4804 Laurentia Ave, Las Vegas, NV 89141
$-3,302
Cash flow
-15.1%
Cash-on-Cash Return
2.2%
Cap rate
0.3%
Rent to Value Ratio
Active
$384,900
2
bds
|
2
ba
|
902
sqft
|
built
1990
4200 S Valley View Blvd, Las Vegas, NV 89103
$-1,124
Cash flow
-15.2%
Cash-on-Cash Return
2.2%
Cap rate
0.4%
Rent to Value Ratio
Active
$535,000
4
bds
|
3
ba
|
2,103
sqft
|
built
1962
1564 Vegas Valley Dr, Las Vegas, NV 89169
$-199
Cash flow
-1.9%
Cash-on-Cash Return
5.2%
Cap rate
0.7%
Rent to Value Ratio
Active
$285,000
1
bds
|
1
ba
|
615
sqft
|
built
2006
4381 W Flamingo Rd, Las Vegas, NV 89103
$-1,011
Cash flow
-18.5%
Cash-on-Cash Return
1.4%
Cap rate
0.7%
Rent to Value Ratio
Active
$254,888
1
bds
|
1
ba
|
636
sqft
|
built
2006
4381 W Flamingo Rd, Las Vegas, NV 89103
$-841
Cash flow
-17.2%
Cash-on-Cash Return
1.7%
Cap rate
0.8%
Rent to Value Ratio
Active
$740,000
3
bds
|
3
ba
|
2,527
sqft
|
built
2019
6421 Winecup St, Las Vegas, NV 89149
$-2,005
Cash flow
-14.1%
Cash-on-Cash Return
2.4%
Cap rate
0.4%
Rent to Value Ratio
Active
$894,700
2
bds
|
3
ba
|
2,709
sqft
|
built
1983
2851 Queens Courtyard Dr, Las Vegas, NV 89109
$-1,543
Cash flow
-9.0%
Cash-on-Cash Return
3.6%
Cap rate
0.5%
Rent to Value Ratio
Active
$508,200
3
bds
|
3
ba
|
1,764
sqft
|
built
2022
9351 Aria Ridge Ave, Las Vegas, NV 89143
$-1,392
Cash flow
-14.3%
Cash-on-Cash Return
2.4%
Cap rate
0.4%
Rent to Value Ratio
Active
$610,000
3
bds
|
3
ba
|
2,674
sqft
|
built
2007
9225 Dalmahoy Pl, Las Vegas, NV 89145
$-1,769
Cash flow
-15.1%
Cash-on-Cash Return
2.2%
Cap rate
0.4%
Rent to Value Ratio
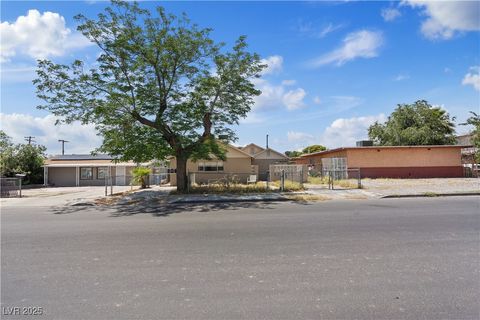
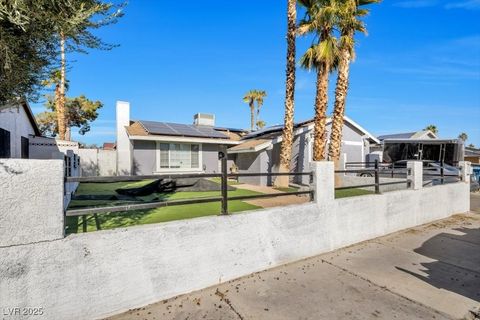
Active
$390,000
4
bds
|
2
ba
|
2,493
sqft
|
built
1948
2528 Sunrise Ave, Las Vegas, NV 89101
$-1,044
Cash flow
-14.0%
Cash-on-Cash Return
2.5%
Cap rate
0.4%
Rent to Value Ratio
Active
$429,500
3
bds
|
2
ba
|
1,347
sqft
|
built
1988
9600 Pacific View Dr, Las Vegas, NV 89117
$-854
Cash flow
-10.4%
Cash-on-Cash Return
3.3%
Cap rate
0.5%
Rent to Value Ratio
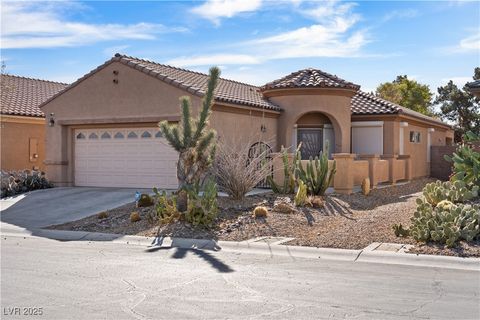
Active
$414,999
3
bds
|
2
ba
|
1,747
sqft
|
built
2009
6151 Moonlight Sonata Ave, Las Vegas, NV 89122
$-640
Cash flow
-8.0%
Cash-on-Cash Return
3.8%
Cap rate
0.6%
Rent to Value Ratio
Active
$424,500
2
bds
|
2
ba
|
1,435
sqft
|
built
2003
9289 Mandeville Bay Ave, Las Vegas, NV 89148
$-970
Cash flow
-11.9%
Cash-on-Cash Return
2.9%
Cap rate
0.5%
Rent to Value Ratio
Active
$440,000
3
bds
|
2
ba
|
1,799
sqft
|
built
1972
7026 Westpark Ct, Las Vegas, NV 89147
$-464
Cash flow
-5.5%
Cash-on-Cash Return
4.4%
Cap rate
0.6%
Rent to Value Ratio
Active
$585,000
2
bds
|
2
ba
|
1,126
sqft
|
built
2005
4575 Dean Martin Dr, Las Vegas, NV 89103
$-1,494
Cash flow
-13.3%
Cash-on-Cash Return
2.6%
Cap rate
0.6%
Rent to Value Ratio