Las Vegas, NV Investment Properties for Sale
Browse homes for sale and investment properties in Las Vegas, NV. Refine your search by price, property type, or more.
Best cash flowing properties in Las Vegas, NV

Active
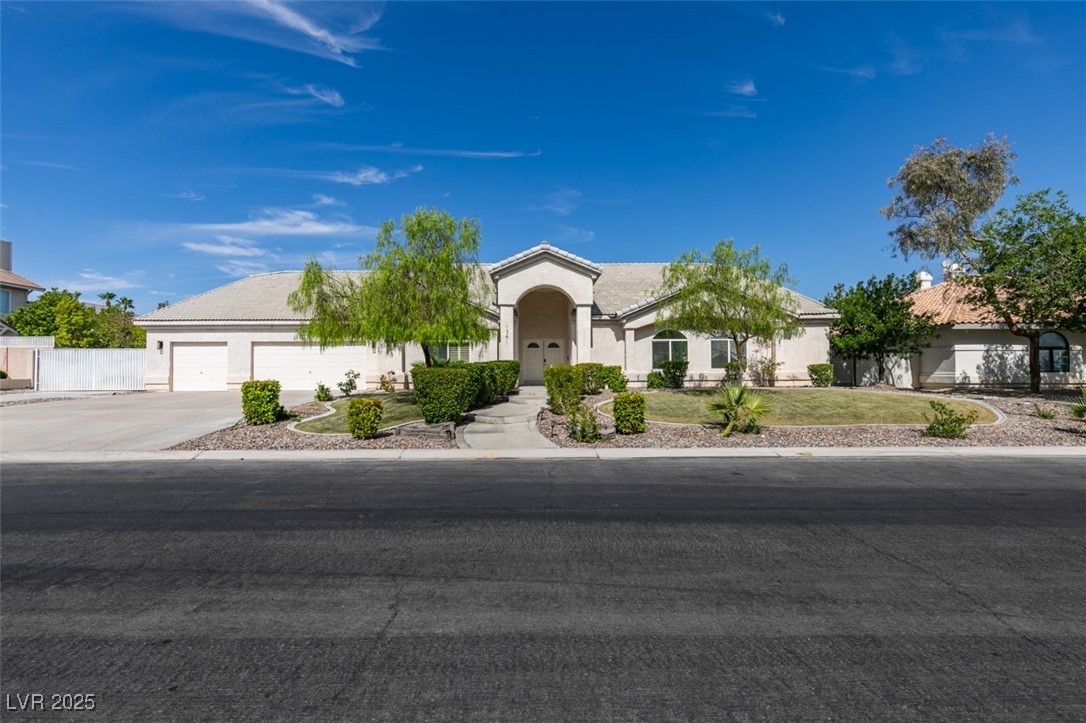
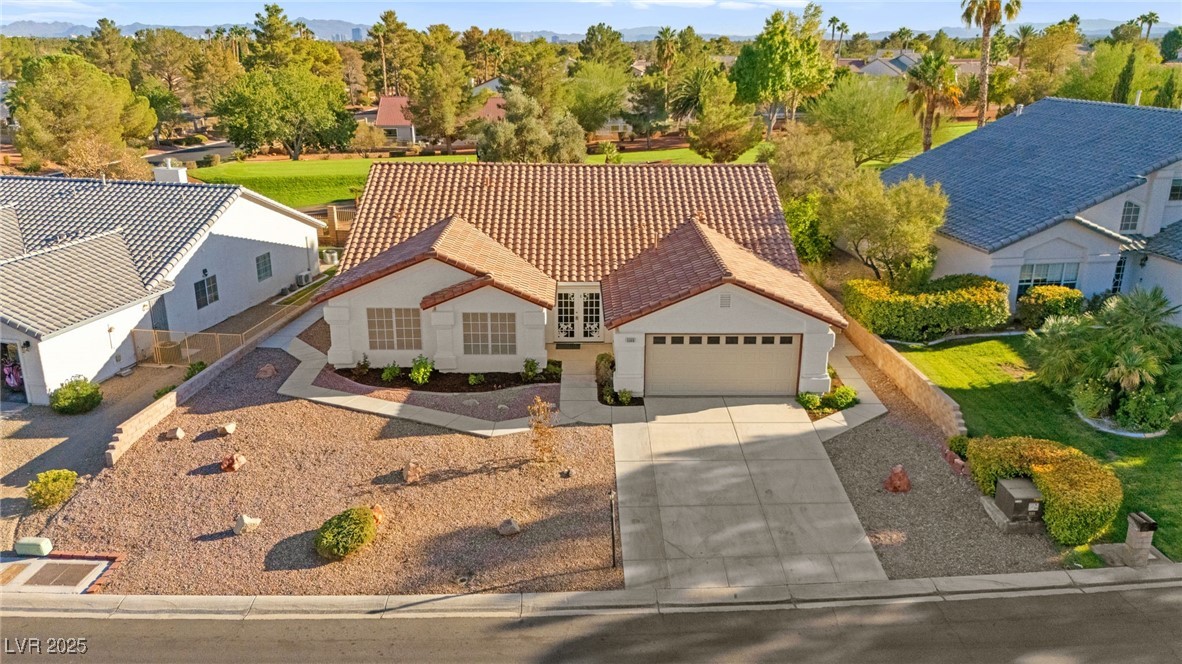
$255,000
3
bds
|
2
ba
|
1,109
sqft
|
built
1989
3151 Soaring Gulls Dr, Las Vegas, NV 89128
$-787
Cash flow
-16.1%
Cash-on-Cash Return
2.6%
Cap rate
0.6%
Rent to Value Ratio
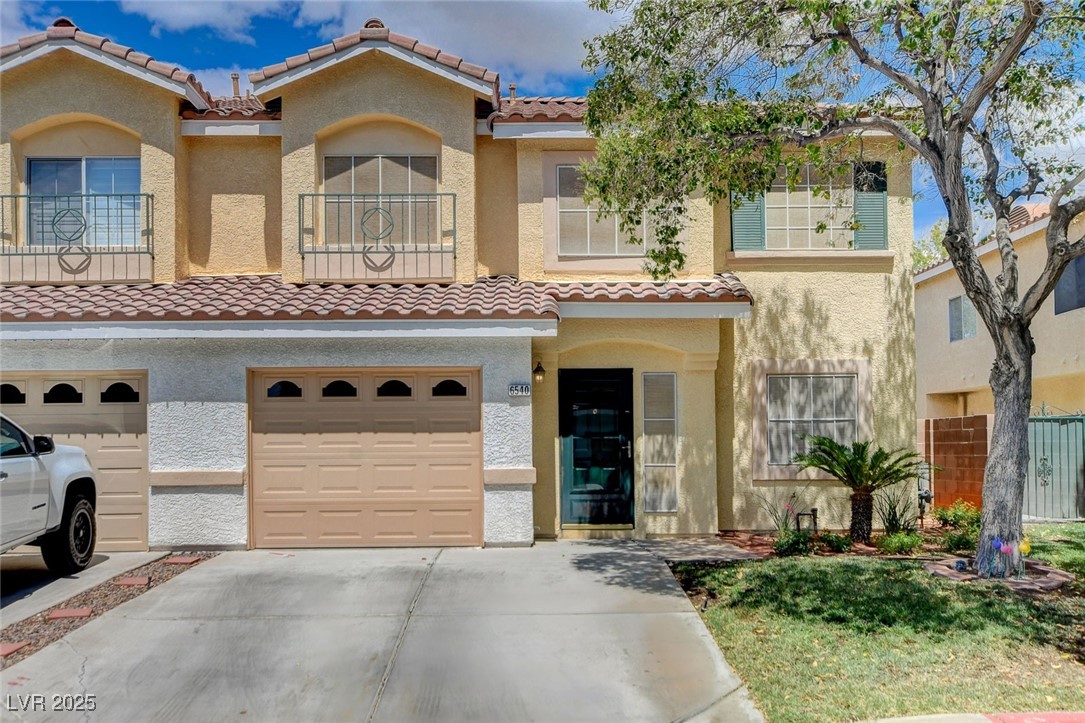
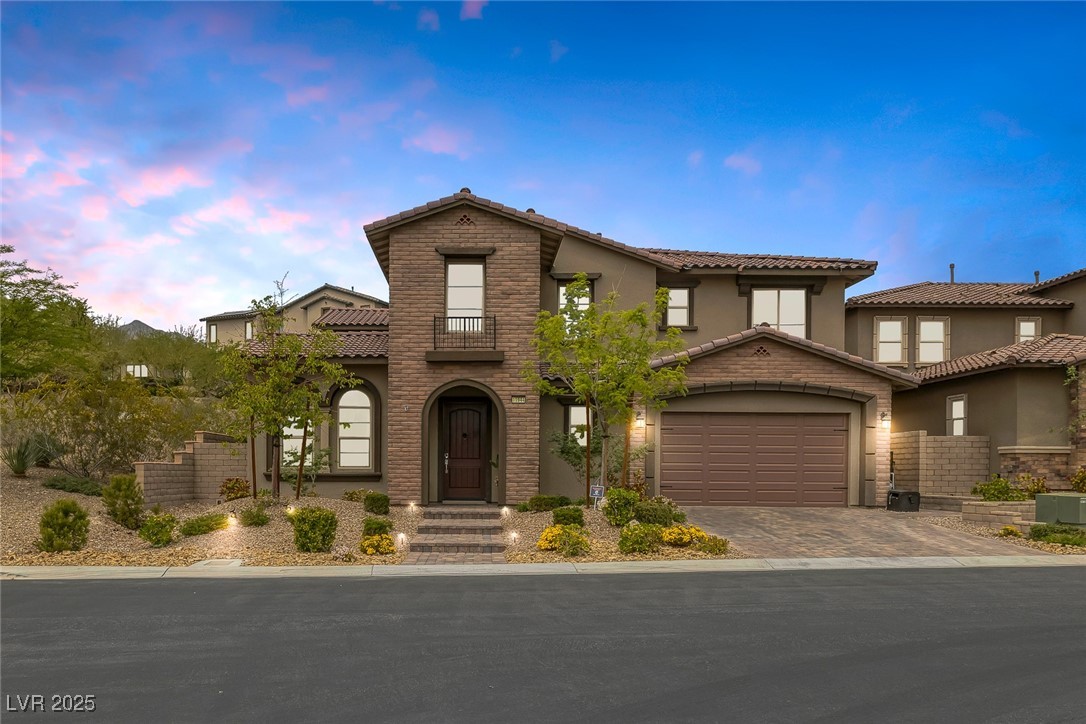
Active
$335,000
2
bds
|
3
ba
|
1,265
sqft
|
built
1996
6540 Angel Mountain Ave, Las Vegas, NV 89130
$-886
Cash flow
-13.8%
Cash-on-Cash Return
3.1%
Cap rate
0.5%
Rent to Value Ratio
5,456 out of 5,583 properties for sale in Las Vegas, NV
Limited Results Shown
Create a free account, or log in to reveal all property listings and enjoy the complete experience.
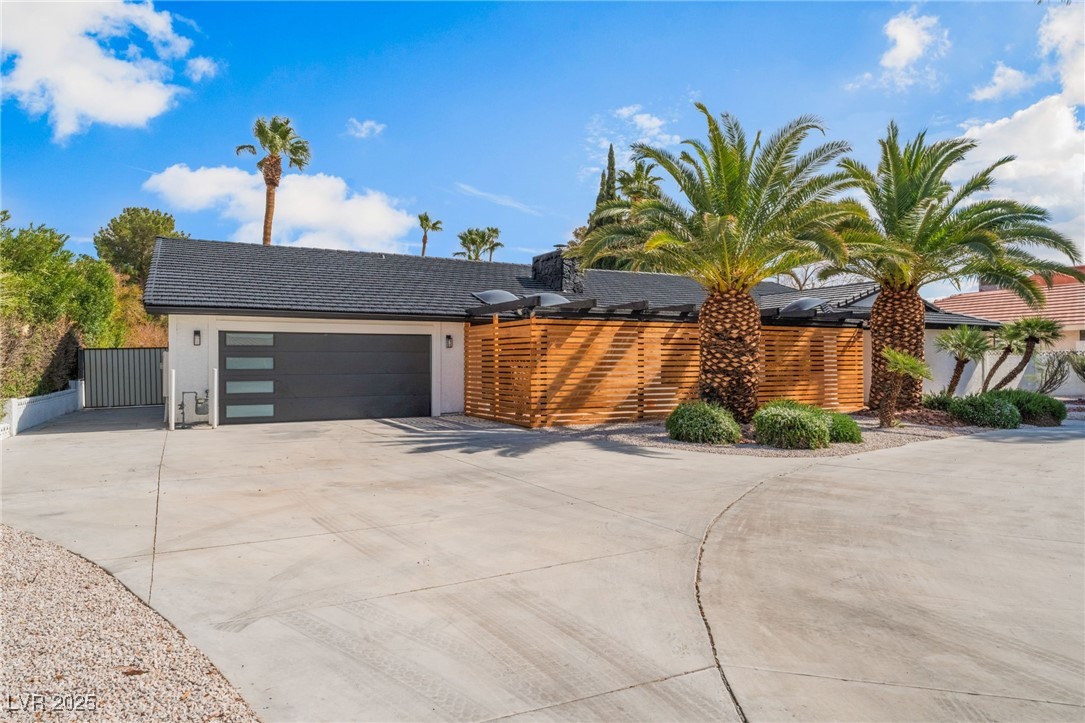
Active
$2,139,777
4
bds
|
3
ba
|
2,935
sqft
|
built
2016
294 Besame Ct, Las Vegas, NV 89138
$-6,868
Cash flow
-16.7%
Cash-on-Cash Return
2.4%
Cap rate
0.4%
Rent to Value Ratio
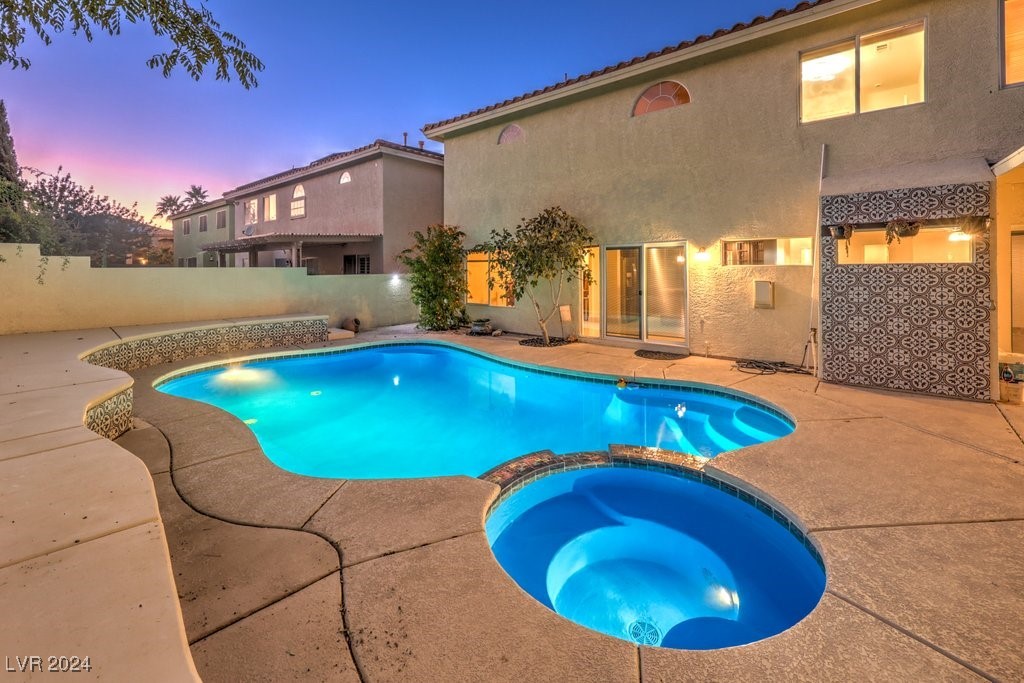
Active
$1,089,000
5
bds
|
3
ba
|
2,227
sqft
|
built
2024
2246 Bird Of Prey St, Las Vegas, NV 89138
$-3,887
Cash flow
-18.6%
Cash-on-Cash Return
2.0%
Cap rate
0.3%
Rent to Value Ratio

Active
$2,985,000
3
bds
|
5
ba
|
6,608
sqft
|
built
1990
72 Innisbrook Ave, Las Vegas, NV 89113
$-12,513
Cash flow
-21.9%
Cash-on-Cash Return
1.3%
Cap rate
0.2%
Rent to Value Ratio
Active
$1,199,999
5
bds
|
5
ba
|
3,387
sqft
|
built
2006
884 Loma Bonita Pl, Las Vegas, NV 89138
$-3,067
Cash flow
-13.3%
Cash-on-Cash Return
3.2%
Cap rate
0.5%
Rent to Value Ratio
Active
$1,800,000
5
bds
|
5
ba
|
4,503
sqft
|
built
1977
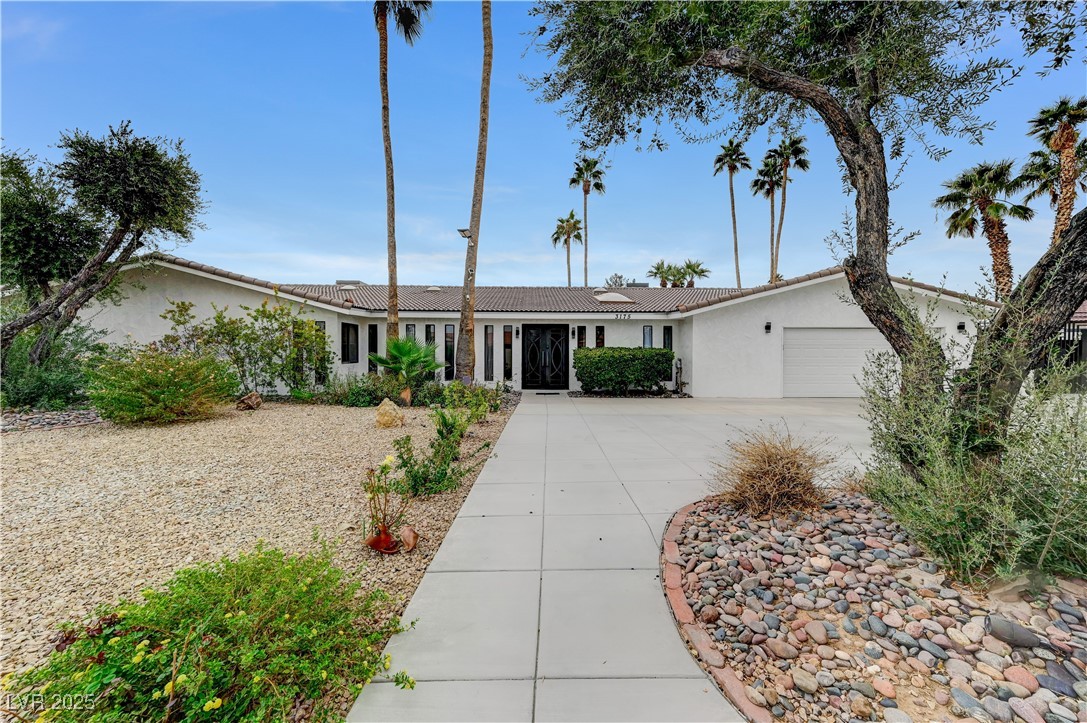
3175 S Torrey Pines Dr, Las Vegas, NV 89146
$-7,174
Cash flow
-20.8%
Cash-on-Cash Return
1.5%
Cap rate
0.2%
Rent to Value Ratio
Active
$1,347,000
4
bds
|
3
ba
|
3,221
sqft
|
built
2012
12122 High Country Ln, Las Vegas, NV 89138
$-4,473
Cash flow
-17.3%
Cash-on-Cash Return
2.3%
Cap rate
0.4%
Rent to Value Ratio
Active
$1,725,000
4
bds
|
4
ba
|
3,343
sqft
|
built
2000
2933 Red Springs Dr, Las Vegas, NV 89135
$-6,720
Cash flow
-20.3%
Cash-on-Cash Return
1.6%
Cap rate
0.3%
Rent to Value Ratio
Active
$2,900,000
4
bds
|
6
ba
|
6,398
sqft
|
built
2015
5790 Aspen Falls Cir, Las Vegas, NV 89149
$-8,819
Cash flow
-15.9%
Cash-on-Cash Return
2.6%
Cap rate
0.4%
Rent to Value Ratio
Active
$3,950,000
5
bds
|
6
ba
|
4,888
sqft
|
built
2015
29 Owl Ridge Ct, Las Vegas, NV 89135
$-14,977
Cash flow
-19.8%
Cash-on-Cash Return
1.7%
Cap rate
0.3%
Rent to Value Ratio
Active
$1,105,000
3
bds
|
3
ba
|
2,373
sqft
|
built
1995
5625 W Agate Ave, Las Vegas, NV 89139
$-3,277
Cash flow
-15.5%
Cash-on-Cash Return
2.7%
Cap rate
0.4%
Rent to Value Ratio
Active
$999,000
5
bds
|
3
ba
|
4,448
sqft
|
built
2006
8070 Pavarotti Ave, Las Vegas, NV 89178
$-3,277
Cash flow
-17.1%
Cash-on-Cash Return
2.3%
Cap rate
0.4%
Rent to Value Ratio
Active
$4,750,000
6
bds
|
5
ba
|
6,928
sqft
|
built
2017
4160 W Ford Ave, Las Vegas, NV 89139
$-18,421
Cash flow
-20.2%
Cash-on-Cash Return
1.6%
Cap rate
0.2%
Rent to Value Ratio
Active
$1,799,900
6
bds
|
5
ba
|
4,273
sqft
|
built
2022
12155 Sage Thunder Ave, Las Vegas, NV 89138
$-6,604
Cash flow
-19.1%
Cash-on-Cash Return
1.9%
Cap rate
0.3%
Rent to Value Ratio
Active
$849,900
3
bds
|
2
ba
|
1,902
sqft
|
built
2013
5564 Bethany Bend Dr, Las Vegas, NV 89135
$-3,387
Cash flow
-20.8%
Cash-on-Cash Return
1.5%
Cap rate
0.3%
Rent to Value Ratio
Active
$3,999,999
4
bds
|
7
ba
|
6,670
sqft
|
built
1996
4927 Spanish Heights Dr, Las Vegas, NV 89148
$-15,495
Cash flow
-20.2%
Cash-on-Cash Return
1.6%
Cap rate
0.3%
Rent to Value Ratio
Active
$7,950,000
4
bds
|
5
ba
|
5,184
sqft
|
built
2006
2700 Las Vegas Blvd S, Las Vegas, NV 89109
$-41,235
Cash flow
-27.1%
Cash-on-Cash Return
0.1%
Cap rate
0.1%
Rent to Value Ratio
Active
$1,550,000
5
bds
|
3
ba
|
3,716
sqft
|
built
1978
3911 Kamden Way, Las Vegas, NV 89119
$-3,600
Cash flow
-12.1%
Cash-on-Cash Return
3.5%
Cap rate
0.4%
Rent to Value Ratio
Active
$2,625,000
3
bds
|
4
ba
|
3,255
sqft
|
built
2020
787 Laceleaf St, Las Vegas, NV 89138
$-9,417
Cash flow
-18.7%
Cash-on-Cash Return
2.0%
Cap rate
0.3%
Rent to Value Ratio
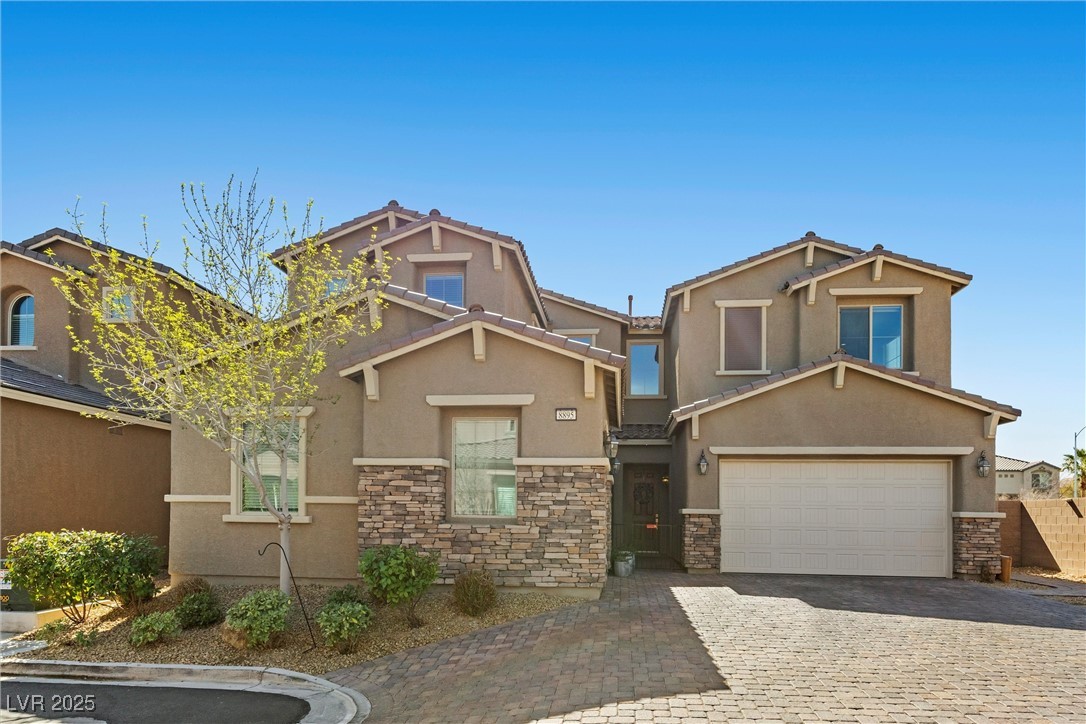
Active
$998,888
5
bds
|
5
ba
|
4,272
sqft
|
built
2018
8895 Dartmouth Grove Ave, Las Vegas, NV 89148
$-3,248
Cash flow
-17.0%
Cash-on-Cash Return
2.4%
Cap rate
0.4%
Rent to Value Ratio
Active
$1,688,000
4
bds
|
5
ba
|
5,536
sqft
|
built
1975
6419 Eldora Ave, Las Vegas, NV 89146
$-3,299
Cash flow
-10.2%
Cash-on-Cash Return
3.9%
Cap rate
0.5%
Rent to Value Ratio
Active
$1,199,000
5
bds
|
4
ba
|
4,386
sqft
|
built
1996
1341 Marina Del Rey Ct, Las Vegas, NV 89117
$-3,691
Cash flow
-16.1%
Cash-on-Cash Return
2.6%
Cap rate
0.4%
Rent to Value Ratio
Active
$1,599,000
4
bds
|
5
ba
|
4,250
sqft
|
built
2019
11944 Dolcemente Ln, Las Vegas, NV 89138
$-5,470
Cash flow
-17.8%
Cash-on-Cash Return
2.2%
Cap rate
0.4%
Rent to Value Ratio
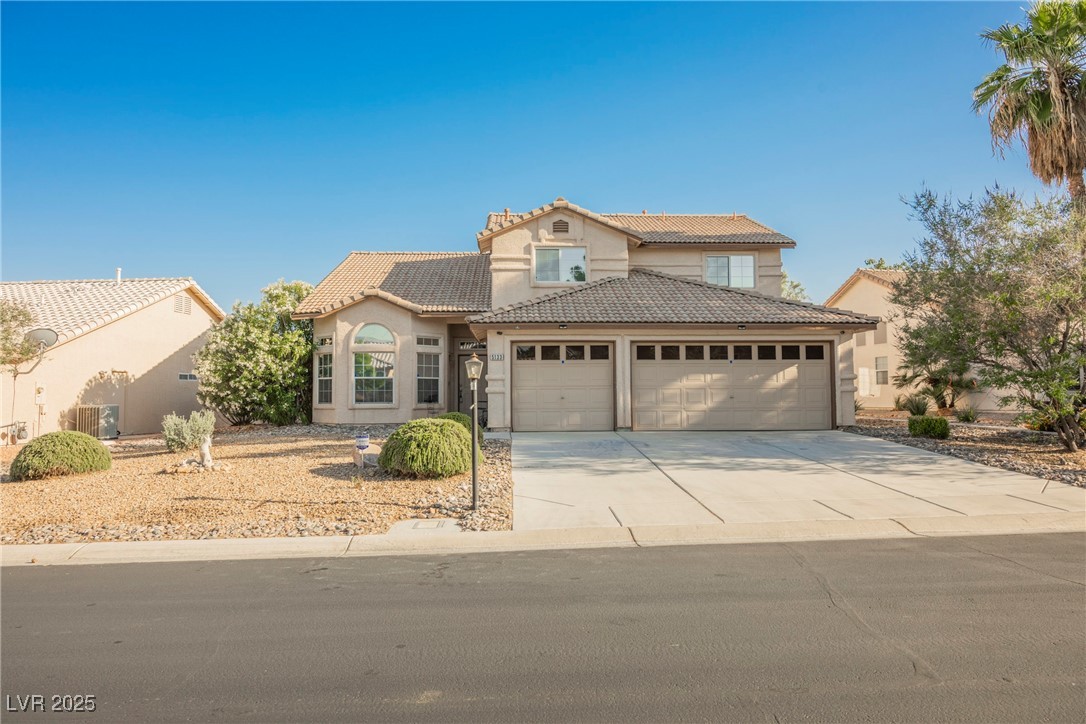
Pending
$1,100,000
4
bds
|
4
ba
|
3,298
sqft
|
built
1979
401 Lacy Ln, Las Vegas, NV 89107
$-3,062
Cash flow
-14.5%
Cash-on-Cash Return
2.9%
Cap rate
0.4%
Rent to Value Ratio
Active
$255,000
3
bds
|
2
ba
|
1,109
sqft
|
built
1989
3151 Soaring Gulls Dr, Las Vegas, NV 89128
$-787
Cash flow
-16.1%
Cash-on-Cash Return
2.6%
Cap rate
0.6%
Rent to Value Ratio
Active
$688,888
6
bds
|
3
ba
|
3,540
sqft
|
built
2003
527 Leap Frog Ave, Las Vegas, NV 89183
$-1,211
Cash flow
-9.2%
Cash-on-Cash Return
4.2%
Cap rate
0.6%
Rent to Value Ratio
Pending
$665,000
4
bds
|
3
ba
|
2,112
sqft
|
built
1995
1112 Caraway Ln, Las Vegas, NV 89144
$-1,882
Cash flow
-14.8%
Cash-on-Cash Return
2.9%
Cap rate
0.4%
Rent to Value Ratio
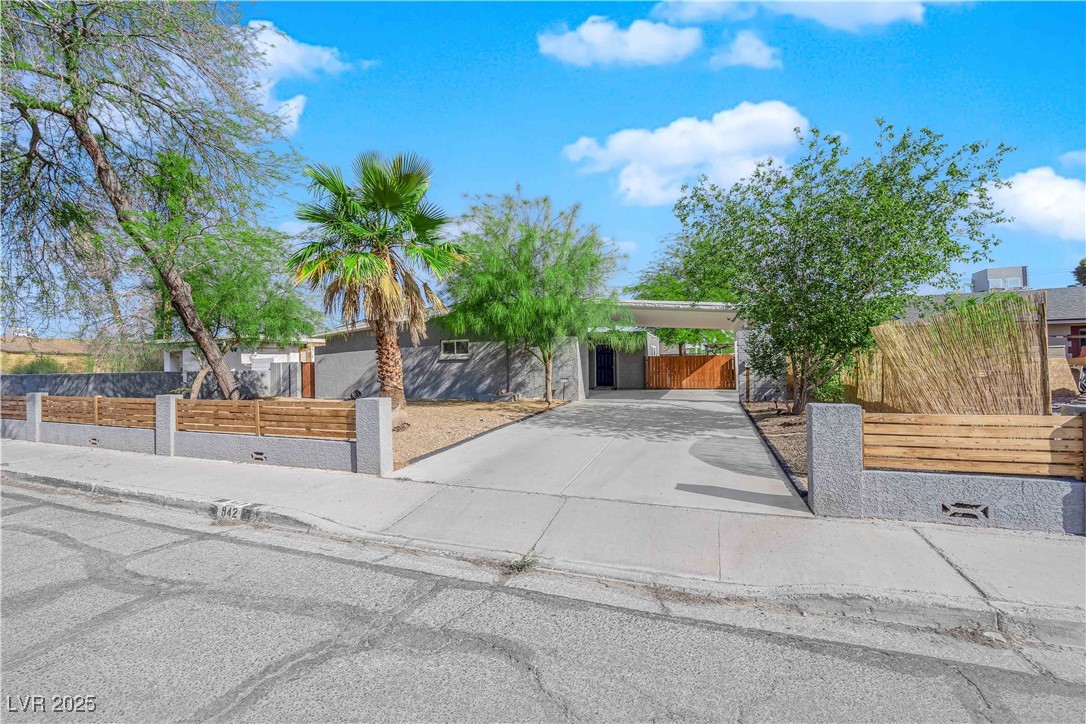
Active
$489,000
5
bds
|
3
ba
|
1,968
sqft
|
built
1963
942 Westminster Ave, Las Vegas, NV 89119
$-1,006
Cash flow
-10.7%
Cash-on-Cash Return
3.8%
Cap rate
0.5%
Rent to Value Ratio
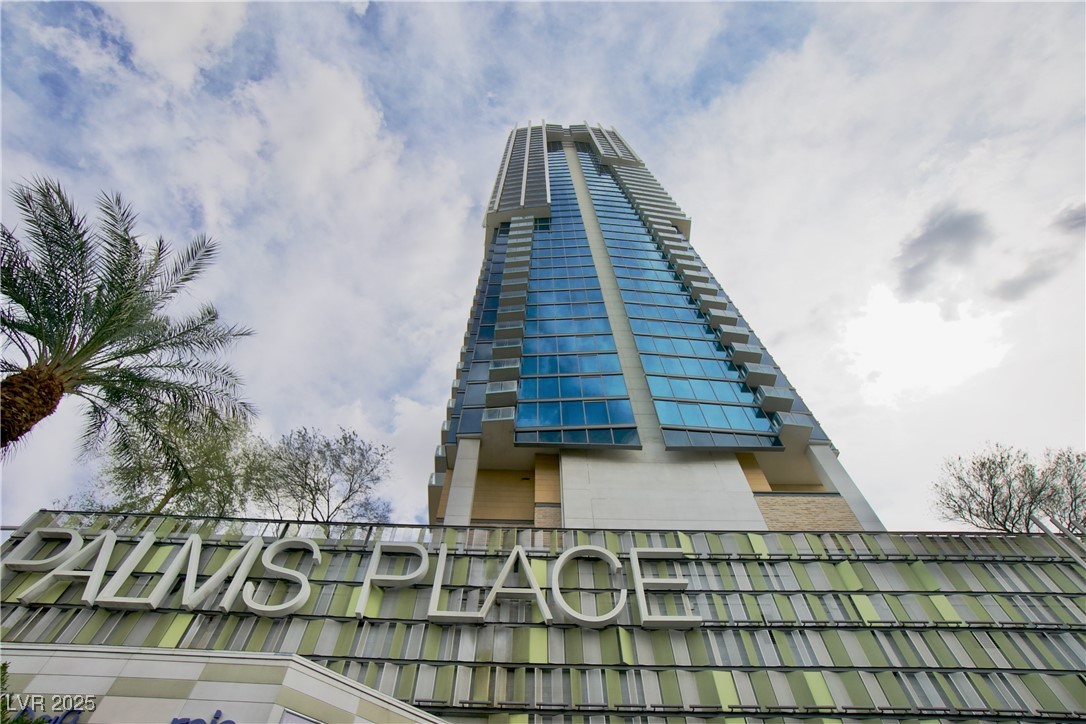
Active
$398,000
1
bds
|
1
ba
|
615
sqft
|
built
2006
4381 W Flamingo Rd, Las Vegas, NV 89103
$-1,462
Cash flow
-19.2%
Cash-on-Cash Return
1.9%
Cap rate
0.5%
Rent to Value Ratio
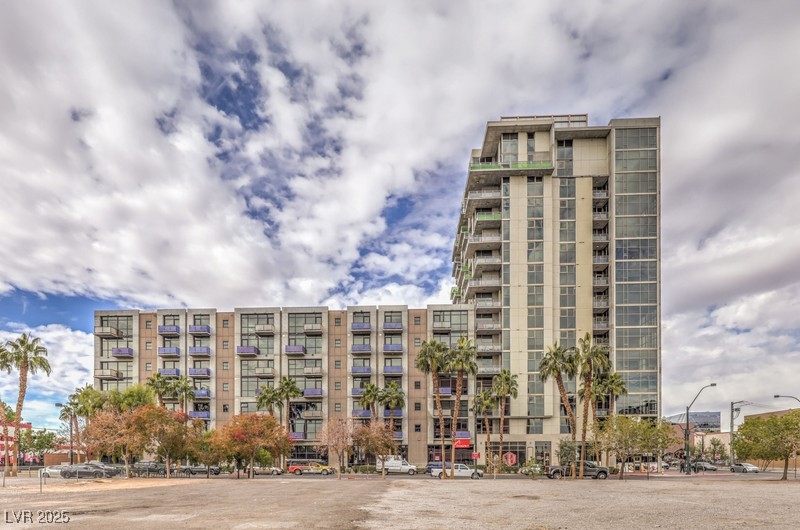
Active
$474,900
2
bds
|
2
ba
|
1,209
sqft
|
built
2008
353 E Bonneville Ave, Las Vegas, NV 89101
$-1,195
Cash flow
-13.1%
Cash-on-Cash Return
3.3%
Cap rate
0.7%
Rent to Value Ratio
Active
$710,000
4
bds
|
3
ba
|
2,986
sqft
|
built
1995
3749 Climbing Rose St, Las Vegas, NV 89147
$-1,472
Cash flow
-10.8%
Cash-on-Cash Return
3.8%
Cap rate
0.5%
Rent to Value Ratio
Active
$649,900
5
bds
|
4
ba
|
3,971
sqft
|
built
2016
9737 Toad Hollow St, Las Vegas, NV 89141
$-1,717
Cash flow
-13.8%
Cash-on-Cash Return
3.1%
Cap rate
0.5%
Rent to Value Ratio
Active
$639,000
4
bds
|
3
ba
|
3,090
sqft
|
built
2003
577 Leap Frog Ave, Las Vegas, NV 89183
$-1,463
Cash flow
-11.9%
Cash-on-Cash Return
3.5%
Cap rate
0.5%
Rent to Value Ratio
Active
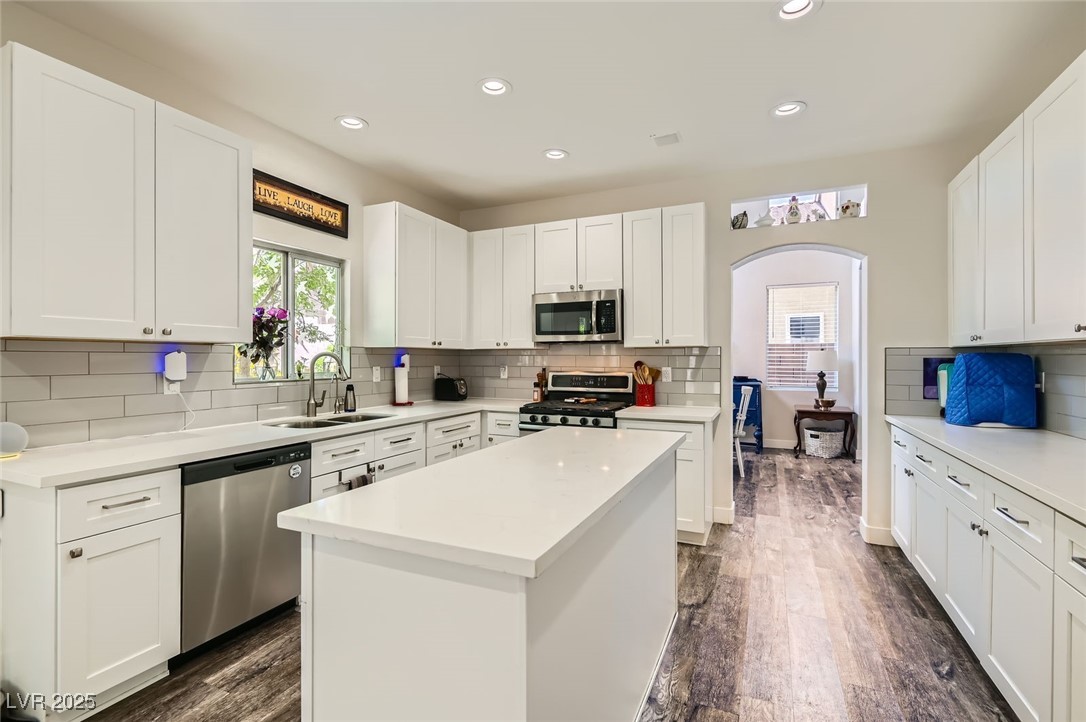
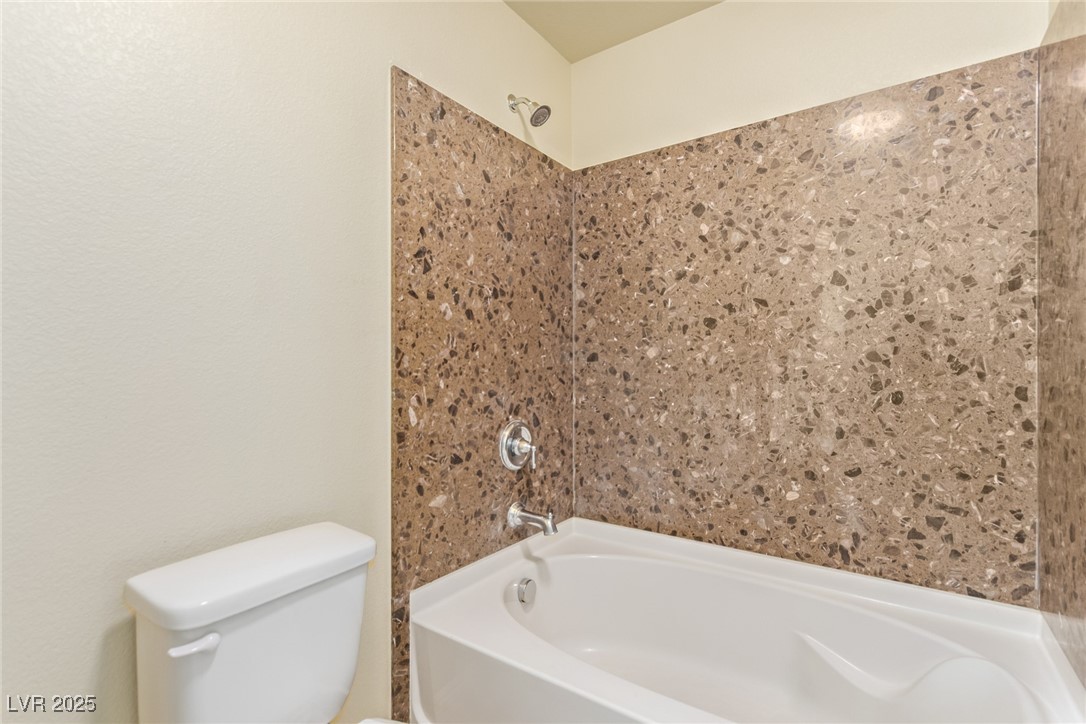
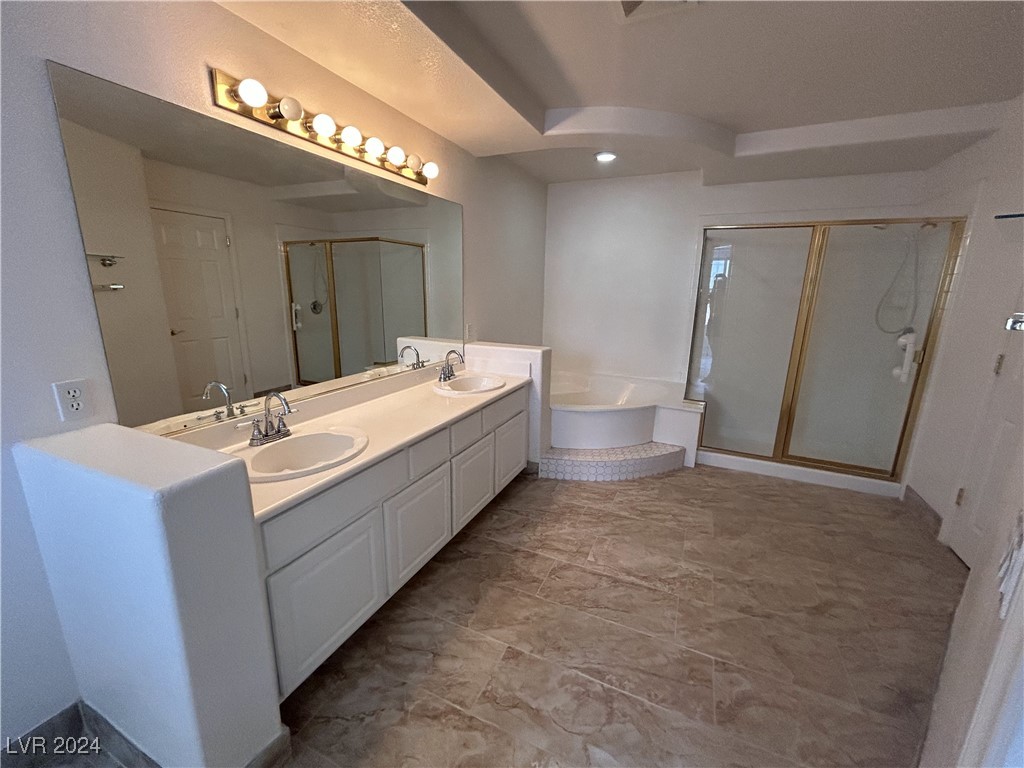
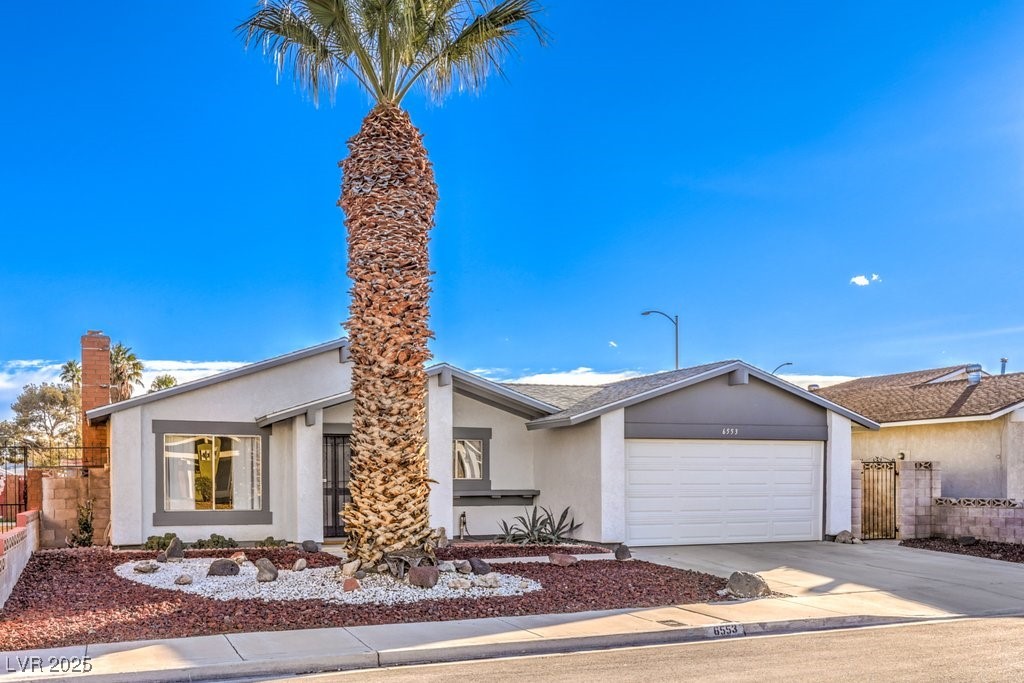
$440,000
3
bds
|
2
ba
|
1,232
sqft
|
built
1976
6553 Baywood Ave, Las Vegas, NV 89103
$-1,036
Cash flow
-12.3%
Cash-on-Cash Return
3.5%
Cap rate
0.5%
Rent to Value Ratio
Active
$735,000
4
bds
|
3
ba
|
2,405
sqft
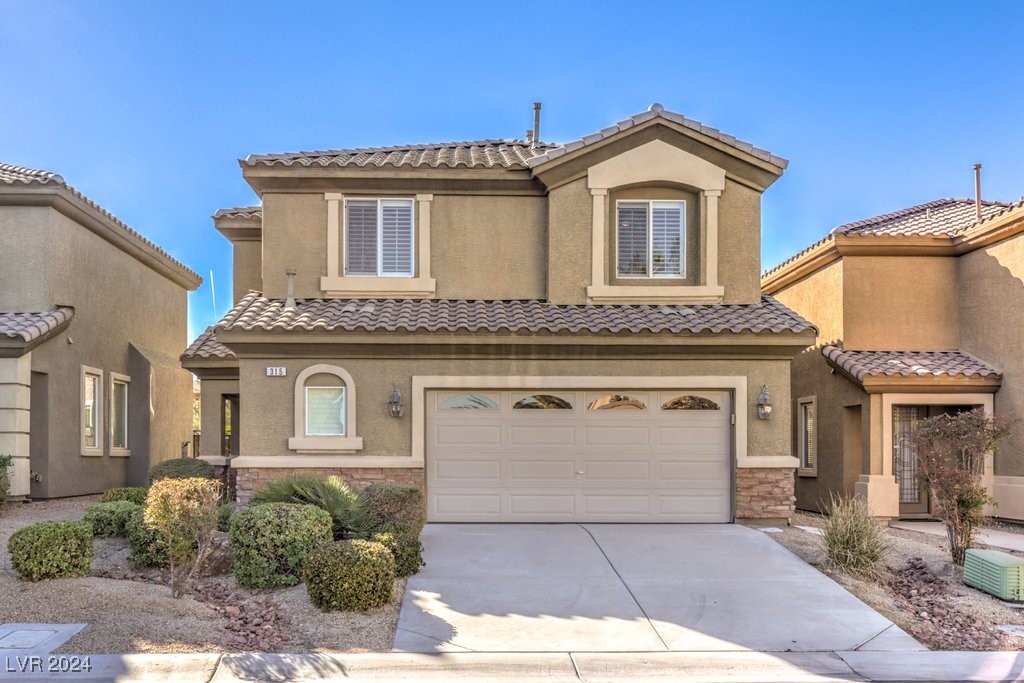
|
built
2006
315 Foster Springs Rd, Las Vegas, NV 89148
$-2,209
Cash flow
-15.7%
Cash-on-Cash Return
2.7%
Cap rate
0.4%
Rent to Value Ratio
Active
$526,000
4
bds
|
3
ba
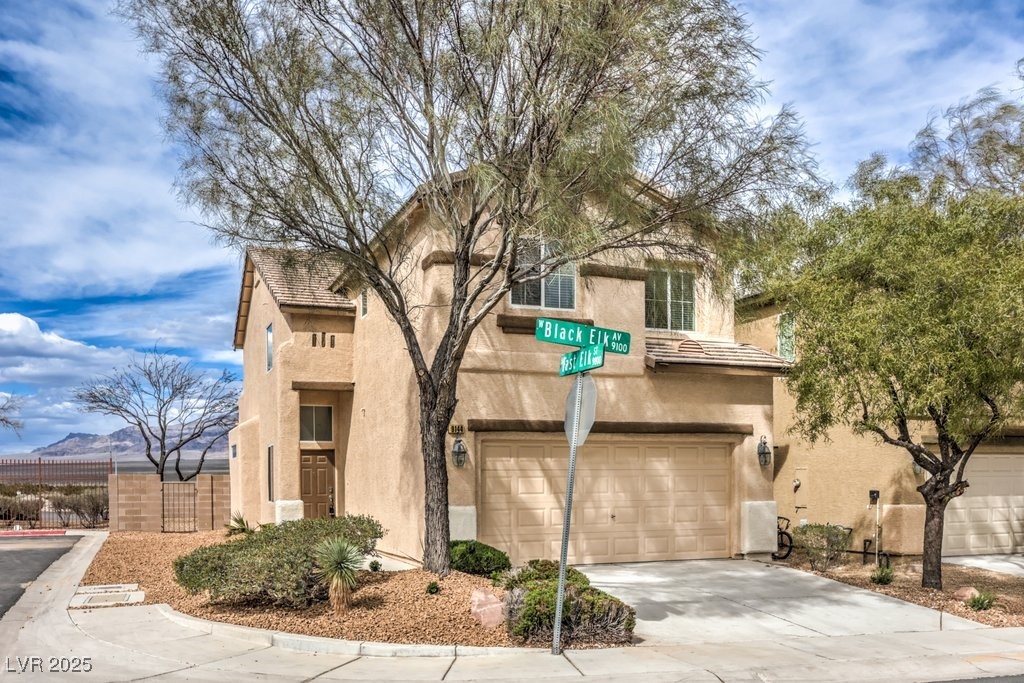
|
1,954
sqft
|
built
2004
9144 Black Elk Ave, Las Vegas, NV 89143
$-1,267
Cash flow
-12.6%
Cash-on-Cash Return
3.4%
Cap rate
0.5%
Rent to Value Ratio
Active
$335,000
2
bds
|
3
ba
|
1,265
sqft
|
built
1996
6540 Angel Mountain Ave, Las Vegas, NV 89130
$-886
Cash flow
-13.8%
Cash-on-Cash Return
3.1%
Cap rate
0.5%
Rent to Value Ratio
Active
$390,000
2
bds
|
2
ba
|
1,173
sqft
|
built
1986
6987 Emerald Springs Ln, Las Vegas, NV 89113
$-1,606
Cash flow
-21.5%
Cash-on-Cash Return
1.3%
Cap rate
0.5%
Rent to Value Ratio
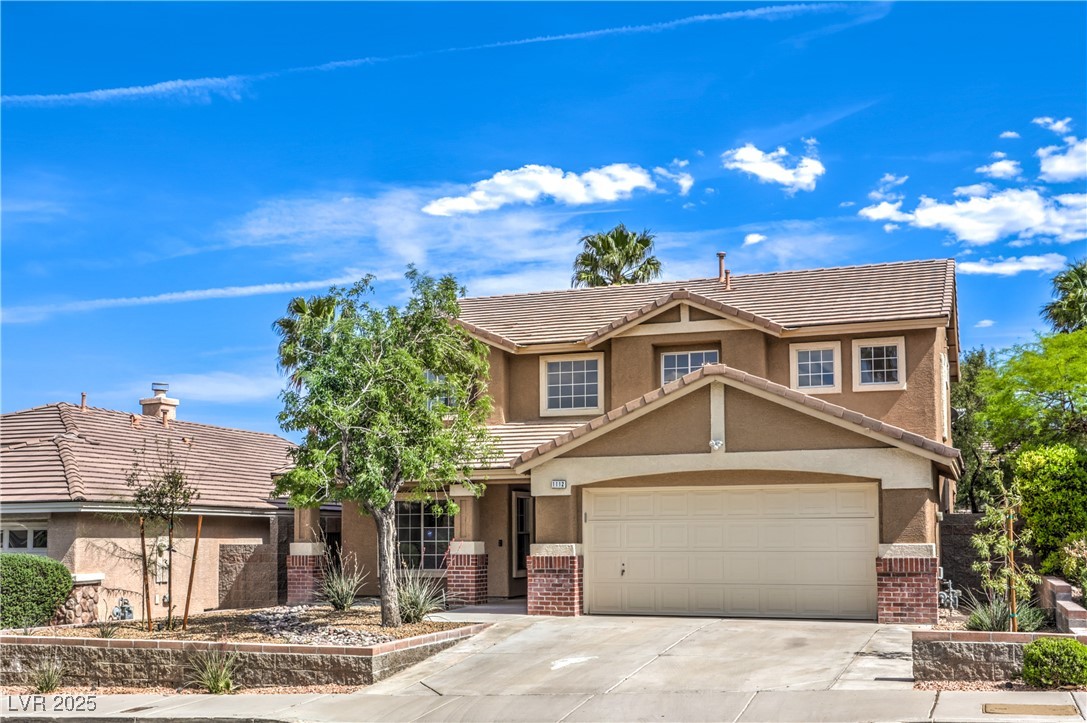
Active
$989,999
5
bds
|
4
ba
|
3,406
sqft
|
built
1989
8132 Bay Harbor Dr, Las Vegas, NV 89128
$-2,370
Cash flow
-12.5%
Cash-on-Cash Return
3.4%
Cap rate
0.5%
Rent to Value Ratio
Active
$599,999
4
bds
|
3
ba
|
2,391
sqft
|
built
1998
5009 Elm Grove Dr, Las Vegas, NV 89130
$-1,424
Cash flow
-12.4%
Cash-on-Cash Return
3.4%
Cap rate
0.5%
Rent to Value Ratio
Active
$535,000
4
bds
|
3
ba
|
2,525
sqft
|
built
1996
5133 Burr Oak Dr, Las Vegas, NV 89130
$-1,693
Cash flow
-16.5%
Cash-on-Cash Return
2.5%
Cap rate
0.4%
Rent to Value Ratio