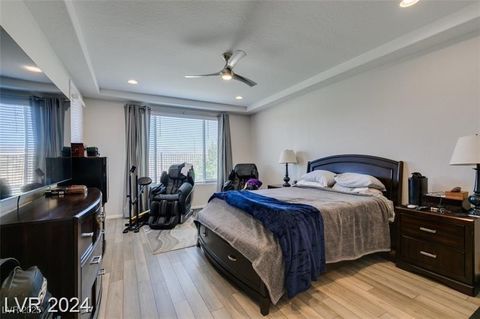
Las Vegas, NV Investment Properties for Sale
Browse homes for sale and investment properties in Las Vegas, NV. Refine your search by price, property type, or more.
Best cash flowing properties in Las Vegas, NV
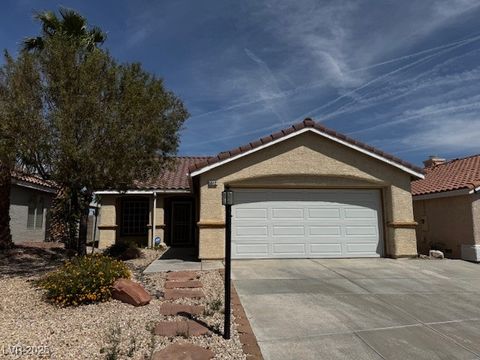
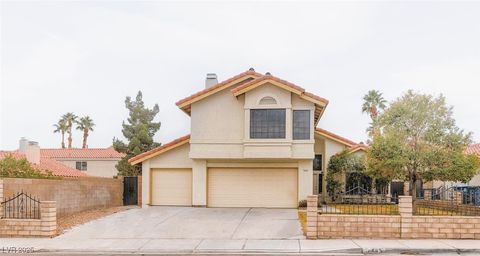
Active
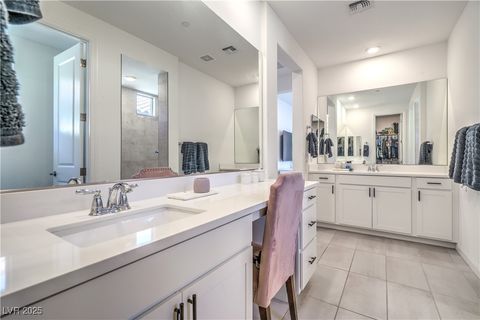
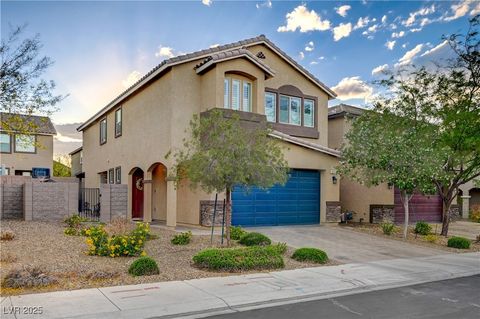
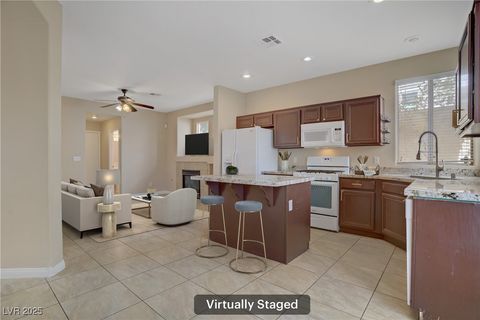
$345,000
2
bds
|
2
ba
|
1,244
sqft
|
built
1996
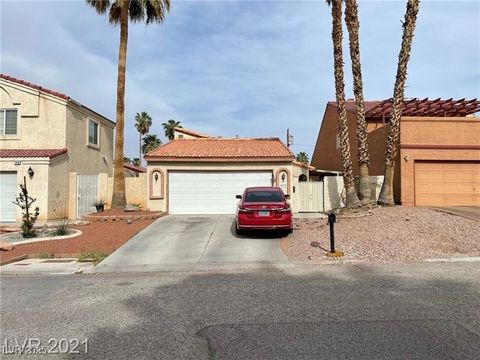
5512 Oakwood Ridge St, Las Vegas, NV 89130
$-744
Cash flow
-11.3%
Cash-on-Cash Return
3.7%
Cap rate
0.5%
Rent to Value Ratio
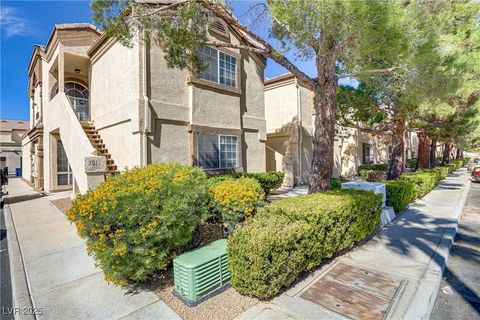
Active
$275,000
2
bds
|
2
ba
|
1,108
sqft
|
built
1996
3660 Renovah St, Las Vegas, NV 89129
$-767
Cash flow
-14.6%
Cash-on-Cash Return
2.9%
Cap rate
0.5%
Rent to Value Ratio
5,385 out of 5,514 properties for sale in Las Vegas, NV
Limited Results Shown
Create a free account, or log in to reveal all property listings and enjoy the complete experience.
Active
$634,995
4
bds
|
3
ba
|
2,625
sqft
|
built
2004
7349 Royal Melbourne Dr, Las Vegas, NV 89131
$-1,789
Cash flow
-14.7%
Cash-on-Cash Return
2.9%
Cap rate
0.4%
Rent to Value Ratio
Active
$1,499,999
3
bds
|
3
ba
|
2,814
sqft
|
built
2002
9921 Mirada Dr, Las Vegas, NV 89144
$-5,624
Cash flow
-19.6%
Cash-on-Cash Return
1.8%
Cap rate
0.3%
Rent to Value Ratio
Active
$575,000
5
bds
|
3
ba
|
2,430
sqft
|
built
2021
8977 Sweet Chestnut Ln, Las Vegas, NV 89178
$-1,609
Cash flow
-14.6%
Cash-on-Cash Return
2.9%
Cap rate
0.5%
Rent to Value Ratio
Active
$410,000
4
bds
|
3
ba
|
1,830
sqft
|
built
1998
5854 Heather Marie Dr, Las Vegas, NV 89110
$-883
Cash flow
-11.2%
Cash-on-Cash Return
3.7%
Cap rate
0.5%
Rent to Value Ratio
Active
$530,000
4
bds
|
4
ba
|
2,614
sqft
|
built
2012
4535 Mission Meadow Cir, Las Vegas, NV 89139
$-1,306
Cash flow
-12.9%
Cash-on-Cash Return
3.3%
Cap rate
0.5%
Rent to Value Ratio
Active
$660,000
4
bds
|
3
ba
|
3,088
sqft
|
built
2021
6955 Elysian Valley Ave, Las Vegas, NV 89113
$-1,760
Cash flow
-13.9%
Cash-on-Cash Return
3.1%
Cap rate
0.5%
Rent to Value Ratio
Active
$525,000
4
bds
|
2
ba
|
2,072
sqft
|
built
1974
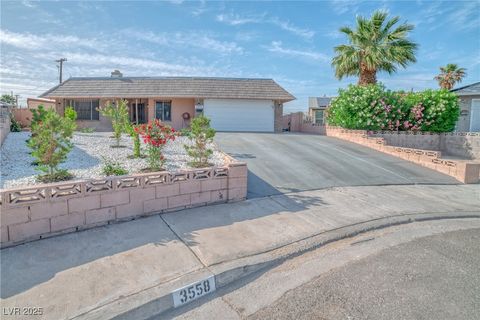
3558 Wayne Cir, Las Vegas, NV 89121
$-1,271
Cash flow
-12.6%
Cash-on-Cash Return
3.4%
Cap rate
0.4%
Rent to Value Ratio

Active
$999,000
4
bds
|
4
ba
|
2,820
sqft
|
built
1974
4315 W Maulding Ave, Las Vegas, NV 89139
$-2,426
Cash flow
-12.7%
Cash-on-Cash Return
3.4%
Cap rate
0.4%
Rent to Value Ratio
Active
$475,000
4
bds
|
3
ba
|
1,834
sqft
|
built
1990
459 Kelsford Dr, Las Vegas, NV 89123
$-1,094
Cash flow
-12.0%
Cash-on-Cash Return
3.5%
Cap rate
0.5%
Rent to Value Ratio

Active
$499,000
2
bds
|
2
ba
|
1,173
sqft
|
built
1987
6970 Emerald Springs Ln, Las Vegas, NV 89113
$-1,735
Cash flow
-18.1%
Cash-on-Cash Return
2.1%
Cap rate
0.5%
Rent to Value Ratio
Active
$430,000
4
bds
|
3
ba
|
1,779
sqft
|
built
1989
6624 Socorro Dr, Las Vegas, NV 89108
$-1,103
Cash flow
-13.4%
Cash-on-Cash Return
3.2%
Cap rate
0.4%
Rent to Value Ratio
Active
$599,000
4
bds
|
3
ba
|
2,220
sqft
|
built
1971
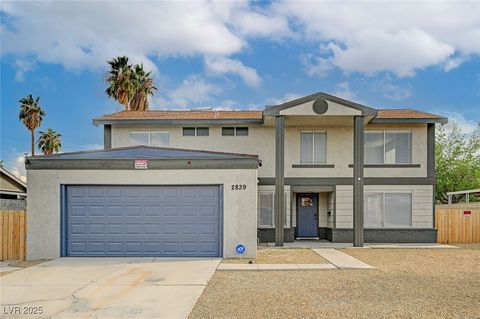
2839 Boise St, Las Vegas, NV 89121
$-1,095
Cash flow
-9.5%
Cash-on-Cash Return
4.1%
Cap rate
0.5%
Rent to Value Ratio

Active
$398,000
1
bds
|
1
ba
|
615
sqft
|
built
2006
4381 W Flamingo Rd, Las Vegas, NV 89103
$-1,456
Cash flow
-19.1%
Cash-on-Cash Return
1.9%
Cap rate
0.5%
Rent to Value Ratio
Active
$730,000
4
bds
|
2
ba
|
2,056
sqft
|
built
1977
4300 Thom Blvd, Las Vegas, NV 89130
$-2,528
Cash flow
-18.1%
Cash-on-Cash Return
2.1%
Cap rate
0.3%
Rent to Value Ratio

Active
$526,000
4
bds
|
3
ba
|
1,954
sqft
|
built
2004
9144 Black Elk Ave, Las Vegas, NV 89143
$-1,258
Cash flow
-12.5%
Cash-on-Cash Return
3.4%
Cap rate
0.5%
Rent to Value Ratio
Active
$1,289,000
4
bds
|
3
ba
|
3,785
sqft
|
built
1995
8275 W Craig Rd, Las Vegas, NV 89129
$-2,436
Cash flow
-9.9%
Cash-on-Cash Return
4.0%
Cap rate
0.5%
Rent to Value Ratio
Active
$829,000
4
bds
|
4
ba
|
3,174
sqft
|
built
2007
6527 Lokai Ave, Las Vegas, NV 89130
$-2,033
Cash flow
-12.8%
Cash-on-Cash Return
3.3%
Cap rate
0.5%
Rent to Value Ratio
Active
$390,000
2
bds
|
2
ba
|
1,173
sqft
|
built
1986
6987 Emerald Springs Ln, Las Vegas, NV 89113
$-1,600
Cash flow
-21.4%
Cash-on-Cash Return
1.3%
Cap rate
0.5%
Rent to Value Ratio

Active
$989,999
5
bds
|
4
ba
|
3,406
sqft
|
built
1989
8132 Bay Harbor Dr, Las Vegas, NV 89128
$-2,355
Cash flow
-12.4%
Cash-on-Cash Return
3.4%
Cap rate
0.5%
Rent to Value Ratio

Active
$599,999
4
bds
|
3
ba
|
2,391
sqft
|
built
1998
5009 Elm Grove Dr, Las Vegas, NV 89130
$-1,414
Cash flow
-12.3%
Cash-on-Cash Return
3.4%
Cap rate
0.5%
Rent to Value Ratio
Active
$695,000
3
bds
|
3
ba
|
2,297
sqft
|
built
2023
6593 Corsari Ridge St, Las Vegas, NV 89166
$-2,504
Cash flow
-18.8%
Cash-on-Cash Return
1.9%
Cap rate
0.4%
Rent to Value Ratio
Active
$535,000
4
bds
|
3
ba
|
2,525
sqft
|
built
1996
5133 Burr Oak Dr, Las Vegas, NV 89130
$-1,684
Cash flow
-16.4%
Cash-on-Cash Return
2.5%
Cap rate
0.4%
Rent to Value Ratio
Active
$345,000
2
bds
|
2
ba
|
1,244
sqft
|
built
1996
5512 Oakwood Ridge St, Las Vegas, NV 89130
$-744
Cash flow
-11.3%
Cash-on-Cash Return
3.7%
Cap rate
0.5%
Rent to Value Ratio
Active
$429,888
3
bds
|
2
ba
|
1,593
sqft
|
built
1978
2690 Diamante Cir, Las Vegas, NV 89121
$-813
Cash flow
-9.9%
Cash-on-Cash Return
4.0%
Cap rate
0.5%
Rent to Value Ratio
Active
$275,000
2
bds
|
2
ba
|
1,108
sqft
|
built
1996
3660 Renovah St, Las Vegas, NV 89129
$-767
Cash flow
-14.6%
Cash-on-Cash Return
2.9%
Cap rate
0.5%
Rent to Value Ratio
Active
$739,000
5
bds
|
5
ba
|
3,369
sqft
|
built
1994
3755 Broadmead St, Las Vegas, NV 89147
$-1,594
Cash flow
-11.3%
Cash-on-Cash Return
3.7%
Cap rate
0.5%
Rent to Value Ratio
Active under contract
$549,900
5
bds
|
3
ba
|
2,449
sqft
|
built
1989
7445 Shangri La Ave, Las Vegas, NV 89147
$-1,192
Cash flow
-11.3%
Cash-on-Cash Return
3.7%
Cap rate
0.5%
Rent to Value Ratio
Active
$869,000
4
bds
|
3
ba
|
3,303
sqft
|
built
1996
4649 Bird View Ct, Las Vegas, NV 89129
$-1,896
Cash flow
-11.4%
Cash-on-Cash Return
3.6%
Cap rate
0.5%
Rent to Value Ratio
Pending
$749,900
5
bds
|
3
ba
|
2,625
sqft
|
built
1998
10241 Regents Cross Ct, Las Vegas, NV 89144
$-2,157
Cash flow
-15.0%
Cash-on-Cash Return
2.8%
Cap rate
0.4%
Rent to Value Ratio
Active
$1,499,900
4
bds
|
3
ba
|
2,973
sqft
|
built
2000
613 Pinnacle Heights Ln, Las Vegas, NV 89144
$-4,386
Cash flow
-15.3%
Cash-on-Cash Return
2.8%
Cap rate
0.4%
Rent to Value Ratio
Active
$510,000
3
bds
|
3
ba
|
2,034
sqft
|
built
2018
9327 Fire Rose St, Las Vegas, NV 89178
$-1,497
Cash flow
-15.3%
Cash-on-Cash Return
2.7%
Cap rate
0.4%
Rent to Value Ratio
Active
$930,000
4
bds
|
4
ba
|
3,146
sqft
|
built
2023
9007 Powell Springs St, Las Vegas, NV 89166
$-2,541
Cash flow
-14.3%
Cash-on-Cash Return
3.0%
Cap rate
0.5%
Rent to Value Ratio
Active
$785,000
2
bds
|
2
ba
|
1,404
sqft
|
built
1988
7617 Sea Cliff Way, Las Vegas, NV 89128
$-2,981
Cash flow
-19.8%
Cash-on-Cash Return
1.7%
Cap rate
0.3%
Rent to Value Ratio

Active
$815,000
7
bds
|
0
ba
|
3,568
sqft
|
built
1961
2600 E Bonanza Rd, Las Vegas, NV 89101
$-2,979
Cash flow
-19.1%
Cash-on-Cash Return
1.9%
Cap rate
0.2%
Rent to Value Ratio
Active
$429,900
3
bds
|
2
ba
|
1,176
sqft
|
built
1970
3955 Ventura Way, Las Vegas, NV 89121
$-1,309
Cash flow
-15.9%
Cash-on-Cash Return
2.6%
Cap rate
0.3%
Rent to Value Ratio
Active
$515,000
4
bds
|
3
ba
|
1,950
sqft
|
built
1998
1812 Relate Ct, Las Vegas, NV 89117
$-1,366
Cash flow
-13.8%
Cash-on-Cash Return
3.1%
Cap rate
0.5%
Rent to Value Ratio
Active
$710,000
7
bds
|
4
ba
|
3,919
sqft
|
built
1963
1904 Chapman Dr, Las Vegas, NV 89104
$-1,455
Cash flow
-10.7%
Cash-on-Cash Return
3.8%
Cap rate
0.5%
Rent to Value Ratio
Active
$439,000
4
bds
|
3
ba
|
1,957
sqft
|
built
2009
6030 Devers Ct, Las Vegas, NV 89118
$-1,137
Cash flow
-13.5%
Cash-on-Cash Return
3.2%
Cap rate
0.5%
Rent to Value Ratio
Active
$650,000
5
bds
|
3
ba
|
3,004
sqft
|
built
2002
5862 Bluthe Bridge Ave, Las Vegas, NV 89141
$-1,618
Cash flow
-13.0%
Cash-on-Cash Return
3.3%
Cap rate
0.5%
Rent to Value Ratio
Active
$450,000
3
bds
|
2
ba
|
1,793
sqft
|
built
1988
4434 Los Reyes Ct, Las Vegas, NV 89121
$-1,048
Cash flow
-12.2%
Cash-on-Cash Return
3.5%
Cap rate
0.4%
Rent to Value Ratio