Las Vegas, NV Investment Properties for Sale
Browse homes for sale and investment properties in Las Vegas, NV. Refine your search by price, property type, or more.
Best cash flowing properties in Las Vegas, NV

Active
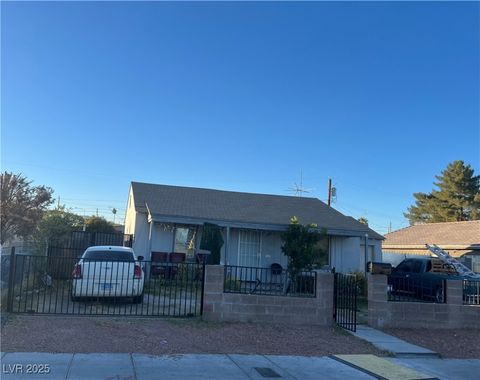
$185,000
2
bds
|
1
ba
|
772
sqft
|
built
1972
3946 Voxna St, Las Vegas, NV 89119
$-434
Cash flow
-12.2%
Cash-on-Cash Return
3.5%
Cap rate
0.6%
Rent to Value Ratio

Active
$186,000
1
bds
|
1
ba
|
723
sqft
|
built
1995
5415 W Harmon Ave, Las Vegas, NV 89103
$-470
Cash flow
-13.2%
Cash-on-Cash Return
3.2%
Cap rate
0.6%
Rent to Value Ratio
6,275 out of 6,409 properties for sale in Las Vegas, NV
Limited Results Shown
Create a free account, or log in to reveal all property listings and enjoy the complete experience.
Active
$229,995
2
bds
|
2
ba
|
1,127
sqft
|
built
1990
6871 Tamarus St, Las Vegas, NV 89119
$-552
Cash flow
-12.5%
Cash-on-Cash Return
3.4%
Cap rate
0.6%
Rent to Value Ratio
Active
$370,000
3
bds
|
2
ba
|
1,405
sqft
|
built
1998
2035 E Warm Springs Rd, Las Vegas, NV 89119
$-904
Cash flow
-12.7%
Cash-on-Cash Return
3.3%
Cap rate
0.6%
Rent to Value Ratio
Active
$230,000
2
bds
|
2
ba
|
1,266
sqft
|
built
1985
2643 Red Rock St, Las Vegas, NV 89146
$-474
Cash flow
-10.8%
Cash-on-Cash Return
3.8%
Cap rate
0.7%
Rent to Value Ratio
Active
$248,000
2
bds
|
2
ba
|
1,266
sqft
|
built
1985
2673 Red Rock St, Las Vegas, NV 89146
$-564
Cash flow
-11.9%
Cash-on-Cash Return
3.5%
Cap rate
0.6%
Rent to Value Ratio
Active
$239,900
2
bds
|
1
ba
|
929
sqft
|
built
1995
7950 W Flamingo Rd, Las Vegas, NV 89147
$-528
Cash flow
-11.5%
Cash-on-Cash Return
3.6%
Cap rate
0.6%
Rent to Value Ratio
Active
$159,800
1
bds
|
1
ba
|
724
sqft
|
built
1980
1455 E Katie Ave, Las Vegas, NV 89119
$-482
Cash flow
-15.7%
Cash-on-Cash Return
2.6%
Cap rate
0.6%
Rent to Value Ratio

Active
$597,000
4
bds
|
4
ba
|
2,414
sqft
|
built
2019
8087 Carpenter Creek Ave, Las Vegas, NV 89113
$-1,860
Cash flow
-16.3%
Cash-on-Cash Return
2.5%
Cap rate
0.4%
Rent to Value Ratio

Active
$1,499,900
5
bds
|
5
ba
|
4,834
sqft
|
built
2020
8620 Grove Mill Ct, Las Vegas, NV 89139
$-1,720
Cash flow
-6.0%
Cash-on-Cash Return
4.9%
Cap rate
0.7%
Rent to Value Ratio

Active
$2,139,777
4
bds
|
3
ba
|
2,935
sqft
|
built
2016
294 Besame Ct, Las Vegas, NV 89138
$-6,834
Cash flow
-16.7%
Cash-on-Cash Return
2.4%
Cap rate
0.4%
Rent to Value Ratio
Active
$675,000
4
bds
|
3
ba
|
2,988
sqft
|
built
2020
6790 Tangled Vines Ave, Las Vegas, NV 89139
$-1,950
Cash flow
-15.1%
Cash-on-Cash Return
2.8%
Cap rate
0.4%
Rent to Value Ratio

Active
$3,950,000
5
bds
|
6
ba
|
4,888
sqft
|
built
2015
29 Owl Ridge Ct, Las Vegas, NV 89135
$-14,914
Cash flow
-19.7%
Cash-on-Cash Return
1.7%
Cap rate
0.3%
Rent to Value Ratio

Active
$299,900
3
bds
|
2
ba
|
1,437
sqft
|
built
2002
7151 S Durango Dr, Las Vegas, NV 89113
$-892
Cash flow
-15.5%
Cash-on-Cash Return
2.7%
Cap rate
0.6%
Rent to Value Ratio
Active
$419,000
3
bds
|
3
ba
|
1,516
sqft
|
built
2005
9717 Villa Lorena Ave, Las Vegas, NV 89147
$-944
Cash flow
-11.8%
Cash-on-Cash Return
3.6%
Cap rate
0.5%
Rent to Value Ratio
Active
$284,999
2
bds
|
2
ba
|
1,320
sqft
|
built
1969
163 Greenbriar Townhouse Way, Las Vegas, NV 89121
$-728
Cash flow
-13.3%
Cash-on-Cash Return
3.2%
Cap rate
0.5%
Rent to Value Ratio

Active
$688,888
6
bds
|
3
ba
|
3,540
sqft
|
built
2003
527 Leap Frog Ave, Las Vegas, NV 89183
$-1,200
Cash flow
-9.1%
Cash-on-Cash Return
4.2%
Cap rate
0.6%
Rent to Value Ratio
Active
$185,000
2
bds
|
1
ba
|
772
sqft
|
built
1972
3946 Voxna St, Las Vegas, NV 89119
$-434
Cash flow
-12.2%
Cash-on-Cash Return
3.5%
Cap rate
0.6%
Rent to Value Ratio

Active
$359,000
3
bds
|
2
ba
|
1,114
sqft
|
built
1956
5013 Vermont Ave, Las Vegas, NV 89107
$-543
Cash flow
-7.9%
Cash-on-Cash Return
4.4%
Cap rate
0.6%
Rent to Value Ratio
Active
$340,000
4
bds
|
2
ba
|
1,248
sqft
|
built
1959
616 Bowman Ave, Las Vegas, NV 89106
$-745
Cash flow
-11.4%
Cash-on-Cash Return
3.6%
Cap rate
0.5%
Rent to Value Ratio

Active
$1,800,000
5
bds
|
5
ba
|
4,503
sqft
|
built
1977
3175 S Torrey Pines Dr, Las Vegas, NV 89146
$-7,145
Cash flow
-20.7%
Cash-on-Cash Return
1.5%
Cap rate
0.2%
Rent to Value Ratio
Active
$1,499,999
5
bds
|
4
ba
|
3,862
sqft
|
built
2009
9749 Glistening Brook Ct, Las Vegas, NV 89149
$-5,654
Cash flow
-19.7%
Cash-on-Cash Return
1.7%
Cap rate
0.3%
Rent to Value Ratio

Active
$227,900
2
bds
|
1
ba
|
921
sqft
|
built
1998
3125 N Buffalo Dr, Las Vegas, NV 89128
$-633
Cash flow
-14.5%
Cash-on-Cash Return
2.9%
Cap rate
0.6%
Rent to Value Ratio

Active
$999,999
6
bds
|
4
ba
|
3,694
sqft
|
built
2000
8122 Delphi Ct, Las Vegas, NV 89117
$-3,352
Cash flow
-17.5%
Cash-on-Cash Return
2.2%
Cap rate
0.3%
Rent to Value Ratio
Active
$339,000
3
bds
|
3
ba
|
1,298
sqft
|
built
2006
9132 Gabardine Ave, Las Vegas, NV 89149
$-719
Cash flow
-11.1%
Cash-on-Cash Return
3.7%
Cap rate
0.5%
Rent to Value Ratio
Active
$675,000
3
bds
|
3
ba
|
2,175
sqft
|
built
2016
907 Gallery Course Dr, Las Vegas, NV 89148
$-2,237
Cash flow
-17.3%
Cash-on-Cash Return
2.3%
Cap rate
0.4%
Rent to Value Ratio
Active
$374,900
3
bds
|
3
ba
|
2,009
sqft
|
built
2005
4150 Pohickery Ct, Las Vegas, NV 89115
$-729
Cash flow
-10.1%
Cash-on-Cash Return
3.9%
Cap rate
0.5%
Rent to Value Ratio
Active
$170,000
1
bds
|
1
ba
|
668
sqft
|
built
1994
1541 Linnbaker Ln, Las Vegas, NV 89110
$-513
Cash flow
-15.7%
Cash-on-Cash Return
2.6%
Cap rate
0.6%
Rent to Value Ratio
Active
$515,000
3
bds
|
2
ba
|
1,775
sqft
|
built
1999
8337 Ruby Heights Ave, Las Vegas, NV 89117
$-1,363
Cash flow
-13.8%
Cash-on-Cash Return
3.1%
Cap rate
0.4%
Rent to Value Ratio
Active
$305,000
3
bds
|
1
ba
|
882
sqft
|
built
1942
212 S 16th St, Las Vegas, NV 89101
$-675
Cash flow
-11.5%
Cash-on-Cash Return
3.6%
Cap rate
0.5%
Rent to Value Ratio
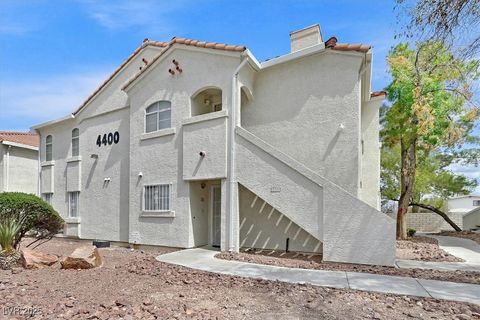
Active
$210,000
2
bds
|
2
ba
|
1,081
sqft
|
built
1994
4400 W Lake Mead Blvd, Las Vegas, NV 89108
$-591
Cash flow
-14.7%
Cash-on-Cash Return
2.9%
Cap rate
0.6%
Rent to Value Ratio
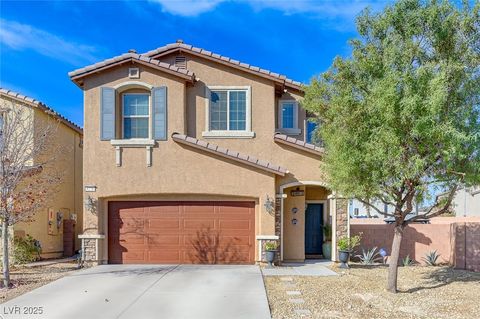
Active
$409,000
3
bds
|
3
ba
|
1,722
sqft
|
built
2016
6276 Point Isabel Way, Las Vegas, NV 89122
$-1,094
Cash flow
-14.0%
Cash-on-Cash Return
3.1%
Cap rate
0.5%
Rent to Value Ratio
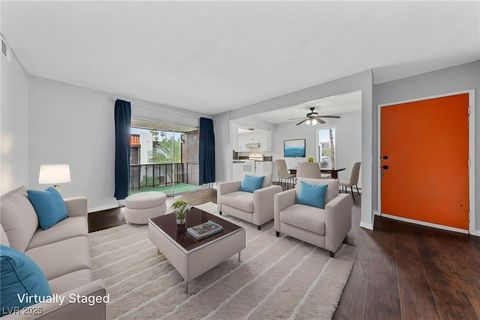
Active
$174,999
2
bds
|
2
ba
|
1,237
sqft
|
built
1971
1405 Vegas Valley Dr, Las Vegas, NV 89169
$-577
Cash flow
-17.2%
Cash-on-Cash Return
2.3%
Cap rate
0.6%
Rent to Value Ratio
Active
$259,000
1
bds
|
1
ba
|
727
sqft
|
built
1992
270 E Flamingo Rd, Las Vegas, NV 89169
$-728
Cash flow
-14.7%
Cash-on-Cash Return
2.9%
Cap rate
0.7%
Rent to Value Ratio
Active
$625,000
4
bds
|
3
ba
|
2,603
sqft
|
built
2018
6403 Ava Ridge Ave, Las Vegas, NV 89141
$-1,474
Cash flow
-12.3%
Cash-on-Cash Return
3.4%
Cap rate
0.5%
Rent to Value Ratio
Active
$584,800
4
bds
|
3
ba
|
2,168
sqft
|
built
2012
152 Lotus Vale Ave, Las Vegas, NV 89123
$-1,585
Cash flow
-14.1%
Cash-on-Cash Return
3.0%
Cap rate
0.4%
Rent to Value Ratio
Active
$248,000
3
bds
|
3
ba
|
1,533
sqft
|
built
1974
708 Fernwood Ln, Las Vegas, NV 89169
$-498
Cash flow
-10.5%
Cash-on-Cash Return
3.9%
Cap rate
0.7%
Rent to Value Ratio
Active
$549,999
4
bds
|
3
ba
|
2,291
sqft
|
built
2004
6177 W Cougar Ave, Las Vegas, NV 89139
$-1,513
Cash flow
-14.4%
Cash-on-Cash Return
3.0%
Cap rate
0.4%
Rent to Value Ratio

Active
$386,999
2
bds
|
3
ba
|
1,413
sqft
|
built
2010
8368 Creek Canyon Ave, Las Vegas, NV 89113
$-919
Cash flow
-12.4%
Cash-on-Cash Return
3.4%
Cap rate
0.5%
Rent to Value Ratio
Active
$465,000
3
bds
|
2
ba
|
1,747
sqft
|
built
2000
6508 Alpine Forest Ct, Las Vegas, NV 89149
$-1,168
Cash flow
-13.1%
Cash-on-Cash Return
3.3%
Cap rate
0.5%
Rent to Value Ratio
Active
$186,000
1
bds
|
1
ba
|
723
sqft
|
built
1995
5415 W Harmon Ave, Las Vegas, NV 89103
$-470
Cash flow
-13.2%
Cash-on-Cash Return
3.2%
Cap rate
0.6%
Rent to Value Ratio
Active
$381,900
3
bds
|
3
ba
|
1,588
sqft
|
built
2005
8798 Tom Noon Ave, Las Vegas, NV 89178
$-949
Cash flow
-13.0%
Cash-on-Cash Return
3.3%
Cap rate
0.5%
Rent to Value Ratio