Las Vegas, NV Investment Properties for Sale
Browse homes for sale and investment properties in Las Vegas, NV. Refine your search by price, property type, or more.
Best cash flowing properties in Las Vegas, NV
Active
$265,000
2
bds
|
2
ba
|
1,048
sqft
|
built
1978
4338 Caliente St, Las Vegas, NV 89119
$-297
Cash flow
-5.8%
Cash-on-Cash Return
4.9%
Cap rate
0.7%
Rent to Value Ratio
Active
$160,000
1
bds
|
1
ba
|
671
sqft
|
built
1990
6800 E Lake Mead Blvd, Las Vegas, NV 89156
$-441
Cash flow
-14.4%
Cash-on-Cash Return
3.0%
Cap rate
0.6%
Rent to Value Ratio
5,637 out of 5,771 properties for sale in Las Vegas, NV
Limited Results Shown
Create a free account, or log in to reveal all property listings and enjoy the complete experience.
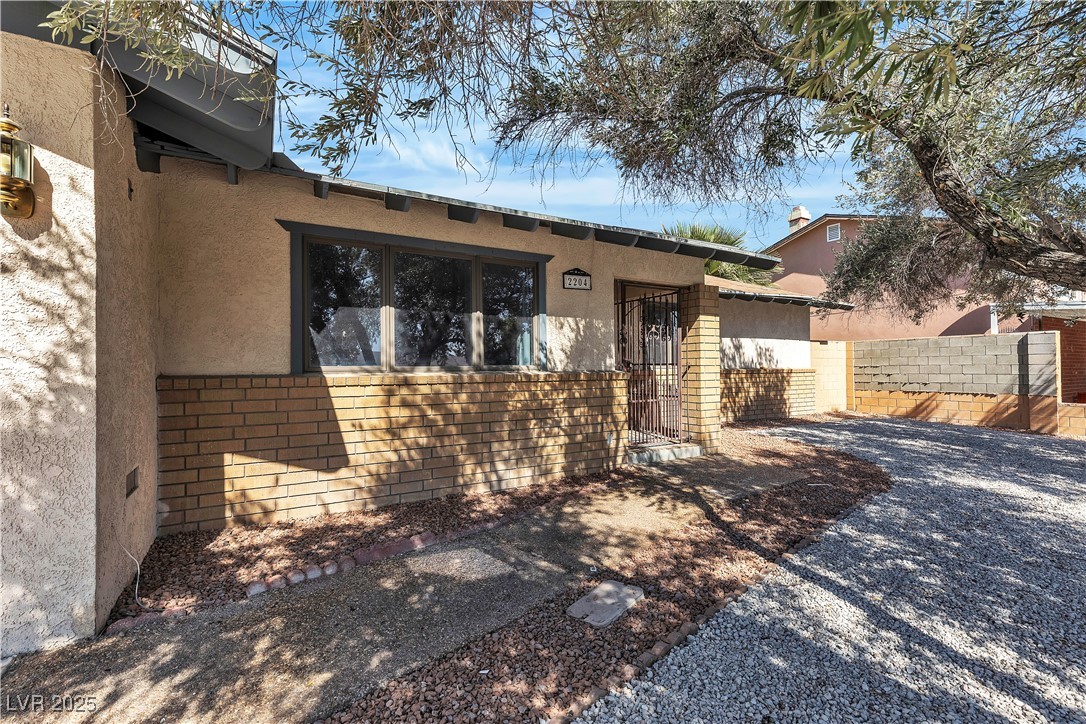
Active
$435,000
5
bds
|
3
ba
|
2,098
sqft
|
built
1976
2204 Monterey Ave, Las Vegas, NV 89104
$-1,014
Cash flow
-12.2%
Cash-on-Cash Return
3.5%
Cap rate
0.5%
Rent to Value Ratio
Active under contract
$774,998
4
bds
|
3
ba
|
2,315
sqft
|
built
1998
10613 Turquoise Valley Dr, Las Vegas, NV 89144
$-2,727
Cash flow
-18.4%
Cash-on-Cash Return
2.1%
Cap rate
0.3%
Rent to Value Ratio
Active
$245,000
2
bds
|
2
ba
|
934
sqft
|
built
1997
7885 W Flamingo Rd, Las Vegas, NV 89147
$-779
Cash flow
-16.6%
Cash-on-Cash Return
2.5%
Cap rate
0.6%
Rent to Value Ratio
Active
$475,000
4
bds
|
3
ba
|
2,283
sqft
|
built
2004
8059 Wards Ferry St, Las Vegas, NV 89139
$-1,171
Cash flow
-12.9%
Cash-on-Cash Return
3.3%
Cap rate
0.5%
Rent to Value Ratio
Active
$488,000
3
bds
|
3
ba
|
2,034
sqft
|
built
1996
1934 Kings Beach Ave, Las Vegas, NV 89123
$-1,136
Cash flow
-12.1%
Cash-on-Cash Return
3.5%
Cap rate
0.5%
Rent to Value Ratio
Active
$494,900
3
bds
|
3
ba
|
2,034
sqft
|
built
2007
722 Chepstow Ave, Las Vegas, NV 89178
$-1,287
Cash flow
-13.6%
Cash-on-Cash Return
3.2%
Cap rate
0.4%
Rent to Value Ratio
Active
$660,000
4
bds
|
3
ba
|
2,350
sqft
|
built
2000
129 Sapodilla Ln, Las Vegas, NV 89144
$-2,105
Cash flow
-16.6%
Cash-on-Cash Return
2.5%
Cap rate
0.4%
Rent to Value Ratio

Pending
$445,000
3
bds
|
3
ba
|
2,129
sqft
|
built
1995
9021 Canyon Magic Ave, Las Vegas, NV 89129
$-1,034
Cash flow
-12.1%
Cash-on-Cash Return
3.5%
Cap rate
0.5%
Rent to Value Ratio
Active
$730,000
4
bds
|
3
ba
|
2,756
sqft
|
built
2001
10381 Walking View Ct, Las Vegas, NV 89135
$-2,070
Cash flow
-14.8%
Cash-on-Cash Return
2.9%
Cap rate
0.4%
Rent to Value Ratio
Active
$419,900
3
bds
|
3
ba
|
1,764
sqft
|
built
2015
5634 Bishop Flowers St, Las Vegas, NV 89130
$-1,160
Cash flow
-14.4%
Cash-on-Cash Return
3.0%
Cap rate
0.5%
Rent to Value Ratio

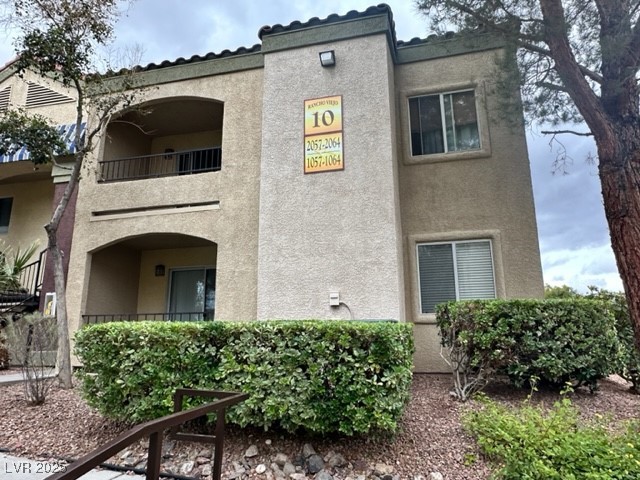
Active
$247,777
2
bds
|
2
ba
|
1,136
sqft
|
built
1990
928 Rockview Dr, Las Vegas, NV 89128
$-623
Cash flow
-13.1%
Cash-on-Cash Return
3.3%
Cap rate
0.6%
Rent to Value Ratio

Active
$974,999
5
bds
|
5
ba
|
4,834
sqft
|
built
2019
6257 Olde Lockford Ct, Las Vegas, NV 89139
$-2,610
Cash flow
-14.0%
Cash-on-Cash Return
3.1%
Cap rate
0.5%
Rent to Value Ratio
Active
$224,900
2
bds
|
1
ba
|
957
sqft
|
built
1995
7950 W Flamingo Rd, Las Vegas, NV 89147
$-508
Cash flow
-11.8%
Cash-on-Cash Return
3.6%
Cap rate
0.6%
Rent to Value Ratio
Active
$505,000
4
bds
|
2
ba
|
2,033
sqft
|
built
1990
1185 Ponce De Leon Ave, Las Vegas, NV 89123
$-1,046
Cash flow
-10.8%
Cash-on-Cash Return
3.8%
Cap rate
0.5%
Rent to Value Ratio
Active
$925,000
4
bds
|
3
ba
|
3,151
sqft
|
built
2000
812 Eaglewood Dr, Las Vegas, NV 89144
$-2,885
Cash flow
-16.3%
Cash-on-Cash Return
2.5%
Cap rate
0.4%
Rent to Value Ratio
Active
$615,000
4
bds
|
3
ba
|
2,468
sqft
|
built
1990
950 Eagle Mountain Dr, Las Vegas, NV 89123
$-1,259
Cash flow
-10.7%
Cash-on-Cash Return
3.8%
Cap rate
0.5%
Rent to Value Ratio
Active
$800,000
5
bds
|
3
ba
|
3,004
sqft
|
built
1979
6995 Rogers St, Las Vegas, NV 89118
$-2,654
Cash flow
-17.3%
Cash-on-Cash Return
2.3%
Cap rate
0.3%
Rent to Value Ratio
Active
$539,000
3
bds
|
3
ba
|
2,114
sqft
|
built
2015
7613 Pulpit Rock Ct, Las Vegas, NV 89166
$-1,671
Cash flow
-16.2%
Cash-on-Cash Return
2.6%
Cap rate
0.4%
Rent to Value Ratio
Active
$500,000
5
bds
|
2
ba
|
2,430
sqft
|
built
1978
5268 Caspian Dr, Las Vegas, NV 89118
$-1,094
Cash flow
-11.4%
Cash-on-Cash Return
3.7%
Cap rate
0.5%
Rent to Value Ratio
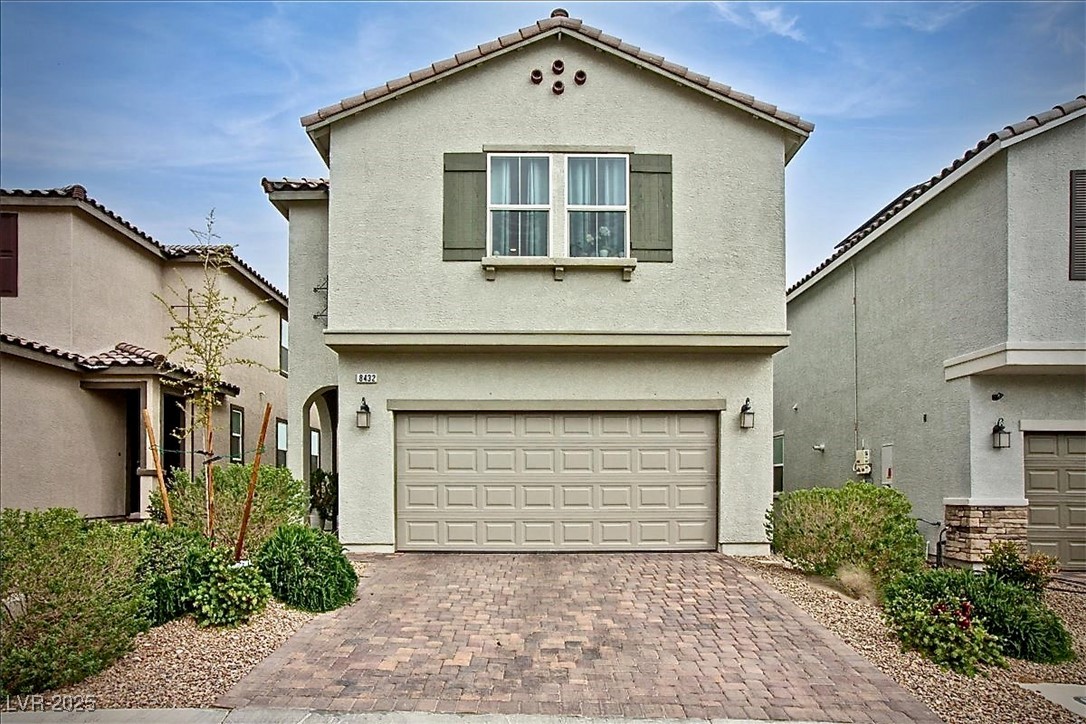
Active
$605,000
4
bds
|
3
ba
|
2,467
sqft
|
built
2020
8432 Alder Rain St, Las Vegas, NV 89113
$-1,883
Cash flow
-16.2%
Cash-on-Cash Return
2.6%
Cap rate
0.4%
Rent to Value Ratio
Active
$680,000
4
bds
|
4
ba
|
3,122
sqft
|
built
2022
9993 Birch Knoll Ave, Las Vegas, NV 89166
$-1,962
Cash flow
-15.1%
Cash-on-Cash Return
2.8%
Cap rate
0.5%
Rent to Value Ratio
Active
$722,000
3
bds
|
3
ba
|
2,395
sqft
|
built
2013
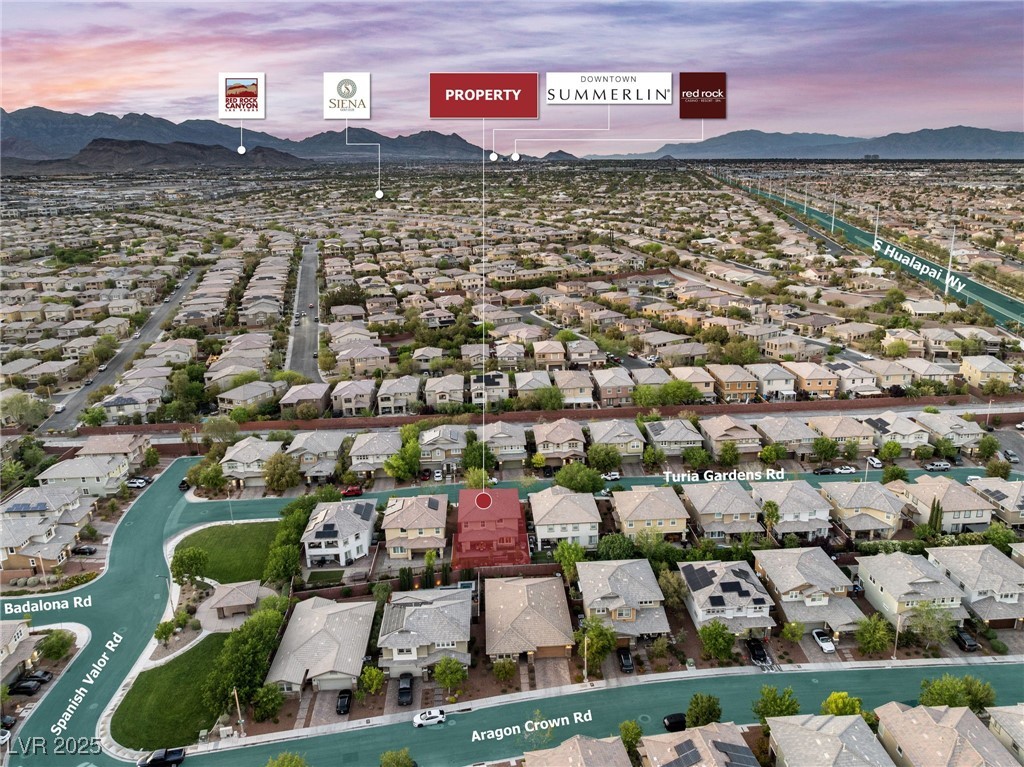
10305 Turia Gardens Rd, Las Vegas, NV 89135
$-1,735
Cash flow
-12.5%
Cash-on-Cash Return
3.4%
Cap rate
0.5%
Rent to Value Ratio
Active
$265,000
2
bds
|
2
ba
|
1,048
sqft
|
built
1978
4338 Caliente St, Las Vegas, NV 89119
$-297
Cash flow
-5.8%
Cash-on-Cash Return
4.9%
Cap rate
0.7%
Rent to Value Ratio
Active
$160,000
1
bds
|
1
ba
|
671
sqft
|
built
1990
6800 E Lake Mead Blvd, Las Vegas, NV 89156
$-441
Cash flow
-14.4%
Cash-on-Cash Return
3.0%
Cap rate
0.6%
Rent to Value Ratio
Active
$375,000
2
bds
|
2
ba
|
968
sqft
|
built
2005
4016 Balsam Mountain St, Las Vegas, NV 89129
$-938
Cash flow
-13.1%
Cash-on-Cash Return
3.3%
Cap rate
0.5%
Rent to Value Ratio
Active
$265,000
2
bds
|
2
ba
|
940
sqft
|
built
1999
2615 W Gary Ave, Las Vegas, NV 89123
$-754
Cash flow
-14.8%
Cash-on-Cash Return
2.9%
Cap rate
0.5%
Rent to Value Ratio
Active
$330,000
3
bds
|
3
ba
|
1,319
sqft
|
built
2008
5271 Aurora Beam Ave, Las Vegas, NV 89122
$-762
Cash flow
-12.0%
Cash-on-Cash Return
3.5%
Cap rate
0.5%
Rent to Value Ratio
Active
$690,000
4
bds
|
3
ba
|
3,005
sqft
|
built
2022
8564 Scalpay St, Las Vegas, NV 89166
$-2,377
Cash flow
-18.0%
Cash-on-Cash Return
2.2%
Cap rate
0.4%
Rent to Value Ratio
Active
$625,000
3
bds
|
3
ba
|
2,512
sqft
|
built
1985
6861 E Washington Ave, Las Vegas, NV 89110
$-1,704
Cash flow
-14.2%
Cash-on-Cash Return
3.0%
Cap rate
0.4%
Rent to Value Ratio
Active
$1,110,000
4
bds
|
3
ba
|
3,713
sqft
|
built
1994
8396 Garnet Canyon Ln, Las Vegas, NV 89129
$-3,762
Cash flow
-17.7%
Cash-on-Cash Return
2.2%
Cap rate
0.3%
Rent to Value Ratio
Active
$280,000
2
bds
|
2
ba
|
1,024
sqft
|
built
2001
6650 W Warm Springs Rd, Las Vegas, NV 89118
$-647
Cash flow
-12.1%
Cash-on-Cash Return
3.5%
Cap rate
0.6%
Rent to Value Ratio
Active
$605,000
4
bds
|
4
ba
|
2,234
sqft
|
built
1997
9768 Northern Dancer Dr, Las Vegas, NV 89117
$-1,778
Cash flow
-15.3%
Cash-on-Cash Return
2.8%
Cap rate
0.4%
Rent to Value Ratio
Active
$599,888
4
bds
|
3
ba
|
2,386
sqft
|
built
1997
9750 W Cherokee Ave, Las Vegas, NV 89147
$-1,667
Cash flow
-14.5%
Cash-on-Cash Return
3.0%
Cap rate
0.4%
Rent to Value Ratio
Active
$518,999
3
bds
|
2
ba
|
1,975
sqft
|
built
2007
7806 Sundial Peak St, Las Vegas, NV 89166
$-1,452
Cash flow
-14.6%
Cash-on-Cash Return
2.9%
Cap rate
0.5%
Rent to Value Ratio
Active under contract
$549,999
3
bds
|
2
ba
|
1,143
sqft
|
built
2001
2613 Country Mile Dr, Las Vegas, NV 89135
$-1,723
Cash flow
-16.3%
Cash-on-Cash Return
2.5%
Cap rate
0.4%
Rent to Value Ratio
Active
$565,000
5
bds
|
4
ba
|
2,466
sqft
|
built
2022
4588 Swimming Minnow Ave, Las Vegas, NV 89141
$-1,708
Cash flow
-15.8%
Cash-on-Cash Return
2.7%
Cap rate
0.4%
Rent to Value Ratio
Active
$1,179,000
4
bds
|
5
ba
|
4,482
sqft
|
built
2003
2290 Casa Bella Ct, Las Vegas, NV 89117
$-3,258
Cash flow
-14.4%
Cash-on-Cash Return
3.0%
Cap rate
0.5%
Rent to Value Ratio
Active
$1,159,999
3
bds
|
4
ba
|
3,255
sqft
|
built
2014
7687 W Pebble Rd, Las Vegas, NV 89113
$-3,247
Cash flow
-14.6%
Cash-on-Cash Return
2.9%
Cap rate
0.4%
Rent to Value Ratio
Active
$515,000
4
bds
|
2
ba
|
2,029
sqft
|
built
1961
1801 Griffith Ave, Las Vegas, NV 89104
$-640
Cash flow
-6.5%
Cash-on-Cash Return
4.8%
Cap rate
0.6%
Rent to Value Ratio
Active
$725,000
4
bds
|
3
ba
|
2,347
sqft
|
built
1990
2012 Lady Lake St, Las Vegas, NV 89128
$-2,193
Cash flow
-15.8%
Cash-on-Cash Return
2.7%
Cap rate
0.4%
Rent to Value Ratio