Las Vegas, NV Investment Properties for Sale
Browse homes for sale and investment properties in Las Vegas, NV. Refine your search by price, property type, or more.
Best cash flowing properties in Las Vegas, NV
Active
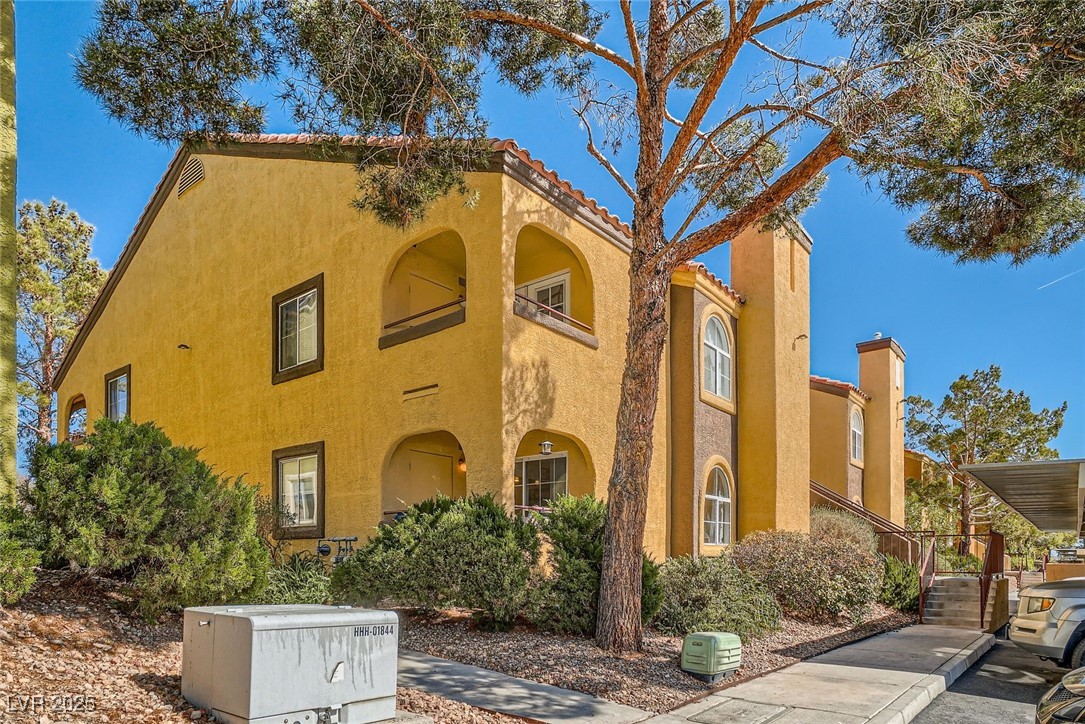
$148,000
1
bds
|
1
ba
|
688
sqft
|
built
1984
1701 E Katie Ave, Las Vegas, NV 89119
$-291
Cash flow
-10.3%
Cash-on-Cash Return
3.9%
Cap rate
0.7%
Rent to Value Ratio
Active
$285,000
3
bds
|
3
ba
|
1,173
sqft
|
built
1999
2525 Sierra Bello Ave, Las Vegas, NV 89106
$-407
Cash flow
-7.5%
Cash-on-Cash Return
4.6%
Cap rate
0.7%
Rent to Value Ratio
5,637 out of 5,771 properties for sale in Las Vegas, NV
Limited Results Shown
Create a free account, or log in to reveal all property listings and enjoy the complete experience.
Active
$221,999
2
bds
|
2
ba
|
987
sqft
|
built
1995
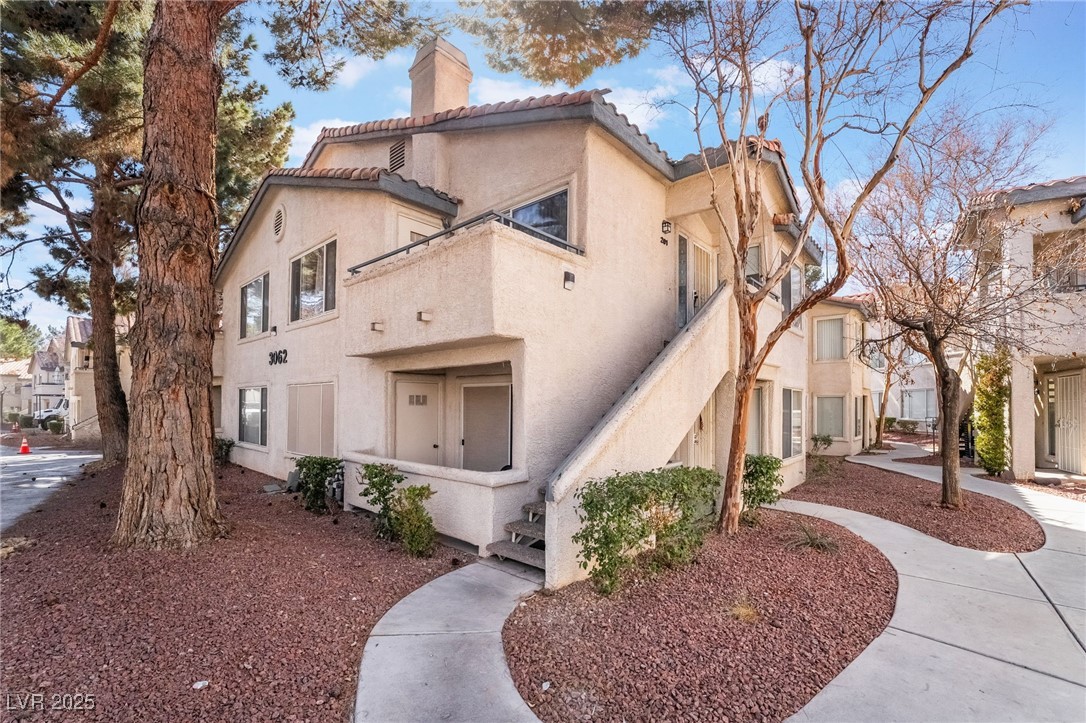
3062 Tarpon Dr, Las Vegas, NV 89120
$-564
Cash flow
-13.3%
Cash-on-Cash Return
3.2%
Cap rate
0.6%
Rent to Value Ratio
Active
$1,500,000
5
bds
|
4
ba
|
4,996
sqft
|
built
2003
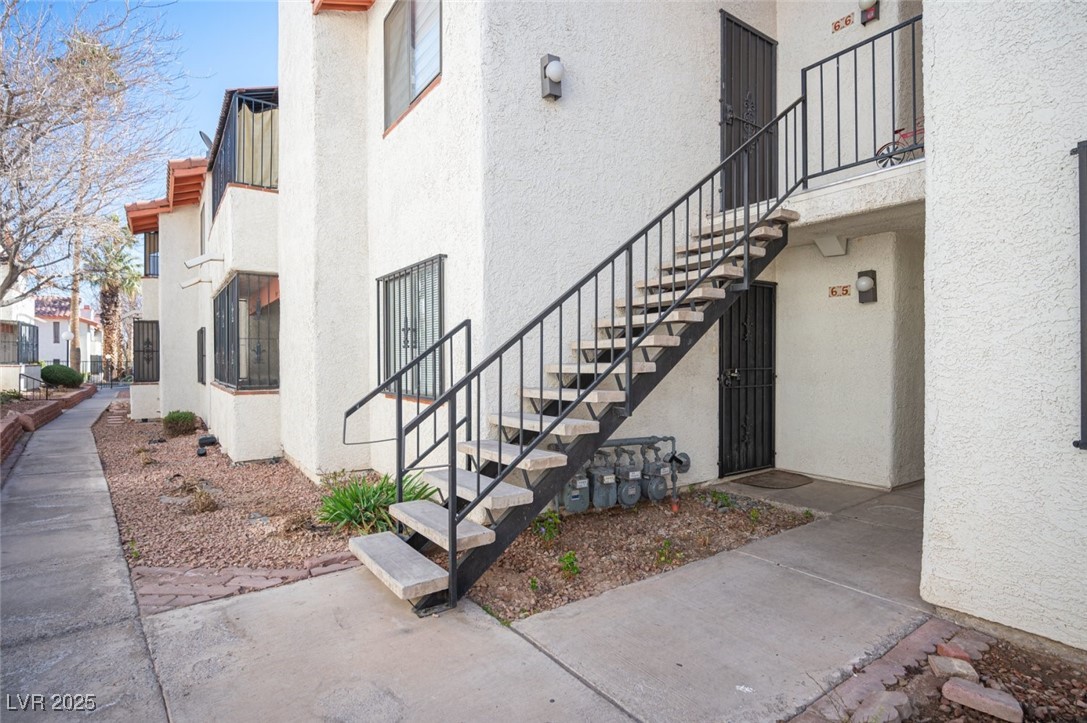
6655 Tranquil Seas Ct, Las Vegas, NV 89139
$-4,132
Cash flow
-14.4%
Cash-on-Cash Return
3.0%
Cap rate
0.4%
Rent to Value Ratio
Active
$520,000
5
bds
|
3
ba
|
3,020
sqft
|
built
2009
8036 Maple Park St, Las Vegas, NV 89131
$-1,072
Cash flow
-10.8%
Cash-on-Cash Return
3.8%
Cap rate
0.5%
Rent to Value Ratio
Active
$759,000
5
bds
|
5
ba
|
3,190
sqft
|
built
2018
9690 Hiking Ave, Las Vegas, NV 89166
$-2,156
Cash flow
-14.8%
Cash-on-Cash Return
2.9%
Cap rate
0.5%
Rent to Value Ratio
Active under contract
$370,000
3
bds
|
2
ba
|
1,482
sqft
|
built
2002
8728 Honey Vine Ave, Las Vegas, NV 89143
$-779
Cash flow
-11.0%
Cash-on-Cash Return
3.8%
Cap rate
0.5%
Rent to Value Ratio
Active
$360,000
2
bds
|
2
ba
|
1,164
sqft
|
built
1988
6914 Emerald Springs Ln, Las Vegas, NV 89113
$-1,481
Cash flow
-21.5%
Cash-on-Cash Return
1.4%
Cap rate
0.6%
Rent to Value Ratio
Active
$260,000
2
bds
|
2
ba
|
1,023
sqft
|
built
1994
7950 W Flamingo Rd, Las Vegas, NV 89147
$-497
Cash flow
-10.0%
Cash-on-Cash Return
4.0%
Cap rate
0.6%
Rent to Value Ratio
Active
$509,900
3
bds
|
3
ba
|
1,771
sqft
|
built
2022
600 N Carriage Hill Dr, Las Vegas, NV 89138
$-1,118
Cash flow
-11.4%
Cash-on-Cash Return
3.7%
Cap rate
0.6%
Rent to Value Ratio
Active
$4,238,000
6
bds
|
7
ba
|
6,103
sqft
|
built
2019
12 Olympia Chase Dr, Las Vegas, NV 89141
$-16,279
Cash flow
-20.0%
Cash-on-Cash Return
1.7%
Cap rate
0.3%
Rent to Value Ratio
Active
$499,900
3
bds
|
2
ba
|
1,542
sqft
|
built
2024
10009 Locking Biner Ave, Las Vegas, NV 89166
$-1,445
Cash flow
-15.1%
Cash-on-Cash Return
2.8%
Cap rate
0.5%
Rent to Value Ratio
Active
$285,000
3
bds
|
3
ba
|
1,173
sqft
|
built
1999
2525 Sierra Bello Ave, Las Vegas, NV 89106
$-407
Cash flow
-7.5%
Cash-on-Cash Return
4.6%
Cap rate
0.7%
Rent to Value Ratio
Active
$579,000
5
bds
|
3
ba
|
2,678
sqft
|
built
2003
5915 Poplar Tree St, Las Vegas, NV 89148
$-1,602
Cash flow
-14.4%
Cash-on-Cash Return
3.0%
Cap rate
0.4%
Rent to Value Ratio
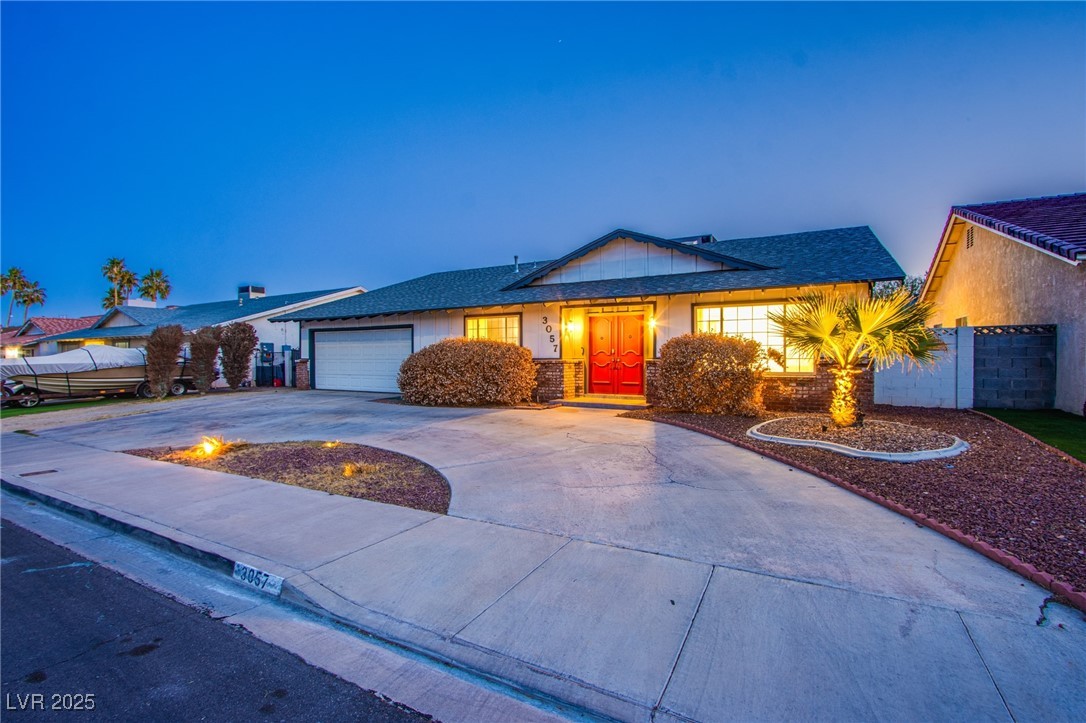
Active
$589,900
4
bds
|
3
ba
|
2,372
sqft
|
built
1975
3057 Downing Pl, Las Vegas, NV 89121
$-1,507
Cash flow
-13.3%
Cash-on-Cash Return
3.2%
Cap rate
0.4%
Rent to Value Ratio
Active
$636,000
3
bds
|
3
ba
|
2,494
sqft
|
built
2023
6225 Gambetta St, Las Vegas, NV 89115
$-2,174
Cash flow
-17.8%
Cash-on-Cash Return
2.2%
Cap rate
0.4%
Rent to Value Ratio

Active
$249,000
2
bds
|
2
ba
|
884
sqft
|
built
1988
4707 Nara Vista Way, Las Vegas, NV 89103
$-632
Cash flow
-13.2%
Cash-on-Cash Return
3.2%
Cap rate
0.6%
Rent to Value Ratio

Active
$25,000,000
5
bds
|
6
ba
|
4,929
sqft
|
built
2022
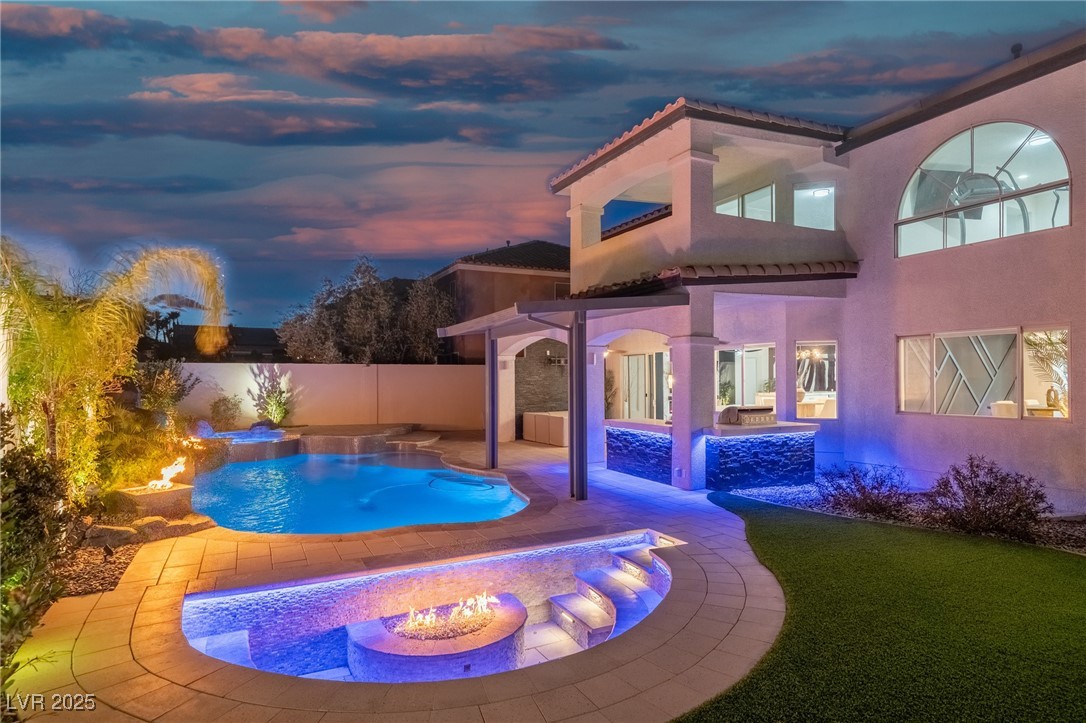
11660 Summit Club Dr, Las Vegas, NV 89135
$-133,973
Cash flow
-28.0%
Cash-on-Cash Return
-0.1%
Cap rate
0.0%
Rent to Value Ratio

Active
$385,000
3
bds
|
2
ba
|
1,030
sqft
|
built
1973
4512 Mark Ave, Las Vegas, NV 89108
$-884
Cash flow
-12.0%
Cash-on-Cash Return
3.5%
Cap rate
0.5%
Rent to Value Ratio
Active
$499,000
3
bds
|
3
ba
|
2,132
sqft
|
built
2011
10355 Sipple St, Las Vegas, NV 89141
$-1,389
Cash flow
-14.5%
Cash-on-Cash Return
3.0%
Cap rate
0.4%
Rent to Value Ratio
Active
$1,199,000
5
bds
|
5
ba
|
4,617
sqft
|
built
2007
5310 Marco Rossi Ct, Las Vegas, NV 89113
$-2,221
Cash flow
-9.7%
Cash-on-Cash Return
4.1%
Cap rate
0.6%
Rent to Value Ratio
Active
$148,000
1
bds
|
1
ba
|
688
sqft
|
built
1984
1701 E Katie Ave, Las Vegas, NV 89119
$-291
Cash flow
-10.3%
Cash-on-Cash Return
3.9%
Cap rate
0.7%
Rent to Value Ratio
Active
$959,000
6
bds
|
4
ba
|
4,476
sqft
|
built
2002
10825 Bernini Dr, Las Vegas, NV 89141
$-2,628
Cash flow
-14.3%
Cash-on-Cash Return
3.0%
Cap rate
0.5%
Rent to Value Ratio

Active
$3,490,000
5
bds
|
6
ba
|
6,351
sqft
|
built
2006
10923 Willow Heights Dr, Las Vegas, NV 89135
$-14,461
Cash flow
-21.6%
Cash-on-Cash Return
1.3%
Cap rate
0.3%
Rent to Value Ratio
Active
$489,000
4
bds
|
3
ba
|
2,578
sqft
|
built
2002
4929 Morning Falls Ave, Las Vegas, NV 89131
$-1,128
Cash flow
-12.0%
Cash-on-Cash Return
3.5%
Cap rate
0.5%
Rent to Value Ratio

Active
$415,000
3
bds
|
2
ba
|
1,528
sqft
|
built
2000
5582 Little Lake Ave, Las Vegas, NV 89122
$-1,155
Cash flow
-14.5%
Cash-on-Cash Return
2.9%
Cap rate
0.4%
Rent to Value Ratio
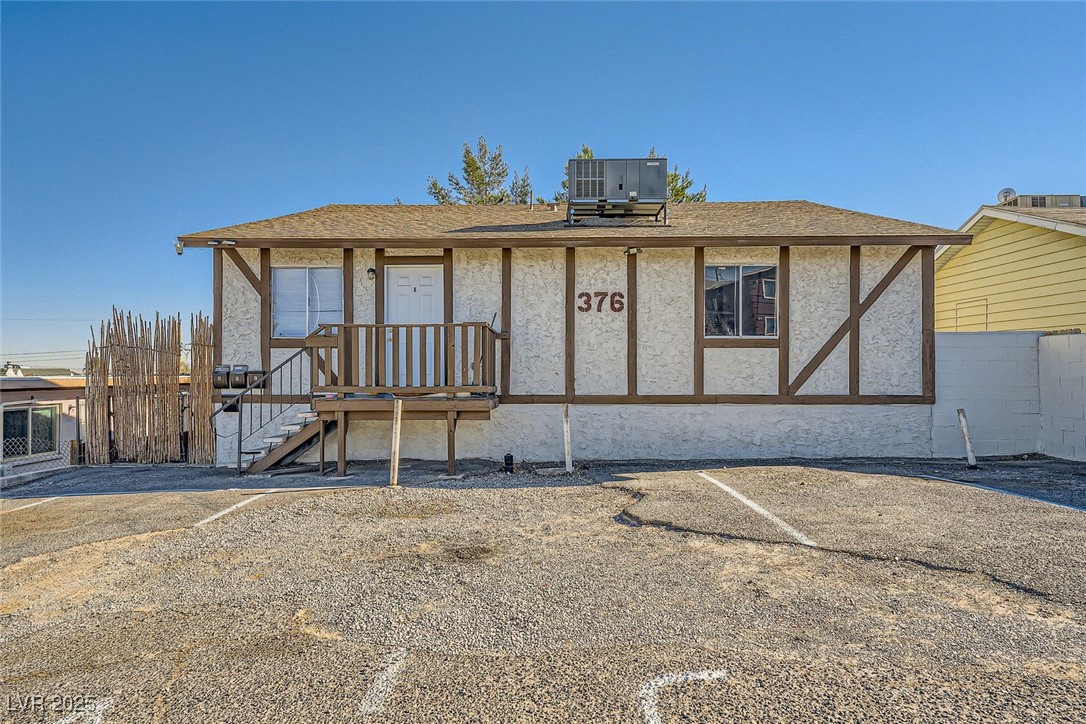
Active
$589,000
7
bds
|
0
ba
|
2,835
sqft
|
built
1982
376 N 15th St, Las Vegas, NV 89101
$-2,140
Cash flow
-19.0%
Cash-on-Cash Return
1.9%
Cap rate
0.3%
Rent to Value Ratio

Active
$860,000
5
bds
|
4
ba
|
4,066
sqft
|
built
1998
31 Castle Creek Ct, Las Vegas, NV 89148
$-2,489
Cash flow
-15.1%
Cash-on-Cash Return
2.8%
Cap rate
0.5%
Rent to Value Ratio
Active
$315,000
2
bds
|
3
ba
|
1,167
sqft
|
built
2005
9323 Leaping Deer Pl, Las Vegas, NV 89178
$-635
Cash flow
-10.5%
Cash-on-Cash Return
3.9%
Cap rate
0.6%
Rent to Value Ratio
Active
$3,988,888
4
bds
|
4
ba
|
3,027
sqft
|
built
1979
5353 Dorrell Ln, Las Vegas, NV 89131
$-15,357
Cash flow
-20.1%
Cash-on-Cash Return
1.7%
Cap rate
0.2%
Rent to Value Ratio
Active
$169,800
1
bds
|
1
ba
|
695
sqft
|
built
1998
5710 E Tropicana Ave, Las Vegas, NV 89122
$-425
Cash flow
-13.1%
Cash-on-Cash Return
3.3%
Cap rate
0.6%
Rent to Value Ratio
Active
$3,800,000
4
bds
|
5
ba
|
4,475
sqft
|
built
1970
2401 Driftwood Dr, Las Vegas, NV 89107
$-15,956
Cash flow
-21.9%
Cash-on-Cash Return
1.3%
Cap rate
0.2%
Rent to Value Ratio
Active
$450,000
4
bds
|
3
ba
|
2,172
sqft
|
built
1987
5458 Walton Heath Ave, Las Vegas, NV 89142
$-570
Cash flow
-6.6%
Cash-on-Cash Return
4.8%
Cap rate
0.6%
Rent to Value Ratio
Active
$1,990,000
4
bds
|
2
ba
|
2,612
sqft
|
built
1979
6010 Annie Oakley Dr, Las Vegas, NV 89120
$-8,023
Cash flow
-21.0%
Cash-on-Cash Return
1.5%
Cap rate
0.2%
Rent to Value Ratio
Active
$272,000
2
bds
|
2
ba
|
1,137
sqft
|
built
1992
6836 Elm Creek Dr, Las Vegas, NV 89108
$-638
Cash flow
-12.2%
Cash-on-Cash Return
3.5%
Cap rate
0.6%
Rent to Value Ratio
Active
$1,375,000
4
bds
|
3
ba
|
4,039
sqft
|
built
1987
2504 Windjammer Way, Las Vegas, NV 89107
$-4,009
Cash flow
-15.2%
Cash-on-Cash Return
2.8%
Cap rate
0.4%
Rent to Value Ratio
Active
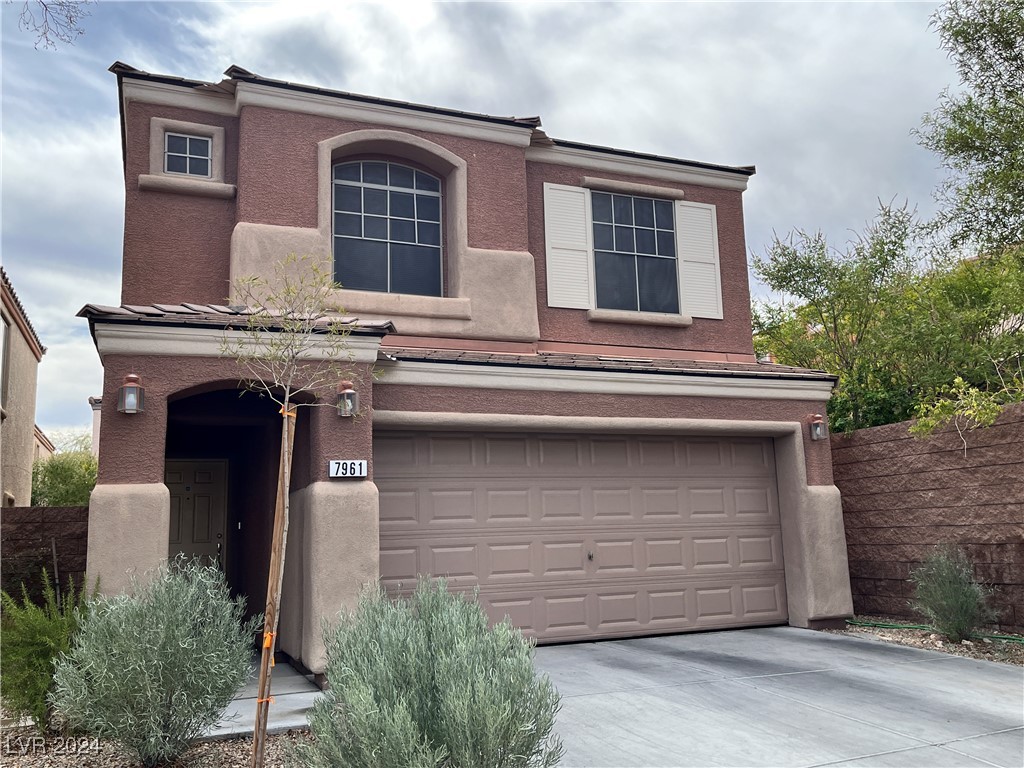
$435,000
4
bds
|
3
ba
|
1,686
sqft
|
built
2007
7961 Alta Lima Valley Ct, Las Vegas, NV 89178
$-1,047
Cash flow
-12.6%
Cash-on-Cash Return
3.4%
Cap rate
0.5%
Rent to Value Ratio
Active
$245,000
2
bds
|
2
ba
|
884
sqft
|
built
1989
4812 Nara Vista Way, Las Vegas, NV 89103
$-653
Cash flow
-13.9%
Cash-on-Cash Return
3.1%
Cap rate
0.5%
Rent to Value Ratio
Active
$1,495,000
6
bds
|
7
ba
|
5,347
sqft
|
built
1999
9917 Aspen Knoll Ct, Las Vegas, NV 89117
$-4,605
Cash flow
-16.1%
Cash-on-Cash Return
2.6%
Cap rate
0.4%
Rent to Value Ratio
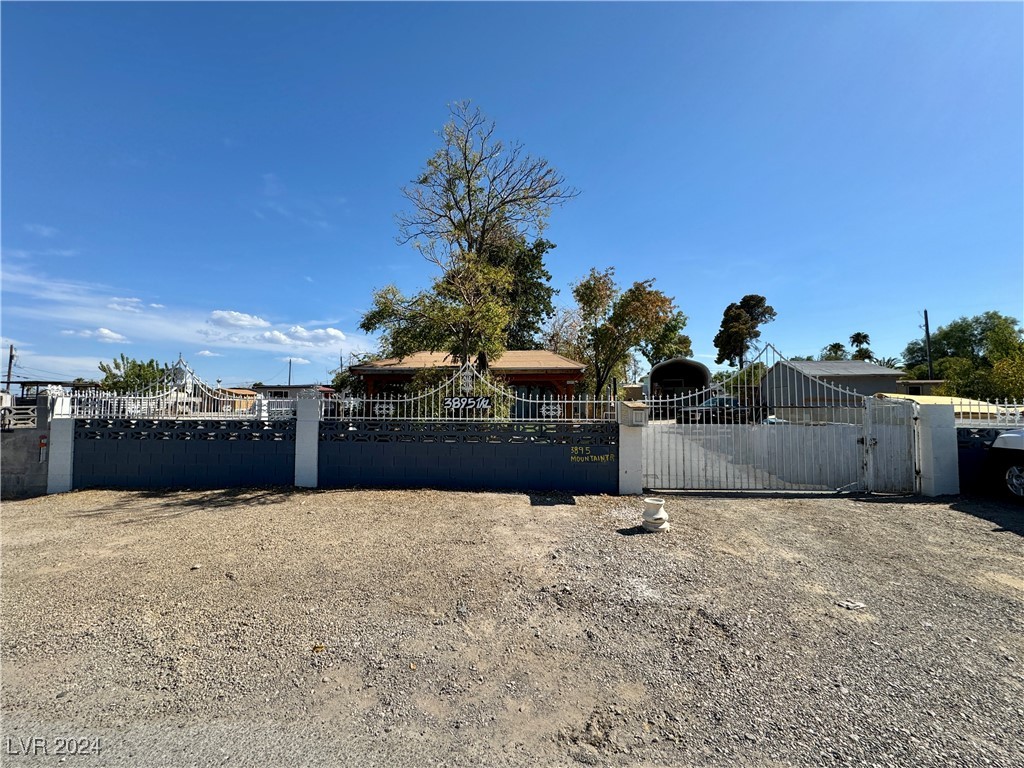
Active
$399,900
4
bds
|
3
ba
|
1,773
sqft
|
built
1957
3895 Mountain Trl, Las Vegas, NV 89108
$-679
Cash flow
-8.9%
Cash-on-Cash Return
4.3%
Cap rate
0.6%
Rent to Value Ratio
Active
$420,000
4
bds
|
3
ba
|
1,650
sqft
|
built
2007
1169 Nightmoss Ave, Las Vegas, NV 89183
$-831
Cash flow
-10.3%
Cash-on-Cash Return
3.9%
Cap rate
0.5%
Rent to Value Ratio
Active
$770,000
4
bds
|
3
ba
|
2,253
sqft
|
built
1984
445 Sari Dr, Las Vegas, NV 89110
$-1,148
Cash flow
-7.8%
Cash-on-Cash Return
4.5%
Cap rate
0.6%
Rent to Value Ratio