Las Vegas, NV Investment Properties for Sale
Browse homes for sale and investment properties in Las Vegas, NV. Refine your search by price, property type, or more.
Best cash flowing properties in Las Vegas, NV

Active
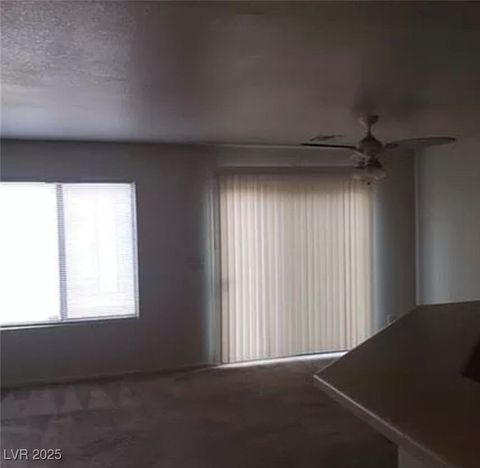
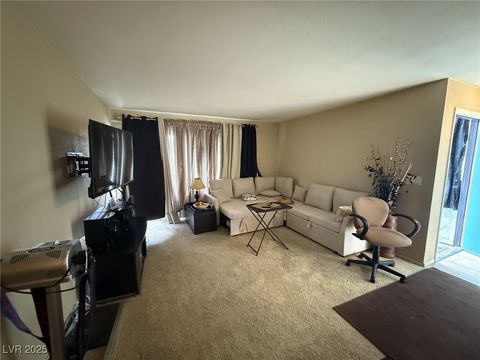
$158,888
1
bds
|
1
ba
|
569
sqft
|
built
1994
4855 S Torrey Pines Dr, Las Vegas, NV 89103
$-263
Cash flow
-8.6%
Cash-on-Cash Return
4.3%
Cap rate
0.8%
Rent to Value Ratio
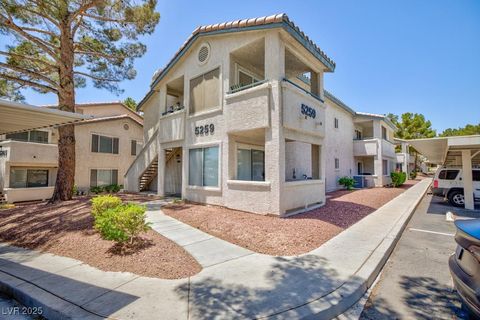
Active
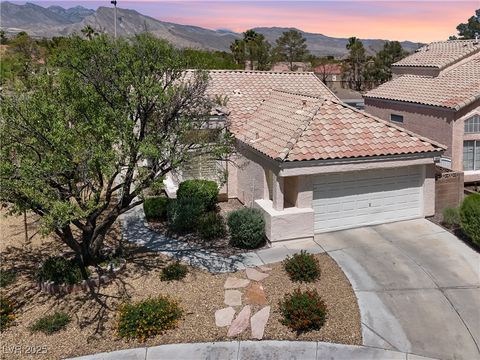
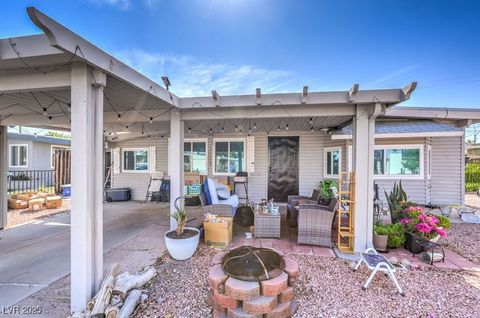
$179,999
1
bds
|
1
ba
|
705
sqft
|
built
1994
5259 Caspian Springs Dr, Las Vegas, NV 89120
$-534
Cash flow
-15.5%
Cash-on-Cash Return
2.7%
Cap rate
0.6%
Rent to Value Ratio
6,262 out of 6,395 properties for sale in Las Vegas, NV
Limited Results Shown
Create a free account, or log in to reveal all property listings and enjoy the complete experience.
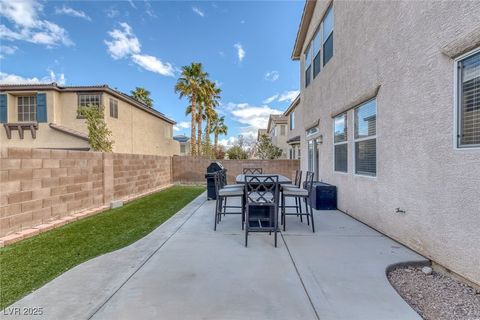
Active
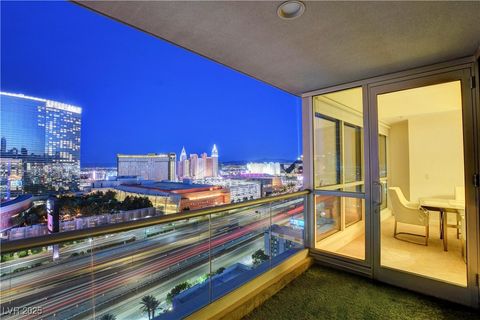
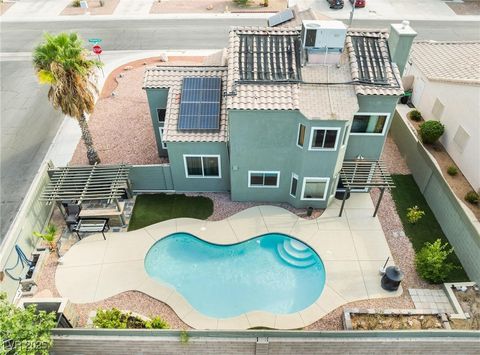
$529,999
4
bds
|
3
ba
|
2,460
sqft
|
built
2002
3964 Irvin Ave, Las Vegas, NV 89141
$-1,448
Cash flow
-14.3%
Cash-on-Cash Return
3.0%
Cap rate
0.4%
Rent to Value Ratio
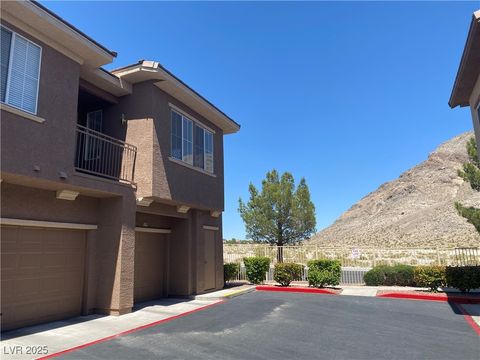
Active
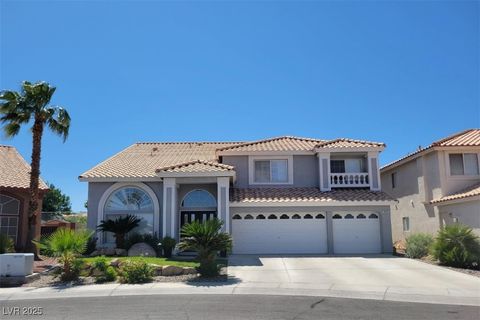
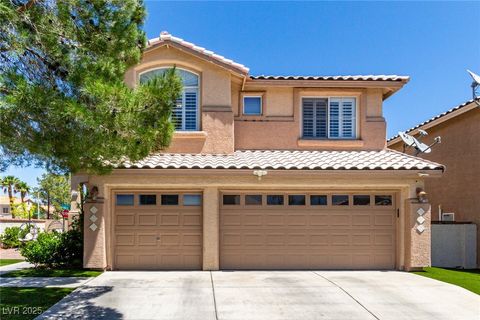
$315,000
2
bds
|
2
ba
|
1,260
sqft
|
built
2003
10190 Deerfield Beach Ave, Las Vegas, NV 89129
$-906
Cash flow
-15.0%
Cash-on-Cash Return
2.8%
Cap rate
0.5%
Rent to Value Ratio
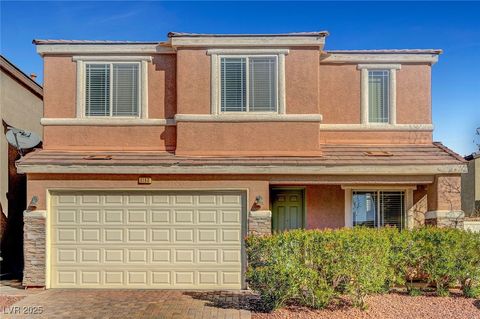
Active
$464,000
3
bds
|
3
ba
|
2,051
sqft
|
built
2005
6190 Tillman Crest Ave, Las Vegas, NV 89139
$-1,262
Cash flow
-14.2%
Cash-on-Cash Return
3.0%
Cap rate
0.5%
Rent to Value Ratio
Active
$435,000
3
bds
|
2
ba
|
1,202
sqft
|
built
1973
4194 Greenpoint St, Las Vegas, NV 89147
$-1,134
Cash flow
-13.6%
Cash-on-Cash Return
3.1%
Cap rate
0.4%
Rent to Value Ratio
Active
$399,000
3
bds
|
3
ba
|
1,497
sqft
|
built
2009
6087 Devers Ct, Las Vegas, NV 89118
$-1,039
Cash flow
-13.6%
Cash-on-Cash Return
3.1%
Cap rate
0.5%
Rent to Value Ratio
Active
$440,000
2
bds
|
2
ba
|
1,404
sqft
|
built
1989
7641 Sea Wind Dr, Las Vegas, NV 89128
$-1,224
Cash flow
-14.5%
Cash-on-Cash Return
2.9%
Cap rate
0.5%
Rent to Value Ratio

Active
$375,000
2
bds
|
2
ba
|
1,396
sqft
|
built
2004
8212 Calico Wind St, Las Vegas, NV 89131
$-784
Cash flow
-10.9%
Cash-on-Cash Return
3.8%
Cap rate
0.5%
Rent to Value Ratio
Active
$399,900
3
bds
|
2
ba
|
1,073
sqft
|
built
1963
3013 Piedmont Ave, Las Vegas, NV 89102
$-1,100
Cash flow
-14.4%
Cash-on-Cash Return
3.0%
Cap rate
0.4%
Rent to Value Ratio
Active
$447,000
4
bds
|
3
ba
|
2,172
sqft
|
built
1987
5458 Walton Heath Ave, Las Vegas, NV 89142
$-545
Cash flow
-6.4%
Cash-on-Cash Return
4.8%
Cap rate
0.6%
Rent to Value Ratio
Active
$1,045,000
4
bds
|
5
ba
|
3,743
sqft
|
built
2004
5210 Villa Dante Ave, Las Vegas, NV 89141
$-3,593
Cash flow
-17.9%
Cash-on-Cash Return
2.1%
Cap rate
0.3%
Rent to Value Ratio

Active
$739,900
4
bds
|
3
ba
|
2,424
sqft
|
built
2003
452 Crocus Hill St, Las Vegas, NV 89138
$-2,631
Cash flow
-18.6%
Cash-on-Cash Return
2.0%
Cap rate
0.3%
Rent to Value Ratio
Active
$5,749,999
8
bds
|
6
ba
|
7,766
sqft
|
built
1981
2818 E Quail Ave, Las Vegas, NV 89120
$-23,029
Cash flow
-20.9%
Cash-on-Cash Return
1.5%
Cap rate
0.2%
Rent to Value Ratio

Active
$854,900
5
bds
|
4
ba
|
2,576
sqft
|
built
1977
2784 Belcastro St, Las Vegas, NV 89117
$-3,189
Cash flow
-19.5%
Cash-on-Cash Return
1.8%
Cap rate
0.3%
Rent to Value Ratio
Active
$469,000
3
bds
|
2
ba
|
1,740
sqft
|
built
2007
6247 Sugartree Ave, Las Vegas, NV 89141
$-1,062
Cash flow
-11.8%
Cash-on-Cash Return
3.5%
Cap rate
0.5%
Rent to Value Ratio
Active
$434,900
3
bds
|
3
ba
|
1,462
sqft
|
built
2003
4732 Lone Grove Dr, Las Vegas, NV 89139
$-1,192
Cash flow
-14.3%
Cash-on-Cash Return
3.0%
Cap rate
0.4%
Rent to Value Ratio
Active
$389,900
2
bds
|
2
ba
|
1,093
sqft
|
built
1989
3053 Anchor Chain Dr, Las Vegas, NV 89128
$-1,093
Cash flow
-14.6%
Cash-on-Cash Return
2.9%
Cap rate
0.5%
Rent to Value Ratio
Active
$995,000
2
bds
|
3
ba
|
1,821
sqft
|
built
2006
4525 Dean Martin Dr, Las Vegas, NV 89103
$-4,203
Cash flow
-22.0%
Cash-on-Cash Return
1.2%
Cap rate
0.4%
Rent to Value Ratio
Active
$699,999
5
bds
|
3
ba
|
3,215
sqft
|
built
1999
3805 White Castle St, Las Vegas, NV 89129
$-1,833
Cash flow
-13.7%
Cash-on-Cash Return
3.1%
Cap rate
0.4%
Rent to Value Ratio
Active
$264,000
3
bds
|
2
ba
|
1,266
sqft
|
built
1980
1455 E Katie Ave, Las Vegas, NV 89119
$-811
Cash flow
-16.0%
Cash-on-Cash Return
2.6%
Cap rate
0.5%
Rent to Value Ratio
Active
$379,000
4
bds
|
2
ba
|
1,424
sqft
|
built
1959
309 Wisteria Ave, Las Vegas, NV 89107
$-680
Cash flow
-9.4%
Cash-on-Cash Return
4.1%
Cap rate
0.5%
Rent to Value Ratio
Active
$554,900
4
bds
|
3
ba
|
1,837
sqft
|
built
1994
6112 Browning Way, Las Vegas, NV 89130
$-1,094
Cash flow
-10.3%
Cash-on-Cash Return
3.9%
Cap rate
0.5%
Rent to Value Ratio
Active
$815,000
5
bds
|
3
ba
|
2,718
sqft
|
built
1995
9440 Grenville Ave, Las Vegas, NV 89134
$-2,492
Cash flow
-16.0%
Cash-on-Cash Return
2.6%
Cap rate
0.4%
Rent to Value Ratio
Active
$255,000
2
bds
|
2
ba
|
1,105
sqft
|
built
1987
5121 Pioneer Ave, Las Vegas, NV 89146
$-640
Cash flow
-13.1%
Cash-on-Cash Return
3.3%
Cap rate
0.5%
Rent to Value Ratio
Active
$875,000
4
bds
|
3
ba
|
3,084
sqft
|
built
2004
6779 Rainstorm Ridge Ave, Las Vegas, NV 89131
$-2,542
Cash flow
-15.2%
Cash-on-Cash Return
2.8%
Cap rate
0.4%
Rent to Value Ratio
Active
$525,000
4
bds
|
2
ba
|
1,851
sqft
|
built
1995
5704 Owl Butte Ct, Las Vegas, NV 89149
$-1,345
Cash flow
-13.4%
Cash-on-Cash Return
3.2%
Cap rate
0.4%
Rent to Value Ratio
Active
$824,999
5
bds
|
3
ba
|
4,064
sqft
|
built
2005
8516 Canyon Ranch St, Las Vegas, NV 89131
$-2,324
Cash flow
-14.7%
Cash-on-Cash Return
2.9%
Cap rate
0.4%
Rent to Value Ratio
Active
$249,900
2
bds
|
2
ba
|
895
sqft
|
built
2000
9470 Peace Way, Las Vegas, NV 89147
$-665
Cash flow
-13.9%
Cash-on-Cash Return
3.1%
Cap rate
0.6%
Rent to Value Ratio
Active
$254,500
2
bds
|
2
ba
|
1,019
sqft
|
built
1998
8501 W University Ave, Las Vegas, NV 89147
$-647
Cash flow
-13.3%
Cash-on-Cash Return
3.2%
Cap rate
0.6%
Rent to Value Ratio
Active
$409,900
2
bds
|
2
ba
|
1,308
sqft
|
built
1994
4911 Mount Pleasant Ln, Las Vegas, NV 89113
$-1,607
Cash flow
-20.5%
Cash-on-Cash Return
1.6%
Cap rate
0.6%
Rent to Value Ratio
Active
$179,999
1
bds
|
1
ba
|
705
sqft
|
built
1994
5259 Caspian Springs Dr, Las Vegas, NV 89120
$-534
Cash flow
-15.5%
Cash-on-Cash Return
2.7%
Cap rate
0.6%
Rent to Value Ratio
Active
$725,000
8
bds
|
0
ba
|
3,420
sqft
|
built
1981
4150 Solteros St, Las Vegas, NV 89103
$-2,599
Cash flow
-18.7%
Cash-on-Cash Return
2.0%
Cap rate
0.3%
Rent to Value Ratio

Active
$279,000
2
bds
|
2
ba
|
1,034
sqft
|
built
1997
5250 S Rainbow Blvd, Las Vegas, NV 89118
$-1,015
Cash flow
-19.0%
Cash-on-Cash Return
1.9%
Cap rate
0.5%
Rent to Value Ratio
Active
$450,000
4
bds
|
3
ba
|
1,896
sqft
|
built
2016
7919 Mineral Peak St, Las Vegas, NV 89166
$-1,030
Cash flow
-11.9%
Cash-on-Cash Return
3.5%
Cap rate
0.6%
Rent to Value Ratio
Active
$595,000
4
bds
|
3
ba
|
2,461
sqft
|
built
2014
152 Walkinshaw Ave, Las Vegas, NV 89148
$-2,021
Cash flow
-17.7%
Cash-on-Cash Return
2.2%
Cap rate
0.4%
Rent to Value Ratio
Active
$158,888
1
bds
|
1
ba
|
569
sqft
|
built
1994
4855 S Torrey Pines Dr, Las Vegas, NV 89103
$-263
Cash flow
-8.6%
Cash-on-Cash Return
4.3%
Cap rate
0.8%
Rent to Value Ratio
Active
$1,395,000
3
bds
|
3
ba
|
2,160
sqft
|
built
2001
2822 Soft Horizon Way, Las Vegas, NV 89135
$-4,308
Cash flow
-16.1%
Cash-on-Cash Return
2.6%
Cap rate
0.4%
Rent to Value Ratio

Active
$699,900
4
bds
|
3
ba
|
2,469
sqft
|
built
1991
614 Ravenglen Dr, Las Vegas, NV 89123
$-1,944
Cash flow
-14.5%
Cash-on-Cash Return
2.9%
Cap rate
0.4%
Rent to Value Ratio
Active
$259,900
3
bds
|
2
ba
|
1,109
sqft
|
built
1989
3151 Soaring Gulls Dr, Las Vegas, NV 89128
$-886
Cash flow
-17.8%
Cash-on-Cash Return
2.2%
Cap rate
0.5%
Rent to Value Ratio
Active
$249,900
2
bds
|
2
ba
|
1,074
sqft
|
built
1989
3151 Soaring Gulls Dr, Las Vegas, NV 89128
$-902
Cash flow
-18.8%
Cash-on-Cash Return
1.9%
Cap rate
0.5%
Rent to Value Ratio

Active
$875,000
5
bds
|
4
ba
|
3,304
sqft
|
built
1995
8904 Saint Pierre Dr, Las Vegas, NV 89134
$-1,488
Cash flow
-8.9%
Cash-on-Cash Return
4.2%
Cap rate
0.6%
Rent to Value Ratio