Las Vegas, NV Investment Properties for Sale
Browse homes for sale and investment properties in Las Vegas, NV. Refine your search by price, property type, or more.
Best cash flowing properties in Las Vegas, NV
Pending
$168,000
2
bds
|
2
ba
|
974
sqft
|
built
2000
4730 E Craig Rd, Las Vegas, NV 89115
$-344
Cash flow
-10.7%
Cash-on-Cash Return
3.8%
Cap rate
0.7%
Rent to Value Ratio
Active
$185,000
2
bds
|
2
ba
|
945
sqft
|
built
1985
1846 N Decatur Blvd, Las Vegas, NV 89108
$-374
Cash flow
-10.5%
Cash-on-Cash Return
3.9%
Cap rate
0.7%
Rent to Value Ratio
5,456 out of 5,583 properties for sale in Las Vegas, NV
Limited Results Shown
Create a free account, or log in to reveal all property listings and enjoy the complete experience.
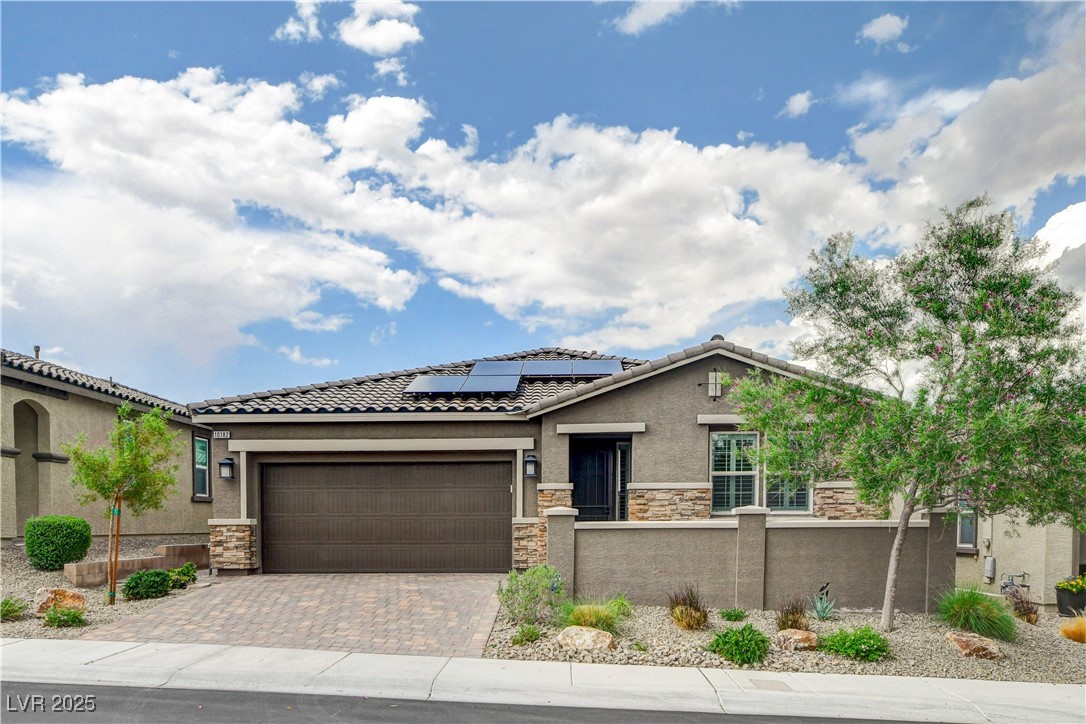
Active
$597,000
3
bds
|
2
ba
|
1,939
sqft
|
built
2020
10182 Skye Run Ave, Las Vegas, NV 89166
$-1,493
Cash flow
-13.0%
Cash-on-Cash Return
3.3%
Cap rate
0.5%
Rent to Value Ratio
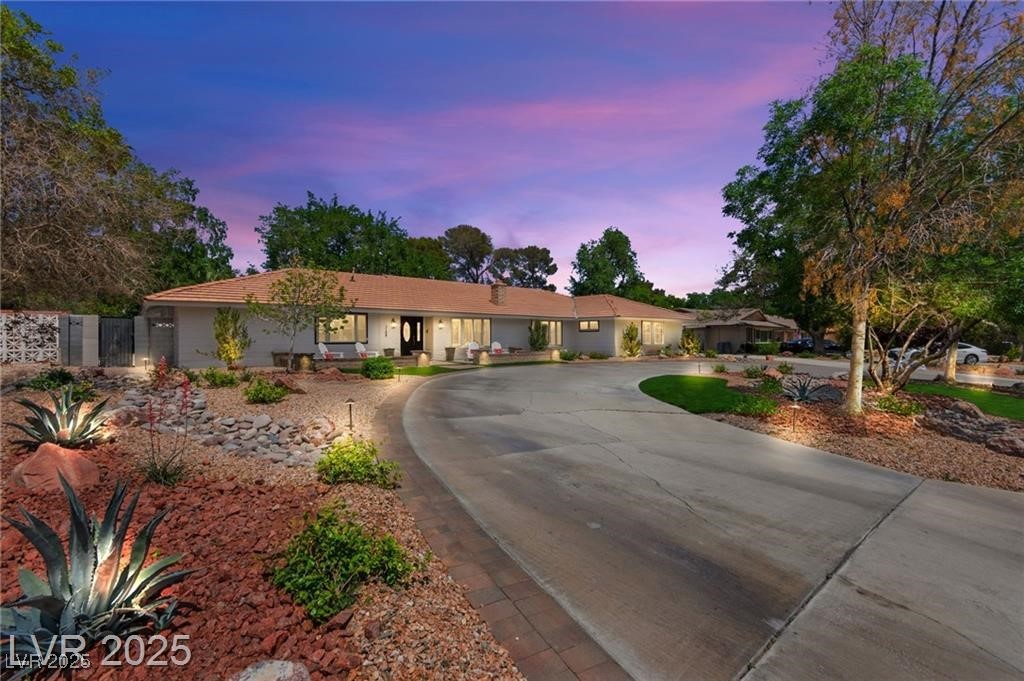
Active
$1,699,999
5
bds
|
5
ba
|
4,583
sqft
|
built
1966
3108 Sonia Dr, Las Vegas, NV 89107
$-6,489
Cash flow
-19.9%
Cash-on-Cash Return
1.7%
Cap rate
0.3%
Rent to Value Ratio
Active
$494,000
4
bds
|
3
ba
|
1,946
sqft
|
built
1990
7625 Raven Hills Dr, Las Vegas, NV 89149
$-1,333
Cash flow
-14.1%
Cash-on-Cash Return
3.0%
Cap rate
0.4%
Rent to Value Ratio
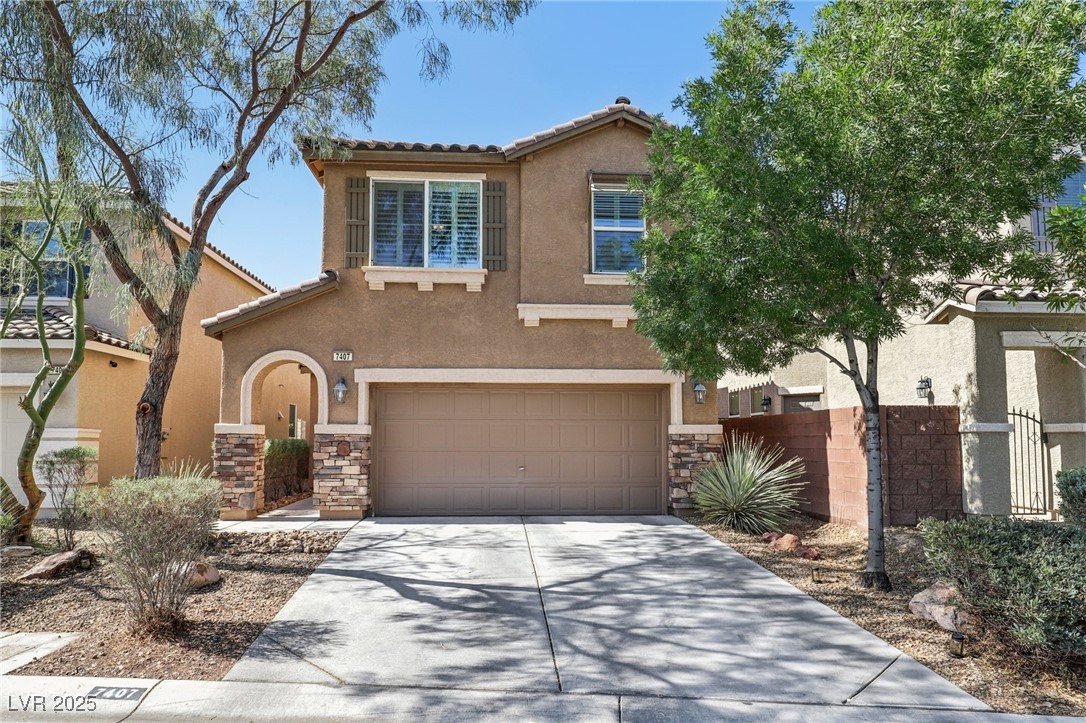
Active
$465,000
3
bds
|
3
ba
|
1,920
sqft
|
built
2013
7407 Bakewell Ave, Las Vegas, NV 89179
$-1,280
Cash flow
-14.4%
Cash-on-Cash Return
3.0%
Cap rate
0.5%
Rent to Value Ratio
Active
$304,999
1
bds
|
1
ba
|
534
sqft
|
built
2006
2000 N Fashion Show Dr, Las Vegas, NV 89109
$-1,183
Cash flow
-20.2%
Cash-on-Cash Return
1.6%
Cap rate
0.7%
Rent to Value Ratio
Pending
$299,900
2
bds
|
2
ba
|
1,273
sqft
|
built
2007
32 E Serene Ave, Las Vegas, NV 89123
$-972
Cash flow
-16.9%
Cash-on-Cash Return
2.4%
Cap rate
0.5%
Rent to Value Ratio
Pending
$440,000
3
bds
|
2
ba
|
1,542
sqft
|
built
2019
4544 Velvet Oak Ct, Las Vegas, NV 89115
$-1,076
Cash flow
-12.8%
Cash-on-Cash Return
3.3%
Cap rate
0.5%
Rent to Value Ratio
Pending
$1,050,000
4
bds
|
4
ba
|
3,114
sqft
|
built
1999
905 Star Pine Dr, Las Vegas, NV 89144
$-3,370
Cash flow
-16.7%
Cash-on-Cash Return
2.4%
Cap rate
0.4%
Rent to Value Ratio
Pending
$168,000
2
bds
|
2
ba
|
974
sqft
|
built
2000
4730 E Craig Rd, Las Vegas, NV 89115
$-344
Cash flow
-10.7%
Cash-on-Cash Return
3.8%
Cap rate
0.7%
Rent to Value Ratio
Active
$409,000
1
bds
|
2
ba
|
814
sqft
|
built
2007
222 Karen Ave, Las Vegas, NV 89109
$-1,581
Cash flow
-20.2%
Cash-on-Cash Return
1.6%
Cap rate
0.6%
Rent to Value Ratio
Active
$725,000
3
bds
|
3
ba
|
2,173
sqft
|
built
2008
913 Hickory Park St, Las Vegas, NV 89138
$-2,087
Cash flow
-15.0%
Cash-on-Cash Return
2.8%
Cap rate
0.4%
Rent to Value Ratio
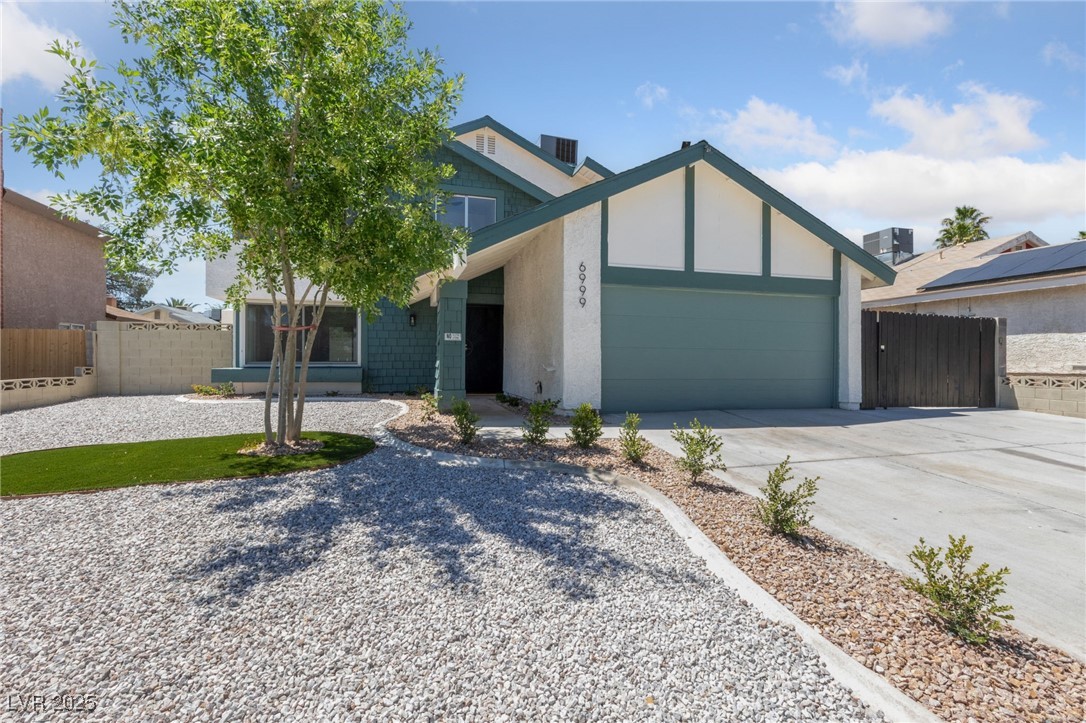
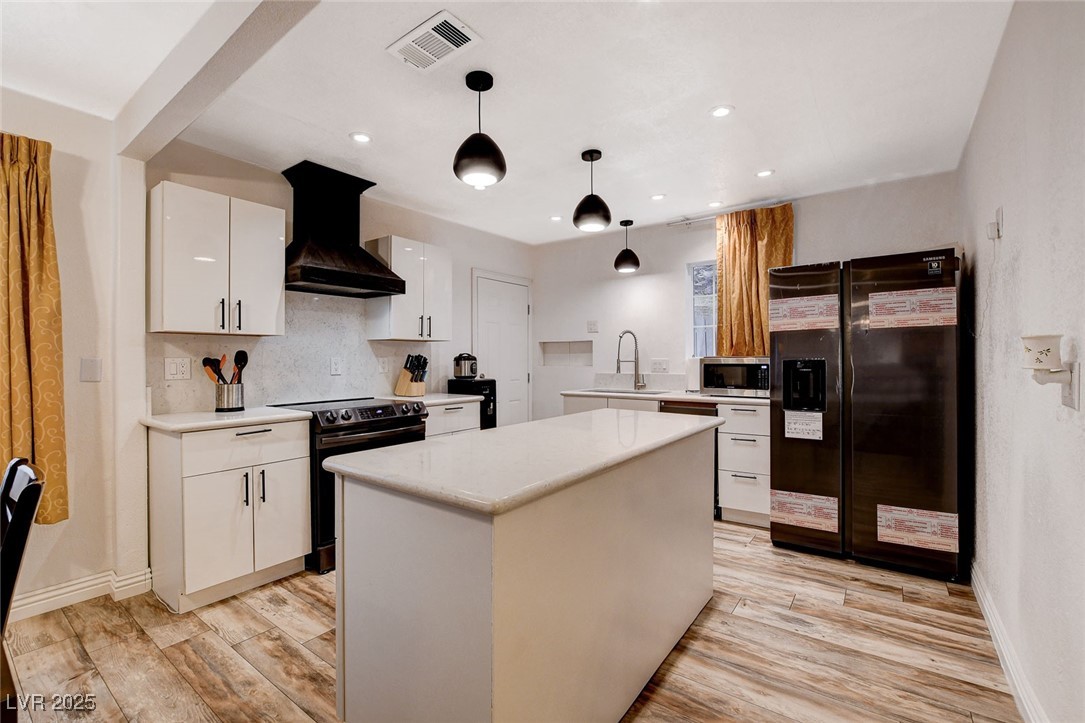
Active
$525,000
4
bds
|
3
ba
|
1,638
sqft
|
built
1979
6999 Montcliff Ave, Las Vegas, NV 89147
$-1,356
Cash flow
-13.5%
Cash-on-Cash Return
3.2%
Cap rate
0.4%
Rent to Value Ratio
Active
$347,000
3
bds
|
1
ba
|
1,068
sqft
|
built
1944
1414 S 13th St, Las Vegas, NV 89104
$-496
Cash flow
-7.5%
Cash-on-Cash Return
4.6%
Cap rate
0.6%
Rent to Value Ratio
Active
$245,000
2
bds
|
2
ba
|
1,131
sqft
|
built
1996
9000 Las Vegas Blvd S, Las Vegas, NV 89123
$-720
Cash flow
-15.3%
Cash-on-Cash Return
2.8%
Cap rate
0.6%
Rent to Value Ratio
Active
$450,000
4
bds
|
2
ba
|
2,983
sqft
|
built
1964
1674 Seneca Ln, Las Vegas, NV 89169
$-567
Cash flow
-6.6%
Cash-on-Cash Return
4.8%
Cap rate
0.6%
Rent to Value Ratio
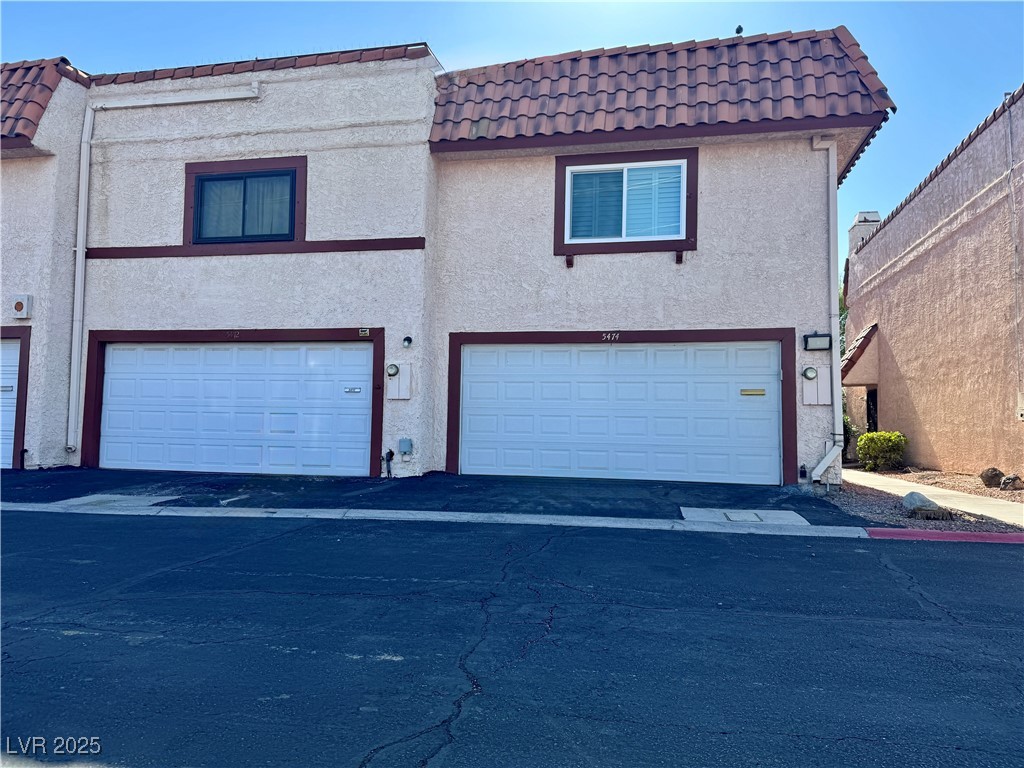
Active
$319,999
2
bds
|
3
ba
|
1,440
sqft
|
built
1980
5474 S Maryland Pkwy, Las Vegas, NV 89119
$-656
Cash flow
-10.7%
Cash-on-Cash Return
3.8%
Cap rate
0.6%
Rent to Value Ratio
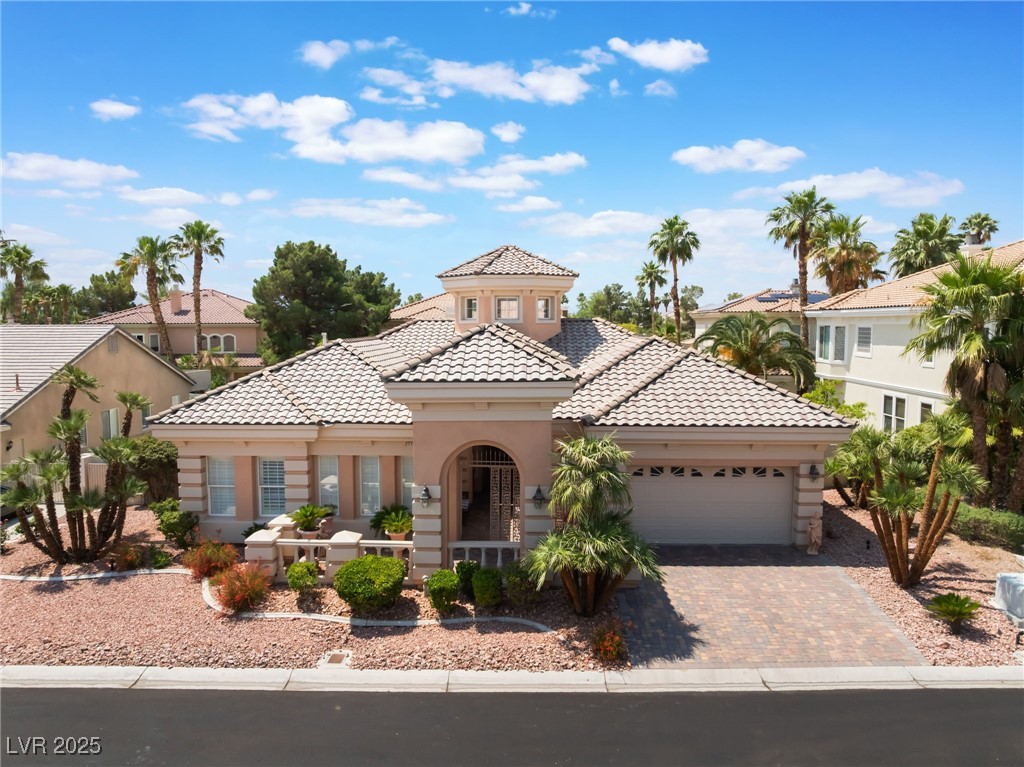
Active
$1,195,000
3
bds
|
3
ba
|
3,540
sqft
|
built
1998
277 Dark Forest Ave, Las Vegas, NV 89123
$-2,594
Cash flow
-11.3%
Cash-on-Cash Return
3.7%
Cap rate
0.5%
Rent to Value Ratio
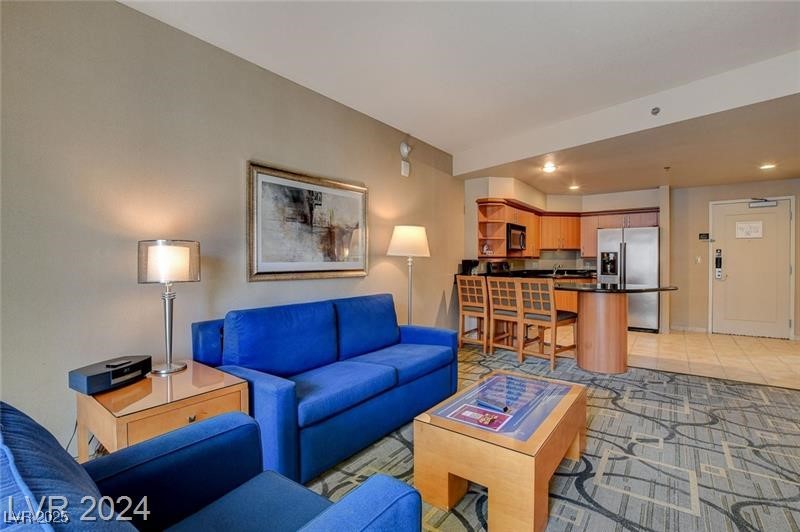
Active
$245,000
1
bds
|
1
ba
|
739
sqft
|
built
2006
211 E Flamingo Rd, Las Vegas, NV 89169
$-830
Cash flow
-17.7%
Cash-on-Cash Return
2.2%
Cap rate
0.7%
Rent to Value Ratio
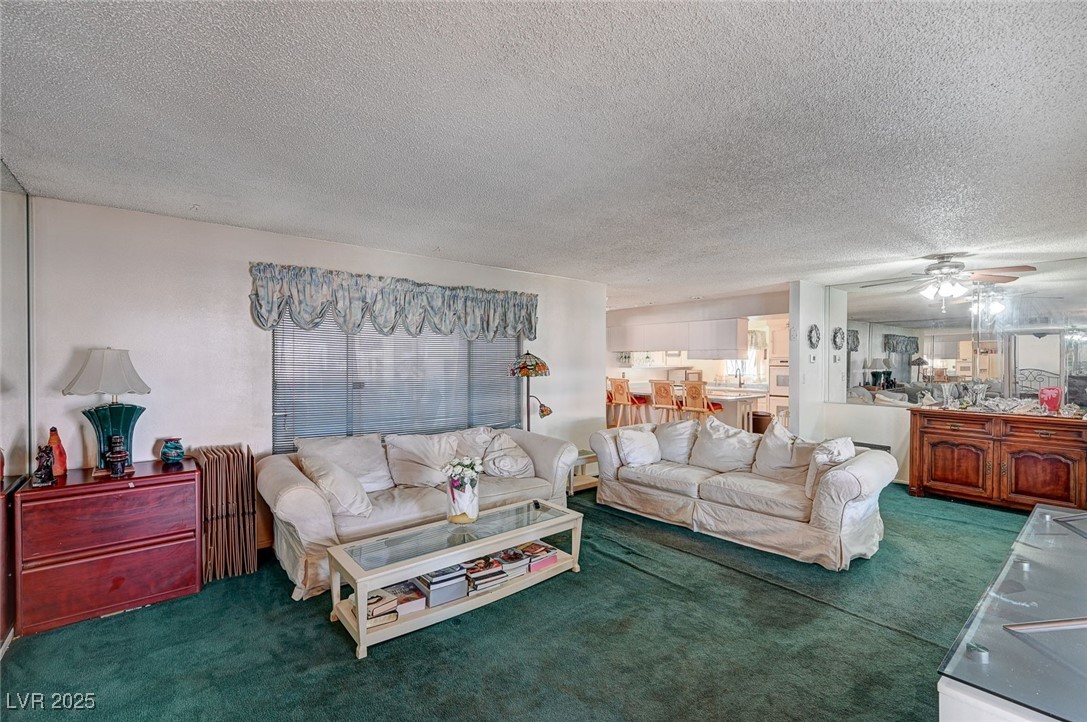
Active under contract
$410,000
3
bds
|
3
ba
|
2,131
sqft
|
built
1963
2325 Sombrero Dr, Las Vegas, NV 89169
$-762
Cash flow
-9.7%
Cash-on-Cash Return
4.1%
Cap rate
0.5%
Rent to Value Ratio
Active
$569,000
4
bds
|
3
ba
|
2,323
sqft
|
built
2001
5586 Golden Leaf Ave, Las Vegas, NV 89122
$-1,597
Cash flow
-14.6%
Cash-on-Cash Return
2.9%
Cap rate
0.4%
Rent to Value Ratio
Pending
$489,000
4
bds
|
3
ba
|
2,523
sqft
|
built
2001
9879 Jazzy June St, Las Vegas, NV 89183
$-1,076
Cash flow
-11.5%
Cash-on-Cash Return
3.6%
Cap rate
0.5%
Rent to Value Ratio
Active
$2,560,000
4
bds
|
5
ba
|
4,290
sqft
|
built
2019
11015 Sanctuary Cove Ct, Las Vegas, NV 89135
$-7,302
Cash flow
-14.9%
Cash-on-Cash Return
2.9%
Cap rate
0.4%
Rent to Value Ratio
Active
$658,800
8
bds
|
0
ba
|
3,660
sqft
|
built
1951
1707 Santa Paula Dr, Las Vegas, NV 89104
$-2,354
Cash flow
-18.6%
Cash-on-Cash Return
2.0%
Cap rate
0.3%
Rent to Value Ratio
Active
$429,999
3
bds
|
2
ba
|
1,207
sqft
|
built
1987
116 Lotus Blossom Ct, Las Vegas, NV 89145
$-1,117
Cash flow
-13.6%
Cash-on-Cash Return
3.2%
Cap rate
0.4%
Rent to Value Ratio
Active
$795,000
5
bds
|
5
ba
|
4,147
sqft
|
built
2018
8565 Silver Coast St, Las Vegas, NV 89139
$-2,278
Cash flow
-14.9%
Cash-on-Cash Return
2.8%
Cap rate
0.5%
Rent to Value Ratio
Active
$170,000
2
bds
|
2
ba
|
884
sqft
|
built
1987
2986 Juniper Hills Blvd, Las Vegas, NV 89142
$-374
Cash flow
-11.5%
Cash-on-Cash Return
3.6%
Cap rate
0.7%
Rent to Value Ratio
Active
$699,000
5
bds
|
4
ba
|
3,088
sqft
|
built
2021
7502 Lush Oasis Ave, Las Vegas, NV 89113
$-2,194
Cash flow
-16.4%
Cash-on-Cash Return
2.5%
Cap rate
0.4%
Rent to Value Ratio
Active
$775,000
3
bds
|
3
ba
|
2,169
sqft
|
built
1997
9308 Pitching Wedge Dr, Las Vegas, NV 89134
$-2,603
Cash flow
-17.5%
Cash-on-Cash Return
2.3%
Cap rate
0.4%
Rent to Value Ratio
Active
$295,000
bds
|
1
ba
|
520
sqft
|
built
2006
135 E Harmon Ave, Las Vegas, NV 89109
$-1,738
Cash flow
-30.7%
Cash-on-Cash Return
-0.8%
Cap rate
0.7%
Rent to Value Ratio
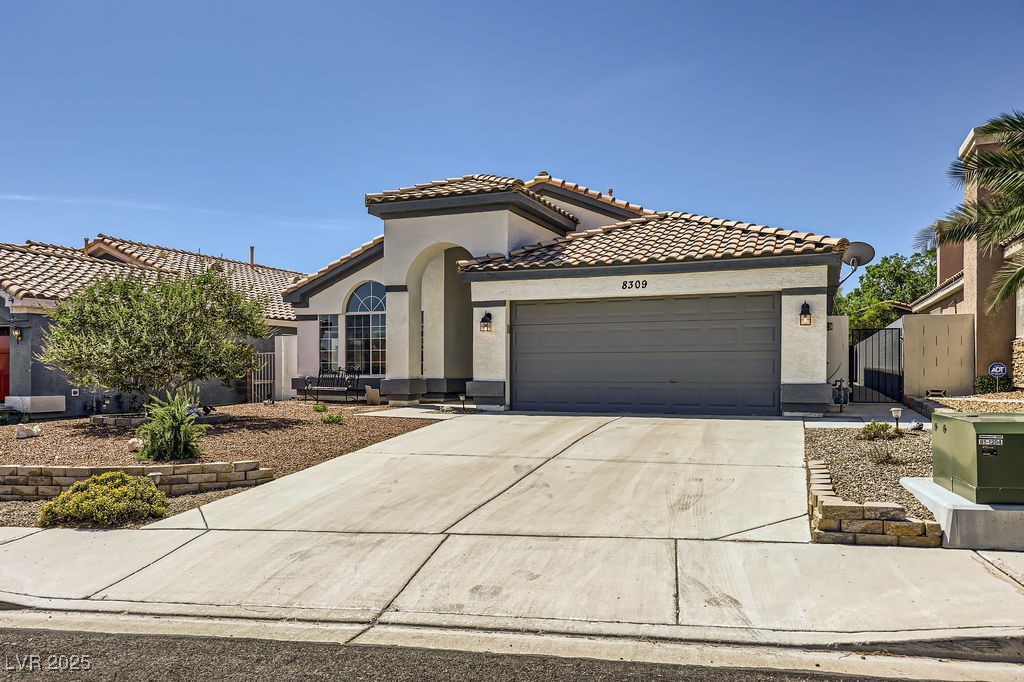
Active
$509,000
3
bds
|
2
ba
|
1,770
sqft
|
built
1994
8309 Windrush Ave, Las Vegas, NV 89117
$-1,467
Cash flow
-15.0%
Cash-on-Cash Return
2.8%
Cap rate
0.4%
Rent to Value Ratio
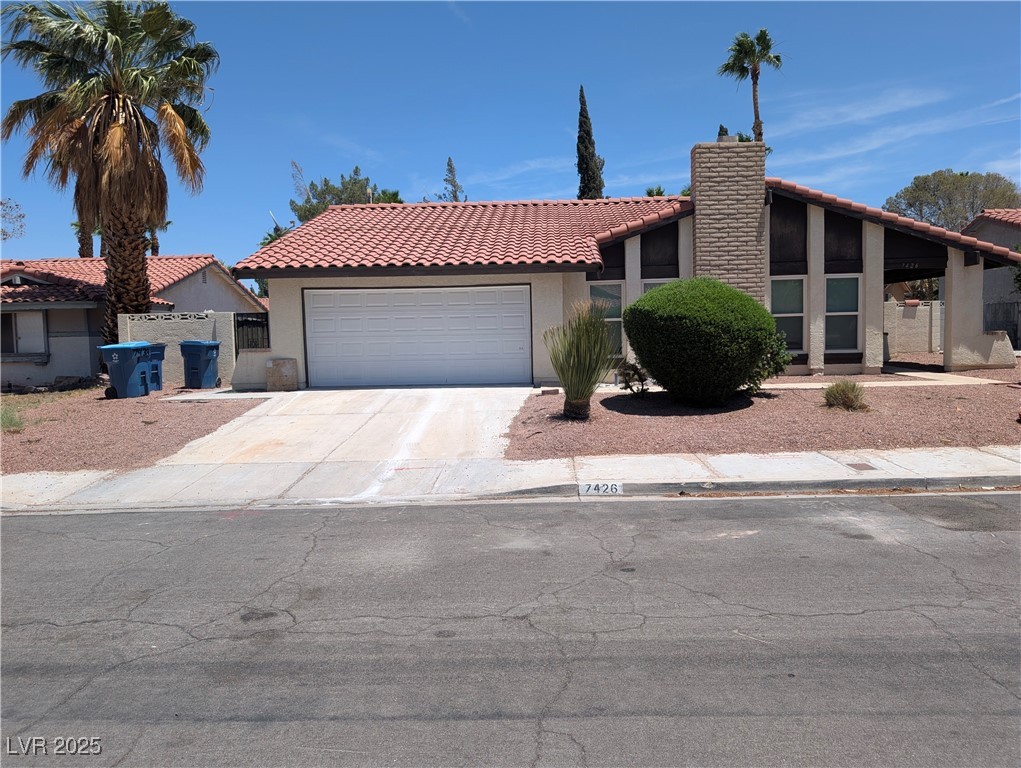
Active
$555,000
4
bds
|
2
ba
|
1,869
sqft
|
built
1982
7426 Trudy Ln, Las Vegas, NV 89123
$-1,390
Cash flow
-13.1%
Cash-on-Cash Return
3.3%
Cap rate
0.5%
Rent to Value Ratio
Active
$279,000
2
bds
|
2
ba
|
1,014
sqft
|
built
1998
2108 Calville St, Las Vegas, NV 89128
$-824
Cash flow
-15.4%
Cash-on-Cash Return
2.7%
Cap rate
0.5%
Rent to Value Ratio
Active
$599,000
3
bds
|
3
ba
|
2,046
sqft
|
built
2016
6233 Canterbury Field Rd, Las Vegas, NV 89113
$-1,653
Cash flow
-14.4%
Cash-on-Cash Return
3.0%
Cap rate
0.5%
Rent to Value Ratio
Active
$440,000
2
bds
|
2
ba
|
1,408
sqft
|
built
1955
4950 Burnham Ave, Las Vegas, NV 89119
$-1,114
Cash flow
-13.2%
Cash-on-Cash Return
3.2%
Cap rate
0.4%
Rent to Value Ratio
Pending
$550,000
2
bds
|
2
ba
|
1,434
sqft
|
built
2001
713 Chase Tree St, Las Vegas, NV 89144
$-1,822
Cash flow
-17.3%
Cash-on-Cash Return
2.3%
Cap rate
0.4%
Rent to Value Ratio
Active
$185,000
2
bds
|
2
ba
|
945
sqft
|
built
1985
1846 N Decatur Blvd, Las Vegas, NV 89108
$-374
Cash flow
-10.5%
Cash-on-Cash Return
3.9%
Cap rate
0.7%
Rent to Value Ratio
Active
$400,000
3
bds
|
3
ba
|
1,762
sqft
|
built
1987
3942 Delos Dr, Las Vegas, NV 89103
$-1,185
Cash flow
-15.5%
Cash-on-Cash Return
2.7%
Cap rate
0.5%
Rent to Value Ratio
Active
$198,000
1
bds
|
1
ba
|
672
sqft
|
built
1989
2750 S Durango Dr, Las Vegas, NV 89117
$-491
Cash flow
-12.9%
Cash-on-Cash Return
3.3%
Cap rate
0.6%
Rent to Value Ratio
Pending
$9,000,000
5
bds
|
7
ba
|
9,771
sqft
|
built
2005
11 Golden Sunray Ln, Las Vegas, NV 89135
$-45,583
Cash flow
-26.4%
Cash-on-Cash Return
0.2%
Cap rate
0.1%
Rent to Value Ratio
Active
$480,000
4
bds
|
3
ba
|
1,916
sqft
|
built
1995
7977 Blue Brook Dr, Las Vegas, NV 89147
$-1,177
Cash flow
-12.8%
Cash-on-Cash Return
3.3%
Cap rate
0.5%
Rent to Value Ratio