Long Beach, CA Investment Properties for Sale
Browse homes for sale and investment properties in Long Beach, CA. Refine your search by price, property type, or more.
Best cash flowing properties in Long Beach, CA
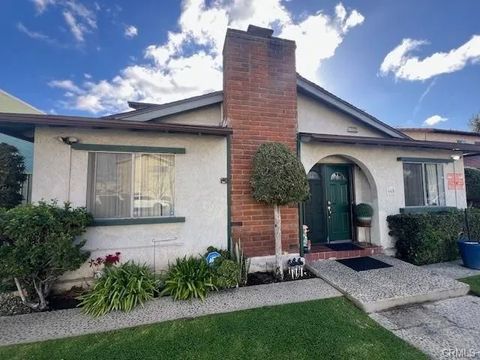
Active
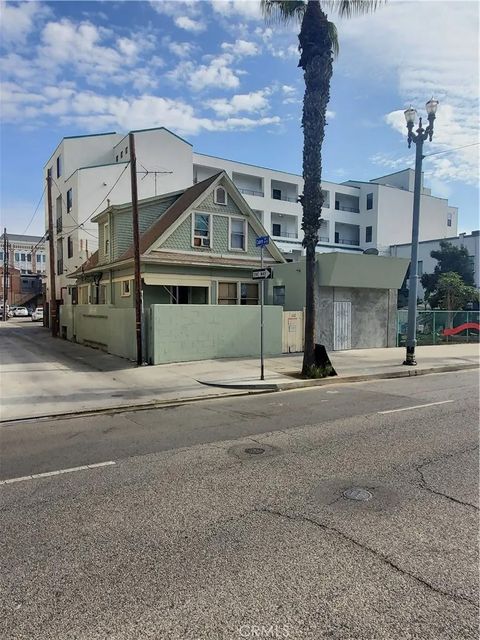
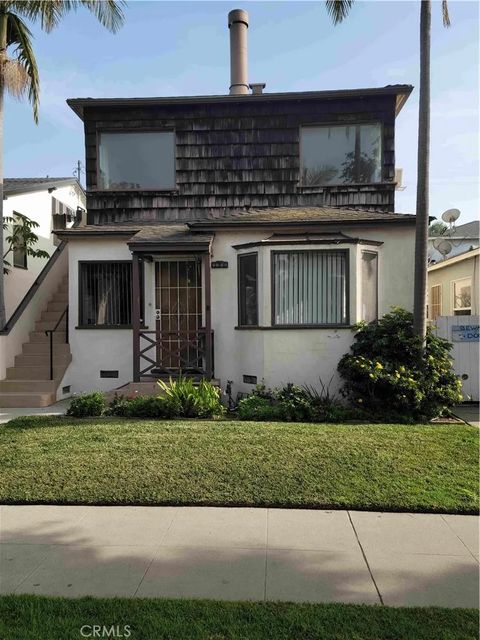
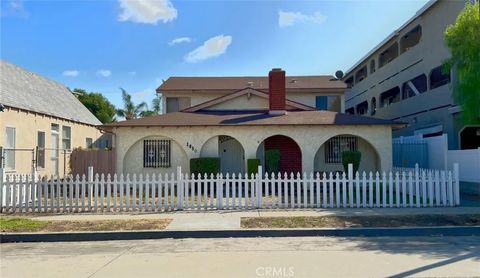
$195,000
1
bds
|
1
ba
|
0
sqft
|
built
1928
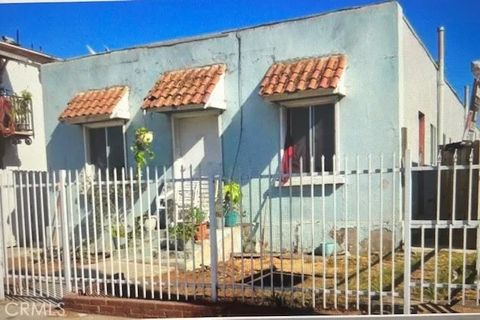
140 Linden Ave, Long Beach, CA 90802
$426
Cash flow
11.4%
Cash-on-Cash Return
8.7%
Cap rate
1.1%
Rent to Value Ratio
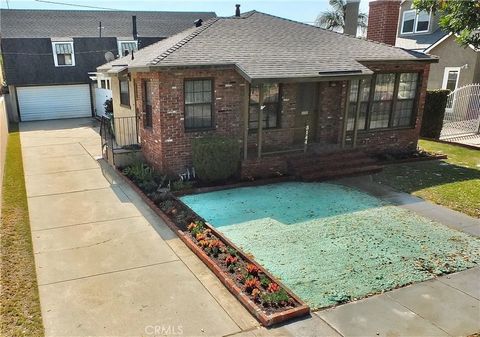
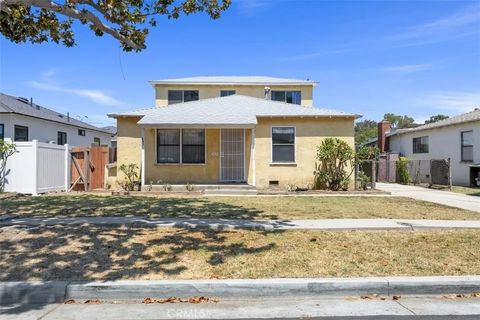
Active
$640,000
2
bds
|
1
ba
|
868
sqft
|
built
1946
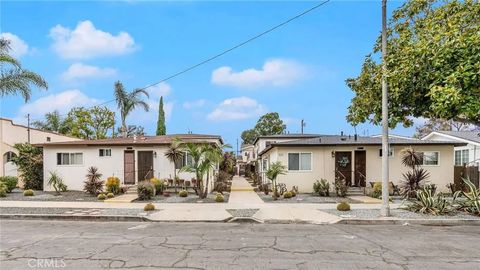
5943 Gardenia Ave, Long Beach, CA 90805
$-1,097
Cash flow
-8.9%
Cash-on-Cash Return
4.0%
Cap rate
0.5%
Rent to Value Ratio
115 out of 355 properties for sale in Long Beach, CA
Limited Results Shown
Create a free account, or log in to reveal all property listings and enjoy the complete experience.
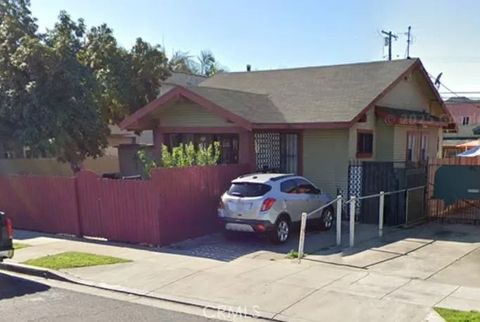
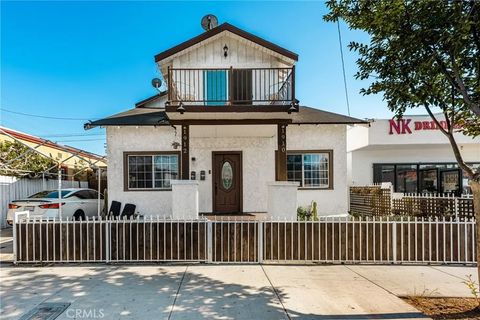
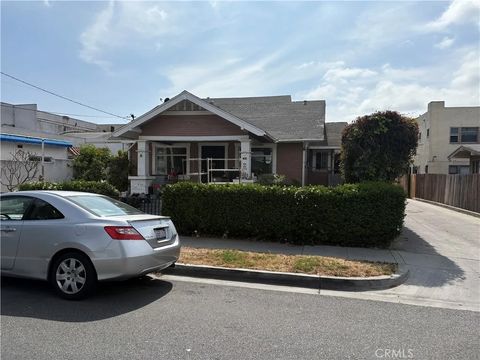
Active
$1,090,000
7
bds
|
5
ba
|
0
sqft
|
built
1903
810 N Loma Vista Dr, Long Beach, CA 90813
$-4,132
Cash flow
-19.8%
Cash-on-Cash Return
1.5%
Cap rate
0.2%
Rent to Value Ratio
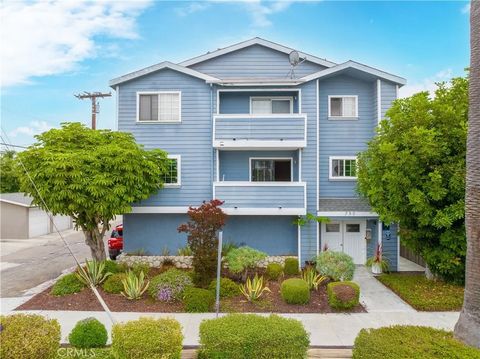
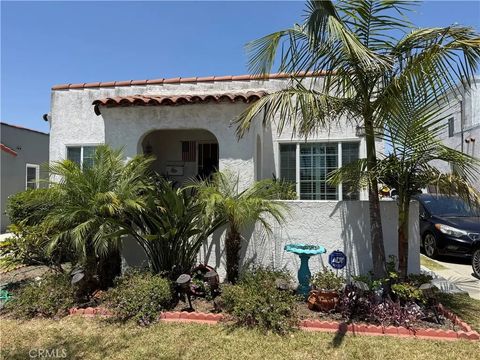
Active
$1,595,000
7
bds
|
6
ba
|
0
sqft
|
built
1920
1557 Pine Ave, Long Beach, CA 90813
$-5,650
Cash flow
-18.5%
Cash-on-Cash Return
1.8%
Cap rate
0.2%
Rent to Value Ratio
Active
$1,100,000
3
bds
|
1
ba
|
1,031
sqft
|
built
1950
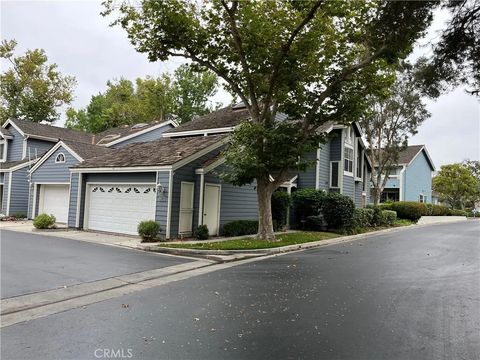
3144 Marwick Ave, Long Beach, CA 90808
$-2,871
Cash flow
-13.6%
Cash-on-Cash Return
2.9%
Cap rate
0.4%
Rent to Value Ratio
Active
$1,495,900
9
bds
|
5
ba
|
0
sqft
|
built
1969
660 Obispo Ave, Long Beach, CA 90814
$-5,080
Cash flow
-17.7%
Cash-on-Cash Return
2.0%
Cap rate
0.2%
Rent to Value Ratio
Active
$1,150,000
6
bds
|
3
ba
|
0
sqft
|
built
1921
1105 Cherry Ave, Long Beach, CA 90813
$-3,883
Cash flow
-17.6%
Cash-on-Cash Return
2.0%
Cap rate
0.2%
Rent to Value Ratio
Active
$1,950,000
9
bds
|
7
ba
|
0
sqft
|
built
1987
350 Tile Ave, Long Beach, CA 90802
$-7,169
Cash flow
-19.2%
Cash-on-Cash Return
1.7%
Cap rate
0.2%
Rent to Value Ratio
Active
$900,000
2
bds
|
1
ba
|
0
sqft
|
built
1946
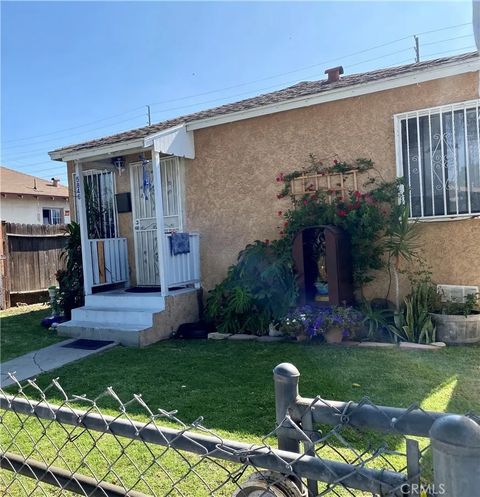
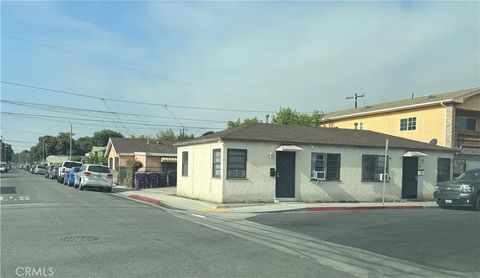
5846 Gardenia Ave, Long Beach, CA 90805
$-2,619
Cash flow
-15.2%
Cash-on-Cash Return
2.6%
Cap rate
0.3%
Rent to Value Ratio
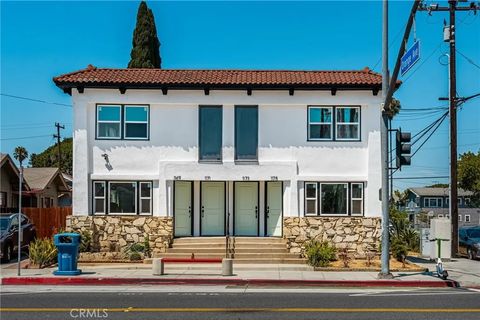
Active
$1,649,000
3
bds
|
2
ba
|
0
sqft
|
built
1921
1169 E Broadway, Long Beach, CA 90802
$-6,337
Cash flow
-20.1%
Cash-on-Cash Return
1.5%
Cap rate
0.2%
Rent to Value Ratio
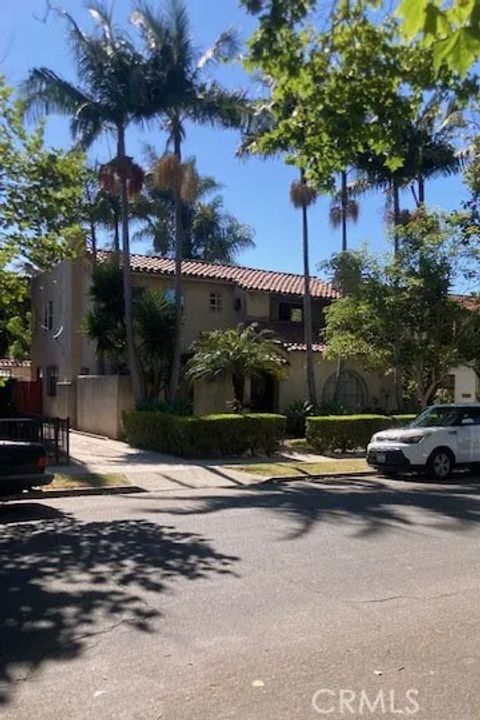
Active
$950,000
4
bds
|
4
ba
|
0
sqft
|
built
1931
2243 Chestnut Ave, Long Beach, CA 90806
$-2,665
Cash flow
-14.6%
Cash-on-Cash Return
2.7%
Cap rate
0.3%
Rent to Value Ratio
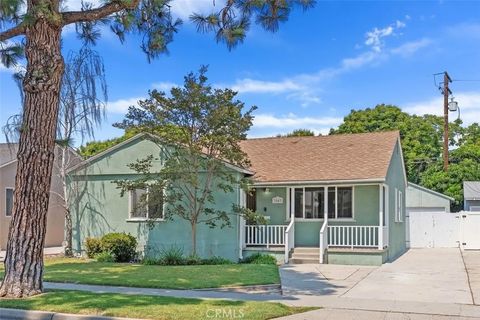
Active
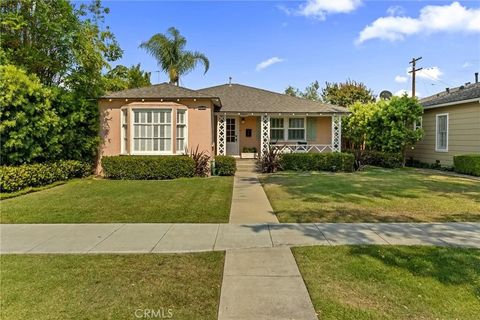
$879,000
3
bds
|
1
ba
|
1,218
sqft
|
built
1953
3842 Knoxville Ave, Long Beach, CA 90808
$-1,754
Cash flow
-10.4%
Cash-on-Cash Return
3.7%
Cap rate
0.4%
Rent to Value Ratio
Active
$830,000
2
bds
|
2
ba
|
1,636
sqft
|
built
1940
2257 Daisy Ave, Long Beach, CA 90806
$-1,506
Cash flow
-9.5%
Cash-on-Cash Return
3.9%
Cap rate
0.5%
Rent to Value Ratio
Active
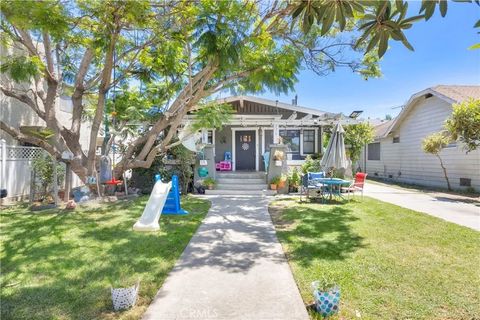
$849,999
5
bds
|
2
ba
|
0
sqft
|
built
1928
1912 E 10th St, Long Beach, CA 90813
$-2,297
Cash flow
-14.1%
Cash-on-Cash Return
2.8%
Cap rate
0.3%
Rent to Value Ratio
Active
$1,150,000
9
bds
|
5
ba
|
0
sqft
|
built
1928
1509 E 20th St, Long Beach, CA 90806
$-3,676
Cash flow
-16.7%
Cash-on-Cash Return
2.2%
Cap rate
0.3%
Rent to Value Ratio
Active
$1,249,000
7
bds
|
3
ba
|
0
sqft
|
built
1953
620 Pacific Ave, Long Beach, CA 90802
$-4,177
Cash flow
-17.4%
Cash-on-Cash Return
2.1%
Cap rate
0.2%
Rent to Value Ratio
Active
$988,000
2
bds
|
3
ba
|
1,981
sqft
|
built
1984
480 Kakkis Dr, Long Beach, CA 90803
$-2,866
Cash flow
-15.1%
Cash-on-Cash Return
2.6%
Cap rate
0.4%
Rent to Value Ratio
Active
$1,525,000
4
bds
|
3
ba
|
0
sqft
|
built
1946
120 Granada Ave, Long Beach, CA 90803
$-4,951
Cash flow
-16.9%
Cash-on-Cash Return
2.2%
Cap rate
0.3%
Rent to Value Ratio
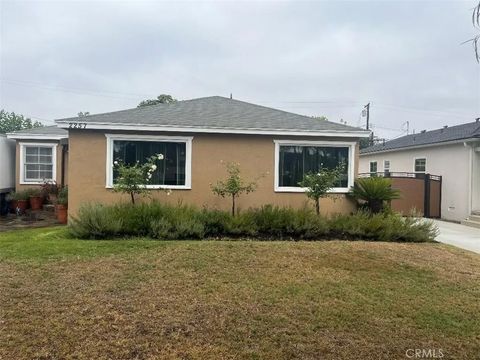
Active
$875,000
2
bds
|
1
ba
|
1,260
sqft
|
built
1946
3762 Gardenia Ave, Long Beach, CA 90807
$-1,664
Cash flow
-9.9%
Cash-on-Cash Return
3.8%
Cap rate
0.5%
Rent to Value Ratio
Active
$1,248,000
6
bds
|
4
ba
|
0
sqft
|
built
1922
776 Stanley Ave, Long Beach, CA 90804
$-4,103
Cash flow
-17.2%
Cash-on-Cash Return
2.1%
Cap rate
0.3%
Rent to Value Ratio
Active
$650,000
2
bds
|
2
ba
|
0
sqft
|
built
1953
6576 California Ave, Long Beach, CA 90805
$-1,493
Cash flow
-12.0%
Cash-on-Cash Return
3.3%
Cap rate
0.4%
Rent to Value Ratio
Active
$735,000
2
bds
|
1
ba
|
996
sqft
|
built
1929
6072 Myrtle Ave, Long Beach, CA 90805
$-1,509
Cash flow
-10.7%
Cash-on-Cash Return
3.6%
Cap rate
0.4%
Rent to Value Ratio
Active
$1,099,000
7
bds
|
4
ba
|
0
sqft
|
built
1971
6001 California Ave, Long Beach, CA 90805
$-3,418
Cash flow
-16.2%
Cash-on-Cash Return
2.3%
Cap rate
0.3%
Rent to Value Ratio
Active
$1,775,000
8
bds
|
5
ba
|
0
sqft
|
built
1931
2533 Eucalyptus Ave, Long Beach, CA 90806
$-6,836
Cash flow
-20.1%
Cash-on-Cash Return
1.4%
Cap rate
0.2%
Rent to Value Ratio
Active
$1,350,000
4
bds
|
2
ba
|
0
sqft
|
built
1938
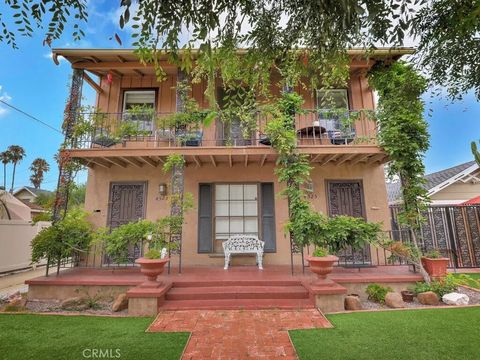
4523 E 3rd St, Long Beach, CA 90814
$-4,342
Cash flow
-16.8%
Cash-on-Cash Return
2.2%
Cap rate
0.3%
Rent to Value Ratio
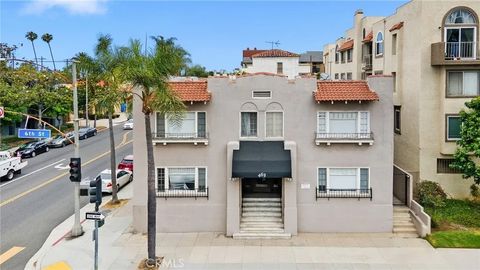
Active
$1,630,000
1
bds
|
2
ba
|
0
sqft
|
built
1923
463 W 6th St, Long Beach, CA 90802
$-5,413
Cash flow
-17.3%
Cash-on-Cash Return
2.1%
Cap rate
0.3%
Rent to Value Ratio
Active
$949,000
4
bds
|
2
ba
|
0
sqft
|
built
1939
1876 Oregon Ave, Long Beach, CA 90806
$-2,867
Cash flow
-15.8%
Cash-on-Cash Return
2.4%
Cap rate
0.3%
Rent to Value Ratio
Active
$1,150,000
4
bds
|
4
ba
|
0
sqft
|
built
1922
541 Cerritos Ave, Long Beach, CA 90802
$-4,573
Cash flow
-20.7%
Cash-on-Cash Return
1.3%
Cap rate
0.2%
Rent to Value Ratio
Active
$1,290,000
6
bds
|
3
ba
|
0
sqft
|
built
1953
5355 Pine Ave, Long Beach, CA 90805
$-4,591
Cash flow
-18.6%
Cash-on-Cash Return
1.8%
Cap rate
0.2%
Rent to Value Ratio
Active
$1,670,000
bds
|
4
ba
|
0
sqft
|
built
1923
1432 Gaviota Ave, Long Beach, CA 90813
$-6,650
Cash flow
-20.8%
Cash-on-Cash Return
1.3%
Cap rate
0.2%
Rent to Value Ratio
Active
$999,900
5
bds
|
3
ba
|
0
sqft
|
built
1927
5636 California Ave, Long Beach, CA 90805
$-3,124
Cash flow
-16.3%
Cash-on-Cash Return
2.3%
Cap rate
0.3%
Rent to Value Ratio
Active
$1,700,000
5
bds
|
4
ba
|
0
sqft
|
built
1922
831 Mira Mar Ave, Long Beach, CA 90804
$-5,836
Cash flow
-17.9%
Cash-on-Cash Return
1.9%
Cap rate
0.2%
Rent to Value Ratio
Active
$1,765,000
9
bds
|
8
ba
|
0
sqft
|
built
1971
1050 Molino Ave, Long Beach, CA 90804
$-6,717
Cash flow
-19.9%
Cash-on-Cash Return
1.5%
Cap rate
0.2%
Rent to Value Ratio
Active
$850,000
5
bds
|
3
ba
|
1,634
sqft
|
built
1943
803 E Silva St, Long Beach, CA 90807
$-1,607
Cash flow
-9.9%
Cash-on-Cash Return
3.8%
Cap rate
0.5%
Rent to Value Ratio
Active
$1,500,000
1
bds
|
1
ba
|
0
sqft
|
built
1919
419 Rose Ave, Long Beach, CA 90802
$-5,446
Cash flow
-18.9%
Cash-on-Cash Return
1.7%
Cap rate
0.2%
Rent to Value Ratio
Active
$699,000
3
bds
|
2
ba
|
1,101
sqft
|
built
1928
1501 E 63rd St, Long Beach, CA 90805
$-1,120
Cash flow
-8.4%
Cash-on-Cash Return
4.1%
Cap rate
0.5%
Rent to Value Ratio
Active
$1,690,000
2
bds
|
1
ba
|
0
sqft
|
built
1961
817 Mira Mar Ave, Long Beach, CA 90804
$-6,614
Cash flow
-20.4%
Cash-on-Cash Return
1.4%
Cap rate
0.2%
Rent to Value Ratio
Active
$989,900
7
bds
|
4
ba
|
0
sqft
|
built
1923
1636 Pacific Ave, Long Beach, CA 90813
$-3,211
Cash flow
-16.9%
Cash-on-Cash Return
2.2%
Cap rate
0.3%
Rent to Value Ratio

Active
$1,710,000
2
bds
|
1
ba
|
0
sqft
|
built
1961
825 Mira Mar Ave, Long Beach, CA 90804
$-6,922
Cash flow
-21.1%
Cash-on-Cash Return
1.2%
Cap rate
0.1%
Rent to Value Ratio
Active
$599,999
2
bds
|
2
ba
|
0
sqft
|
built
1949
358 E 53rd St, Long Beach, CA 90805
$-1,447
Cash flow
-12.6%
Cash-on-Cash Return
3.2%
Cap rate
0.4%
Rent to Value Ratio