Longwood, FL Investment Properties for Sale
Browse homes for sale and investment properties in Longwood, FL. Refine your search by price, property type, or more.
Best cash flowing properties in Longwood, FL
Active
$195,000
2
bds
|
1
ba
|
959
sqft
|
built
1991
490 N Pin Oak Pl, Longwood, FL 32779
$-21
Cash flow
-0.6%
Cash-on-Cash Return
6.0%
Cap rate
0.8%
Rent to Value Ratio

Active
$257,000
2
bds
|
2
ba
|
840
sqft
|
built
1956
455 E Palmetto Ave, Longwood, FL 32750
$-201
Cash flow
-4.1%
Cash-on-Cash Return
5.2%
Cap rate
0.7%
Rent to Value Ratio
117 out of 167 properties for sale in Longwood, FL
Limited Results Shown
Create a free account, or log in to reveal all property listings and enjoy the complete experience.
Active
$558,777
4
bds
|
2
ba
|
2,351
sqft
|
built
2002
140 Rangeline Woods Cv, Longwood, FL 32750
$-905
Cash flow
-8.5%
Cash-on-Cash Return
4.2%
Cap rate
0.6%
Rent to Value Ratio
Active
$455,000
3
bds
|
2
ba
|
2,503
sqft
|
built
1971
146 Tollgate Trl, Longwood, FL 32750
$-648
Cash flow
-7.4%
Cash-on-Cash Return
4.4%
Cap rate
0.6%
Rent to Value Ratio

Active
$699,000
5
bds
|
3
ba
|
2,820
sqft
|
built
1972
103 Cherry Hill Cir, Longwood, FL 32779
$-1,501
Cash flow
-11.2%
Cash-on-Cash Return
3.6%
Cap rate
0.5%
Rent to Value Ratio
Active
$565,000
6
bds
|
4
ba
|
3,459
sqft
|
built
1998
502 Freeman St, Longwood, FL 32750
$-1,328
Cash flow
-12.3%
Cash-on-Cash Return
3.3%
Cap rate
0.6%
Rent to Value Ratio

Active
$654,900
4
bds
|
3
ba
|
2,540
sqft
|
built
1993
1006 Hanging Vine Pt, Longwood, FL 32750
$-1,513
Cash flow
-12.1%
Cash-on-Cash Return
3.4%
Cap rate
0.5%
Rent to Value Ratio

Active
$349,900
3
bds
|
2
ba
|
1,040
sqft
|
built
1978
376 Orange Ave, Longwood, FL 32750
$-610
Cash flow
-9.1%
Cash-on-Cash Return
4.1%
Cap rate
0.6%
Rent to Value Ratio

Active
$365,000
3
bds
|
2
ba
|
1,284
sqft
|
built
1972
1051 Arden St, Longwood, FL 32750
$-597
Cash flow
-8.5%
Cash-on-Cash Return
4.2%
Cap rate
0.5%
Rent to Value Ratio
Active
$674,900
4
bds
|
4
ba
|
3,323
sqft
|
built
1979
413 Sandy Hill Dr, Longwood, FL 32779
$-844
Cash flow
-6.5%
Cash-on-Cash Return
4.6%
Cap rate
0.7%
Rent to Value Ratio

Active
$400,000
3
bds
|
2
ba
|
1,293
sqft
|
built
1976
314 Bonnie Trl, Longwood, FL 32750
$-642
Cash flow
-8.4%
Cash-on-Cash Return
4.2%
Cap rate
0.6%
Rent to Value Ratio
Active
$1,300,000
5
bds
|
4
ba
|
4,200
sqft
|
built
1984
2108 Silver Leaf Ct, Longwood, FL 32779
$-3,449
Cash flow
-13.8%
Cash-on-Cash Return
3.0%
Cap rate
0.4%
Rent to Value Ratio
Active
$479,000
4
bds
|
2
ba
|
1,987
sqft
|
built
1978
307 Coble Dr, Longwood, FL 32779
$-1,024
Cash flow
-11.2%
Cash-on-Cash Return
3.6%
Cap rate
0.6%
Rent to Value Ratio
Active
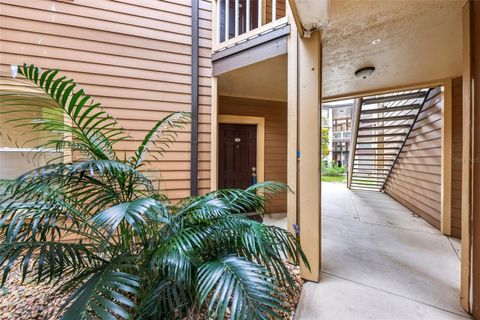
$259,900
2
bds
|
2
ba
|
1,208
sqft
|
built
1984
262 W Sabal Palm Pl, Longwood, FL 32779
$-833
Cash flow
-16.7%
Cash-on-Cash Return
2.3%
Cap rate
0.7%
Rent to Value Ratio
Active
$257,000
2
bds
|
2
ba
|
840
sqft
|
built
1956
455 E Palmetto Ave, Longwood, FL 32750
$-201
Cash flow
-4.1%
Cash-on-Cash Return
5.2%
Cap rate
0.7%
Rent to Value Ratio

Active
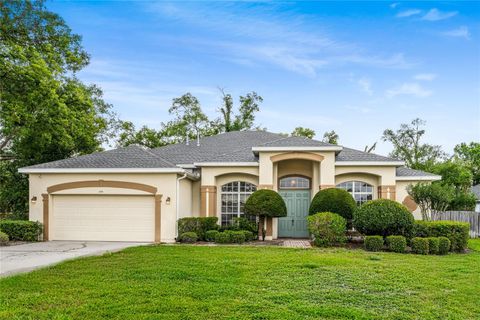
$485,000
4
bds
|
2
ba
|
2,074
sqft
|
built
1978
821 Sutter Loop, Longwood, FL 32750
$-771
Cash flow
-8.3%
Cash-on-Cash Return
4.2%
Cap rate
0.6%
Rent to Value Ratio

Active
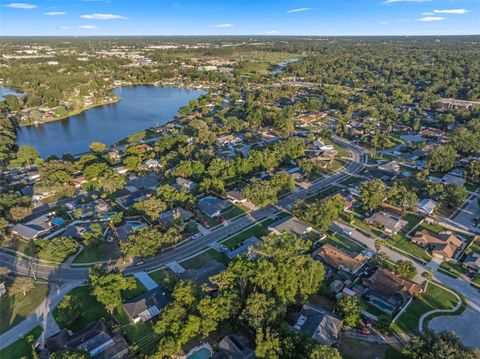
$465,000
4
bds
|
3
ba
|
2,306
sqft
|
built
1971
461 Wilford Ave, Longwood, FL 32750
$-886
Cash flow
-9.9%
Cash-on-Cash Return
3.9%
Cap rate
0.6%
Rent to Value Ratio

Active
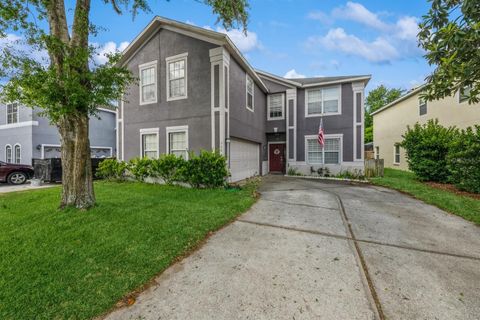
$220,000
2
bds
|
2
ba
|
1,274
sqft
|
built
1996
420 Summit Ridge Pl, Longwood, FL 32779
$-576
Cash flow
-13.7%
Cash-on-Cash Return
3.0%
Cap rate
0.8%
Rent to Value Ratio
Active
$1,775,000
5
bds
|
6
ba
|
6,388
sqft
|
built
1999
1906 Oakbrook Dr, Longwood, FL 32779
$-5,082
Cash flow
-14.9%
Cash-on-Cash Return
2.7%
Cap rate
0.5%
Rent to Value Ratio
Active
$395,000
4
bds
|
2
ba
|
1,985
sqft
|
built
1959
364 E Church Ave, Longwood, FL 32750
$-719
Cash flow
-9.5%
Cash-on-Cash Return
4.0%
Cap rate
0.6%
Rent to Value Ratio
Active
$349,000
4
bds
|
2
ba
|
1,161
sqft
|
built
1973
730 Georgia Ave, Longwood, FL 32750
$-671
Cash flow
-10.0%
Cash-on-Cash Return
3.8%
Cap rate
0.6%
Rent to Value Ratio

Active
$995,000
5
bds
|
4
ba
|
4,281
sqft
|
built
1977
450 Andrews Dr, Longwood, FL 32750
$-1,007
Cash flow
-5.3%
Cash-on-Cash Return
4.9%
Cap rate
0.6%
Rent to Value Ratio

Active
$444,900
5
bds
|
2
ba
|
1,906
sqft
|
built
1993
304 Little Springs Ln, Longwood, FL 32750
$-767
Cash flow
-9.0%
Cash-on-Cash Return
4.1%
Cap rate
0.6%
Rent to Value Ratio
Active
$875,000
4
bds
|
4
ba
|
3,496
sqft
|
built
1978
204 Green Lake Cir, Longwood, FL 32779
$-1,510
Cash flow
-9.0%
Cash-on-Cash Return
4.1%
Cap rate
0.6%
Rent to Value Ratio

Active
$449,900
4
bds
|
2
ba
|
1,644
sqft
|
built
1974
110 Tedworth Ct, Longwood, FL 32779
$-885
Cash flow
-10.3%
Cash-on-Cash Return
3.8%
Cap rate
0.6%
Rent to Value Ratio

Active
$310,000
3
bds
|
2
ba
|
1,312
sqft
|
built
1986
300 New Waterford Pl, Longwood, FL 32779
$-521
Cash flow
-8.8%
Cash-on-Cash Return
4.1%
Cap rate
0.6%
Rent to Value Ratio

Active
$450,000
3
bds
|
2
ba
|
1,492
sqft
|
built
1983
600 Fallsmead Cir, Longwood, FL 32750
$-1,292
Cash flow
-15.0%
Cash-on-Cash Return
2.7%
Cap rate
0.5%
Rent to Value Ratio
Active
$529,900
4
bds
|
4
ba
|
2,563
sqft
|
built
1974
113 Weeping Elm Ln, Longwood, FL 32779
$-1,197
Cash flow
-11.8%
Cash-on-Cash Return
3.4%
Cap rate
0.5%
Rent to Value Ratio

Active
$1,749,000
4
bds
|
4
ba
|
4,001
sqft
|
built
2004
3382 Fernlake Pl, Longwood, FL 32779
$-4,801
Cash flow
-14.3%
Cash-on-Cash Return
2.9%
Cap rate
0.4%
Rent to Value Ratio

Active
$365,000
4
bds
|
2
ba
|
1,533
sqft
|
built
1971
710 East Ct, Longwood, FL 32750
$-751
Cash flow
-10.7%
Cash-on-Cash Return
3.7%
Cap rate
0.5%
Rent to Value Ratio
Active
$659,000
4
bds
|
2
ba
|
2,177
sqft
|
built
1978
345 W Hornbeam Dr, Longwood, FL 32779
$-1,728
Cash flow
-13.7%
Cash-on-Cash Return
3.0%
Cap rate
0.4%
Rent to Value Ratio
Active
$195,000
2
bds
|
1
ba
|
959
sqft
|
built
1991
490 N Pin Oak Pl, Longwood, FL 32779
$-21
Cash flow
-0.6%
Cash-on-Cash Return
6.0%
Cap rate
0.8%
Rent to Value Ratio

Active
$564,999
4
bds
|
3
ba
|
2,471
sqft
|
built
2021
2090 Prairie Sage Ln, Longwood, FL 32750
$-1,591
Cash flow
-14.7%
Cash-on-Cash Return
2.8%
Cap rate
0.5%
Rent to Value Ratio

Active
$470,000
3
bds
|
2
ba
|
1,965
sqft
|
built
1980
320 Isabella Dr, Longwood, FL 32750
$-827
Cash flow
-9.2%
Cash-on-Cash Return
4.0%
Cap rate
0.6%
Rent to Value Ratio
Active
$1,520,000
4
bds
|
4
ba
|
4,975
sqft
|
built
1979
305 Sweetwater Club Cir, Longwood, FL 32779
$-6,014
Cash flow
-20.6%
Cash-on-Cash Return
1.4%
Cap rate
0.2%
Rent to Value Ratio
Active
$439,900
3
bds
|
2
ba
|
1,912
sqft
|
built
1994
3960 Villas Green Cir, Longwood, FL 32779
$-1,075
Cash flow
-12.7%
Cash-on-Cash Return
3.2%
Cap rate
0.6%
Rent to Value Ratio

Active
$730,000
4
bds
|
2
ba
|
2,974
sqft
|
built
1981
133 Orange Ridge Dr, Longwood, FL 32779
$-1,930
Cash flow
-13.8%
Cash-on-Cash Return
3.0%
Cap rate
0.4%
Rent to Value Ratio

Active
$725,000
5
bds
|
4
ba
|
3,173
sqft
|
built
2020
753 Daybreak Pl, Longwood, FL 32750
$-1,710
Cash flow
-12.3%
Cash-on-Cash Return
3.3%
Cap rate
0.6%
Rent to Value Ratio
Active
$490,000
4
bds
|
3
ba
|
2,289
sqft
|
built
1987
975 Cross Cut Way, Longwood, FL 32750
$-1,330
Cash flow
-14.2%
Cash-on-Cash Return
2.9%
Cap rate
0.5%
Rent to Value Ratio
Active
$171,500
2
bds
|
2
ba
|
1,000
sqft
|
built
1973
165 Springwood Cir, Longwood, FL 32750
$-277
Cash flow
-8.4%
Cash-on-Cash Return
4.2%
Cap rate
0.9%
Rent to Value Ratio
Active
$439,900
3
bds
|
2
ba
|
1,602
sqft
|
built
1976
101 Ludlow Dr, Longwood, FL 32779
$-908
Cash flow
-10.8%
Cash-on-Cash Return
3.7%
Cap rate
0.6%
Rent to Value Ratio
Active
$499,500
5
bds
|
3
ba
|
2,054
sqft
|
built
1972
100 Huntswood Ct, Longwood, FL 32750
$-621
Cash flow
-6.5%
Cash-on-Cash Return
4.7%
Cap rate
0.7%
Rent to Value Ratio