Longwood, FL Investment Properties for Sale
Browse homes for sale and investment properties in Longwood, FL. Refine your search by price, property type, or more.
Best cash flowing properties in Longwood, FL
Active
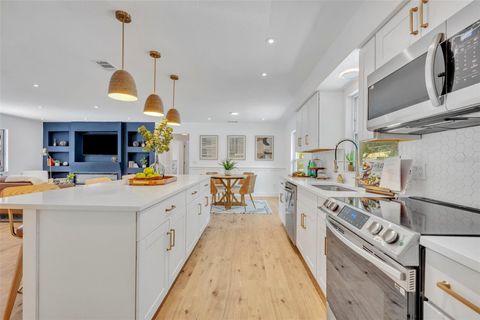
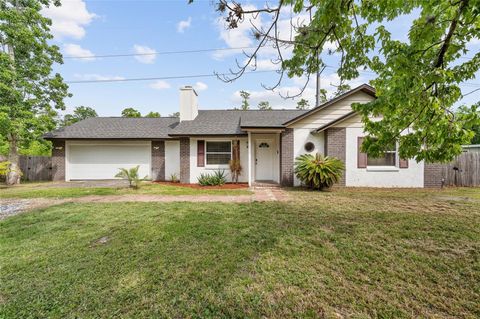
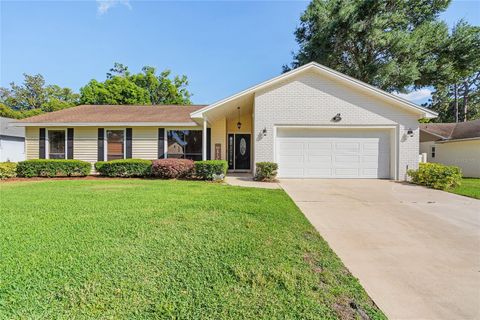
$415,000
3
bds
|
2
ba
|
1,394
sqft
|
built
1981
107 Hilltop Dr, Longwood, FL 32750
$-35
Cash flow
-0.4%
Cash-on-Cash Return
6.2%
Cap rate
0.8%
Rent to Value Ratio
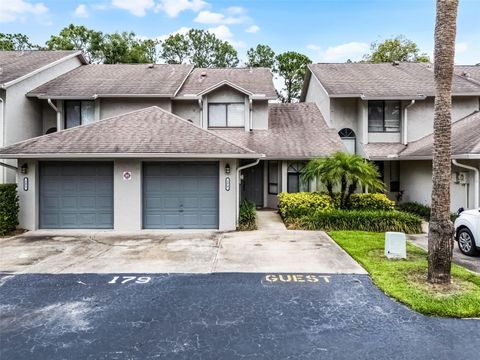
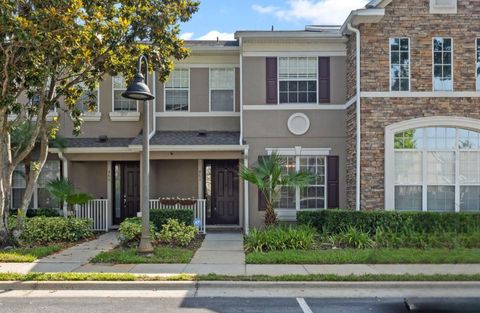
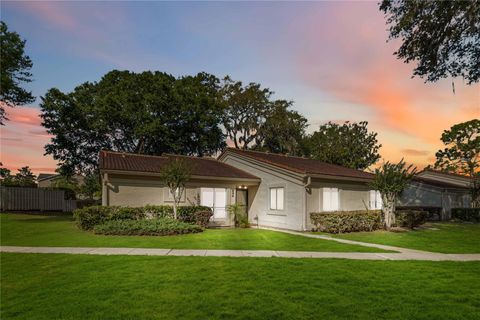
Active
$255,000
2
bds
|
2
ba
|
1,406
sqft
|
built
1985
179 Crown Point Cir, Longwood, FL 32779
$-111
Cash flow
-2.3%
Cash-on-Cash Return
5.6%
Cap rate
0.8%
Rent to Value Ratio
145 out of 163 properties for sale in Longwood, FL
Limited Results Shown
Create a free account, or log in to reveal all property listings and enjoy the complete experience.
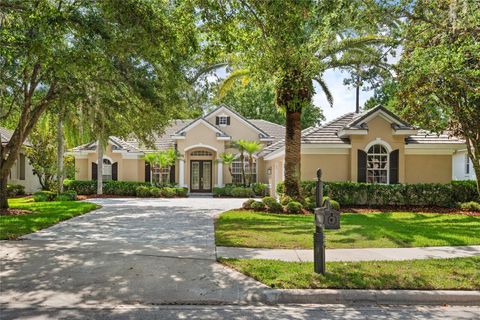
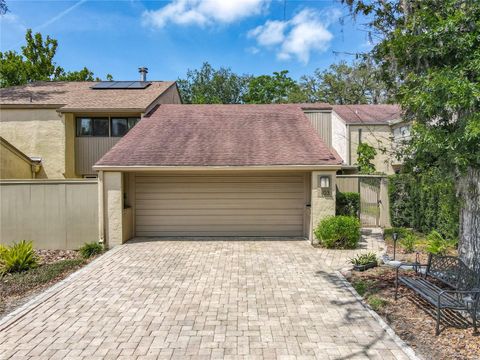
Active
$1,100,000
4
bds
|
3
ba
|
3,088
sqft
|
built
2000
3381 Regal Crest Dr, Longwood, FL 32779
$-3,489
Cash flow
-16.5%
Cash-on-Cash Return
2.3%
Cap rate
0.4%
Rent to Value Ratio
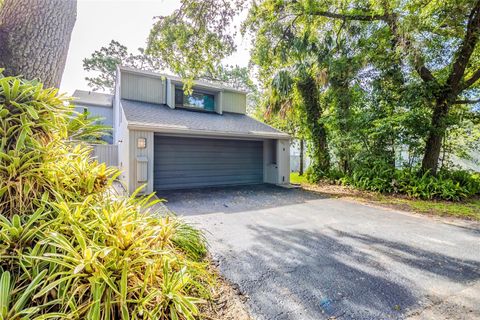
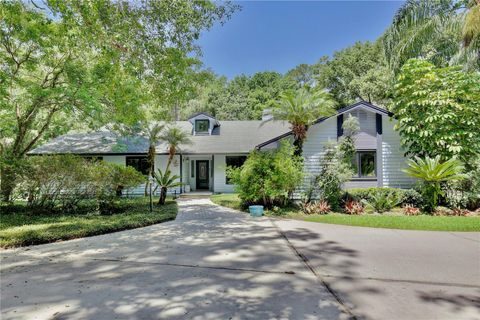
Active
$505,000
4
bds
|
3
ba
|
2,563
sqft
|
built
1974
121 Primrose Dr, Longwood, FL 32779
$-1,249
Cash flow
-12.9%
Cash-on-Cash Return
3.2%
Cap rate
0.6%
Rent to Value Ratio
Active
$360,000
3
bds
|
2
ba
|
1,283
sqft
|
built
1985
2040 E Triangle Dr, Longwood, FL 32779
$-475
Cash flow
-6.9%
Cash-on-Cash Return
4.6%
Cap rate
0.7%
Rent to Value Ratio

Active
$650,000
3
bds
|
3
ba
|
2,522
sqft
|
built
2019
287 Hilltop Dr, Longwood, FL 32750
$-1,847
Cash flow
-14.8%
Cash-on-Cash Return
2.7%
Cap rate
0.4%
Rent to Value Ratio
Active
$399,000
3
bds
|
3
ba
|
1,705
sqft
|
built
2005
461 Black Knight Way, Longwood, FL 32779
$-768
Cash flow
-10.0%
Cash-on-Cash Return
3.8%
Cap rate
0.6%
Rent to Value Ratio
Active
$255,000
2
bds
|
2
ba
|
1,406
sqft
|
built
1985
179 Crown Point Cir, Longwood, FL 32779
$-111
Cash flow
-2.3%
Cash-on-Cash Return
5.6%
Cap rate
0.8%
Rent to Value Ratio
Active
$459,900
3
bds
|
2
ba
|
2,187
sqft
|
built
1974
103 Red Cedar Dr, Longwood, FL 32779
$-839
Cash flow
-9.5%
Cash-on-Cash Return
4.0%
Cap rate
0.7%
Rent to Value Ratio

Active
$349,997
4
bds
|
2
ba
|
1,516
sqft
|
built
1961
1082 Hamilton Ave, Longwood, FL 32750
$-554
Cash flow
-8.3%
Cash-on-Cash Return
4.2%
Cap rate
0.6%
Rent to Value Ratio

Active
$350,000
3
bds
|
2
ba
|
1,128
sqft
|
built
1965
280 E Bay Ave, Longwood, FL 32750
$-371
Cash flow
-5.5%
Cash-on-Cash Return
4.9%
Cap rate
0.7%
Rent to Value Ratio
Active
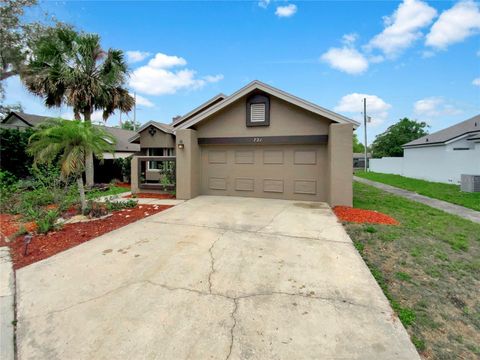
$6,500,000
4
bds
|
3
ba
|
3,731
sqft
|
built
1985
183 Parsons Rd, Longwood, FL 32779
$-31,247
Cash flow
-25.1%
Cash-on-Cash Return
0.4%
Cap rate
0.1%
Rent to Value Ratio
Active
$684,000
4
bds
|
3
ba
|
2,632
sqft
|
built
1993
334 N Shadowbay Blvd, Longwood, FL 32779
$-1,483
Cash flow
-11.3%
Cash-on-Cash Return
3.5%
Cap rate
0.5%
Rent to Value Ratio
Active
$575,000
4
bds
|
2
ba
|
2,148
sqft
|
built
1974
107 Wayland Cir, Longwood, FL 32779
$-1,284
Cash flow
-11.7%
Cash-on-Cash Return
3.5%
Cap rate
0.5%
Rent to Value Ratio

Active
$479,900
4
bds
|
3
ba
|
2,289
sqft
|
built
1987
983 Bucksaw Pl, Longwood, FL 32750
$-774
Cash flow
-8.4%
Cash-on-Cash Return
4.2%
Cap rate
0.6%
Rent to Value Ratio
Active
$389,000
3
bds
|
3
ba
|
1,488
sqft
|
built
2023
185 E Warren Ave, Longwood, FL 32750
$-910
Cash flow
-12.2%
Cash-on-Cash Return
3.3%
Cap rate
0.6%
Rent to Value Ratio

Active
$545,000
4
bds
|
2
ba
|
2,292
sqft
|
built
1984
1204 Duncan Ct, Longwood, FL 32779
$-1,414
Cash flow
-13.5%
Cash-on-Cash Return
3.0%
Cap rate
0.5%
Rent to Value Ratio

Active
$600,000
4
bds
|
3
ba
|
2,435
sqft
|
built
1984
513 Sabal Trail Cir, Longwood, FL 32779
$-1,446
Cash flow
-12.6%
Cash-on-Cash Return
3.3%
Cap rate
0.5%
Rent to Value Ratio

Active
$559,000
4
bds
|
3
ba
|
2,387
sqft
|
built
1988
208 Frinton Cv, Longwood, FL 32779
$-760
Cash flow
-7.1%
Cash-on-Cash Return
4.5%
Cap rate
0.7%
Rent to Value Ratio
Active
$521,600
4
bds
|
2
ba
|
2,058
sqft
|
built
1994
300 Churchill Dr, Longwood, FL 32779
$-1,061
Cash flow
-10.6%
Cash-on-Cash Return
3.7%
Cap rate
0.5%
Rent to Value Ratio

Active
$750,000
4
bds
|
3
ba
|
2,526
sqft
|
built
1973
303 S Sweetwater Blvd, Longwood, FL 32779
$-1,953
Cash flow
-13.6%
Cash-on-Cash Return
3.0%
Cap rate
0.4%
Rent to Value Ratio

Active
$329,900
4
bds
|
2
ba
|
1,183
sqft
|
built
1958
673 E Church Ave, Longwood, FL 32750
$-927
Cash flow
-14.7%
Cash-on-Cash Return
2.8%
Cap rate
0.4%
Rent to Value Ratio
Active
$433,000
3
bds
|
3
ba
|
1,998
sqft
|
built
1983
721 Rock Creek Loop, Longwood, FL 32750
$-936
Cash flow
-11.3%
Cash-on-Cash Return
3.6%
Cap rate
0.6%
Rent to Value Ratio
Active
$1,140,000
4
bds
|
4
ba
|
3,207
sqft
|
built
1999
3352 Park Grove Ct, Longwood, FL 32779
$-2,467
Cash flow
-11.3%
Cash-on-Cash Return
3.6%
Cap rate
0.5%
Rent to Value Ratio
Active
$558,777
4
bds
|
2
ba
|
2,351
sqft
|
built
2002
140 Rangeline Woods Cv, Longwood, FL 32750
$-905
Cash flow
-8.5%
Cash-on-Cash Return
4.2%
Cap rate
0.6%
Rent to Value Ratio
Active
$455,000
3
bds
|
2
ba
|
2,503
sqft
|
built
1971
146 Tollgate Trl, Longwood, FL 32750
$-648
Cash flow
-7.4%
Cash-on-Cash Return
4.4%
Cap rate
0.6%
Rent to Value Ratio

Active
$699,000
5
bds
|
3
ba
|
2,820
sqft
|
built
1972
103 Cherry Hill Cir, Longwood, FL 32779
$-1,501
Cash flow
-11.2%
Cash-on-Cash Return
3.6%
Cap rate
0.5%
Rent to Value Ratio
Active
$750,000
4
bds
|
3
ba
|
2,407
sqft
|
built
1983
628 Riverpark Cir, Longwood, FL 32779
$-1,966
Cash flow
-13.7%
Cash-on-Cash Return
3.1%
Cap rate
0.5%
Rent to Value Ratio
Active
$415,000
3
bds
|
2
ba
|
1,394
sqft
|
built
1981
107 Hilltop Dr, Longwood, FL 32750
$-35
Cash flow
-0.4%
Cash-on-Cash Return
6.2%
Cap rate
0.8%
Rent to Value Ratio

Active
$480,000
3
bds
|
3
ba
|
1,746
sqft
|
built
1974
209 Sweet Gum Way, Longwood, FL 32779
$-1,253
Cash flow
-13.6%
Cash-on-Cash Return
3.1%
Cap rate
0.6%
Rent to Value Ratio
Active
$565,000
6
bds
|
4
ba
|
3,459
sqft
|
built
1998
502 Freeman St, Longwood, FL 32750
$-1,328
Cash flow
-12.3%
Cash-on-Cash Return
3.3%
Cap rate
0.6%
Rent to Value Ratio

Active
$654,900
4
bds
|
3
ba
|
2,540
sqft
|
built
1993
1006 Hanging Vine Pt, Longwood, FL 32750
$-1,513
Cash flow
-12.1%
Cash-on-Cash Return
3.4%
Cap rate
0.5%
Rent to Value Ratio

Active
$349,900
3
bds
|
2
ba
|
1,040
sqft
|
built
1978
376 Orange Ave, Longwood, FL 32750
$-610
Cash flow
-9.1%
Cash-on-Cash Return
4.1%
Cap rate
0.6%
Rent to Value Ratio

Active
$365,000
3
bds
|
2
ba
|
1,284
sqft
|
built
1972
1051 Arden St, Longwood, FL 32750
$-597
Cash flow
-8.5%
Cash-on-Cash Return
4.2%
Cap rate
0.5%
Rent to Value Ratio
Active
$674,900
4
bds
|
4
ba
|
3,323
sqft
|
built
1979
413 Sandy Hill Dr, Longwood, FL 32779
$-844
Cash flow
-6.5%
Cash-on-Cash Return
4.6%
Cap rate
0.7%
Rent to Value Ratio

Active
$400,000
3
bds
|
2
ba
|
1,293
sqft
|
built
1976
314 Bonnie Trl, Longwood, FL 32750
$-642
Cash flow
-8.4%
Cash-on-Cash Return
4.2%
Cap rate
0.6%
Rent to Value Ratio
Active
$1,300,000
5
bds
|
4
ba
|
4,200
sqft
|
built
1984
2108 Silver Leaf Ct, Longwood, FL 32779
$-3,449
Cash flow
-13.8%
Cash-on-Cash Return
3.0%
Cap rate
0.4%
Rent to Value Ratio
Active
$479,000
4
bds
|
2
ba
|
1,987
sqft
|
built
1978
307 Coble Dr, Longwood, FL 32779
$-1,024
Cash flow
-11.2%
Cash-on-Cash Return
3.6%
Cap rate
0.6%
Rent to Value Ratio
Active
$259,900
2
bds
|
2
ba
|
1,208
sqft
|
built
1984
262 W Sabal Palm Pl, Longwood, FL 32779
$-833
Cash flow
-16.7%
Cash-on-Cash Return
2.3%
Cap rate
0.7%
Rent to Value Ratio

Active
$257,000
2
bds
|
2
ba
|
840
sqft
|
built
1956
455 E Palmetto Ave, Longwood, FL 32750
$-201
Cash flow
-4.1%
Cash-on-Cash Return
5.2%
Cap rate
0.7%
Rent to Value Ratio

Active
$485,000
4
bds
|
2
ba
|
2,074
sqft
|
built
1978
821 Sutter Loop, Longwood, FL 32750
$-771
Cash flow
-8.3%
Cash-on-Cash Return
4.2%
Cap rate
0.6%
Rent to Value Ratio

Active
$465,000
4
bds
|
3
ba
|
2,306
sqft
|
built
1971
461 Wilford Ave, Longwood, FL 32750
$-886
Cash flow
-9.9%
Cash-on-Cash Return
3.9%
Cap rate
0.6%
Rent to Value Ratio