Massachusetts Investment Properties for Sale
Browse homes for sale and investment properties in Massachusetts. Refine your search by price, property type, or more.
Best cash flowing properties in Massachusetts
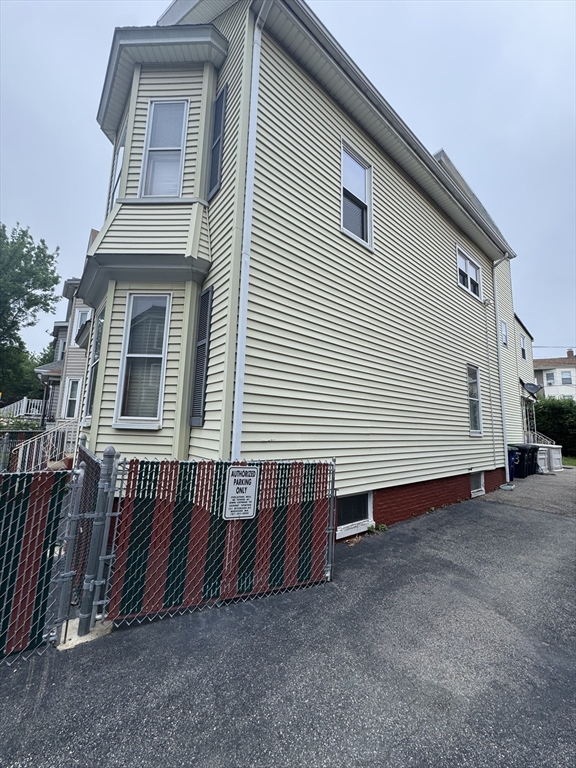
Active under contract
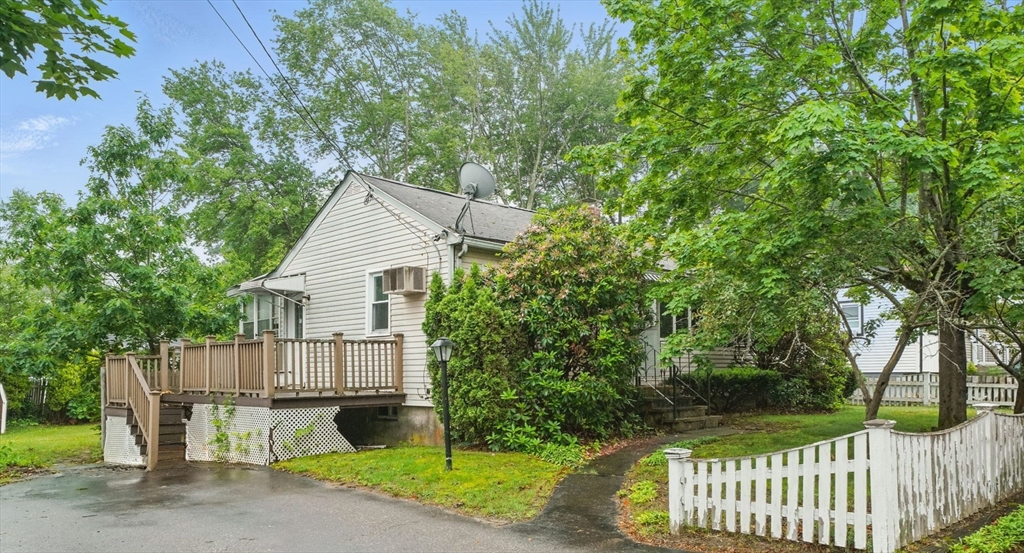
$344,950
2
bds
|
1
ba
|
720
sqft
|
built
1955
9 Tucker Ter, Randolph, MA 02368
$366
Cash flow
5.5%
Cash-on-Cash Return
7.0%
Cap rate
1.0%
Rent to Value Ratio
Active
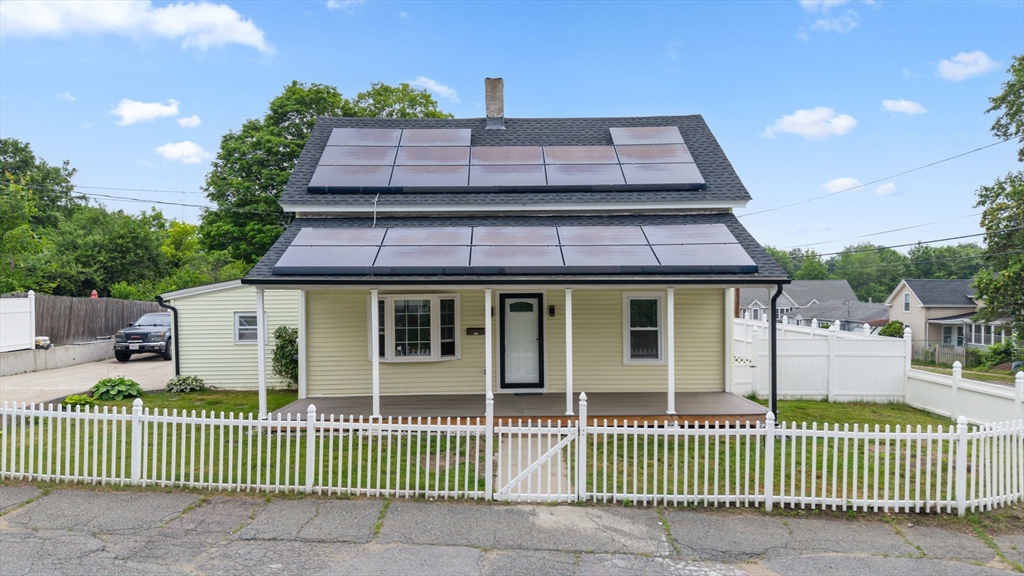
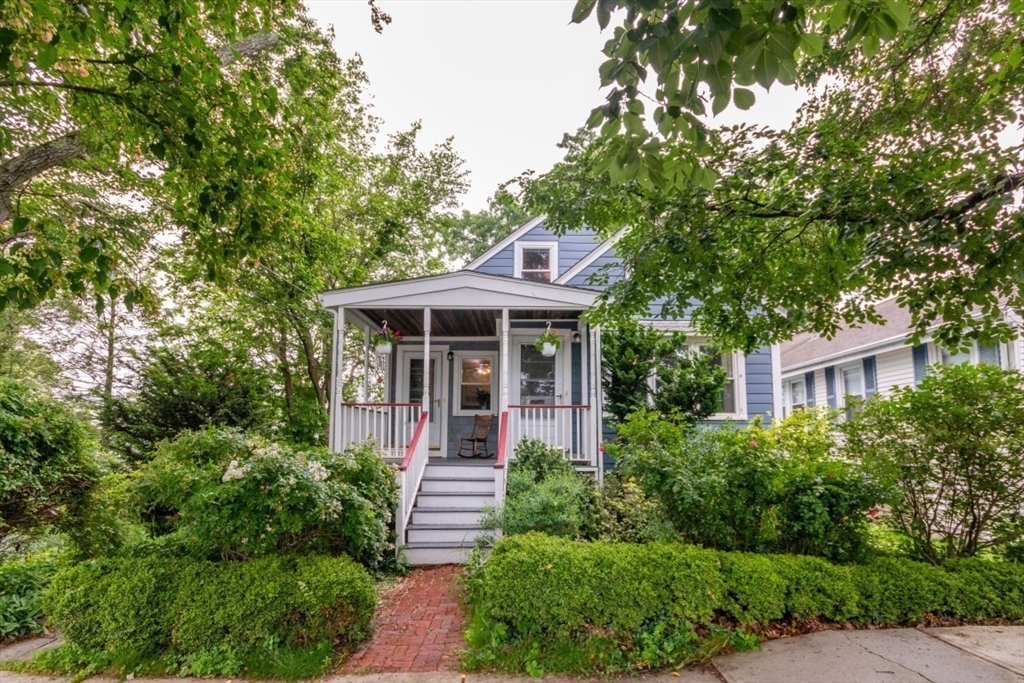
$400,000
3
bds
|
1
ba
|
1,235
sqft
|
built
1900
104 Middle St, Leominster, MA 01453
$-348
Cash flow
-4.5%
Cash-on-Cash Return
4.6%
Cap rate
0.7%
Rent to Value Ratio
5,392 out of 10,603 properties for sale in Massachusetts
Limited Results Shown
Create a free account, or log in to reveal all property listings and enjoy the complete experience.
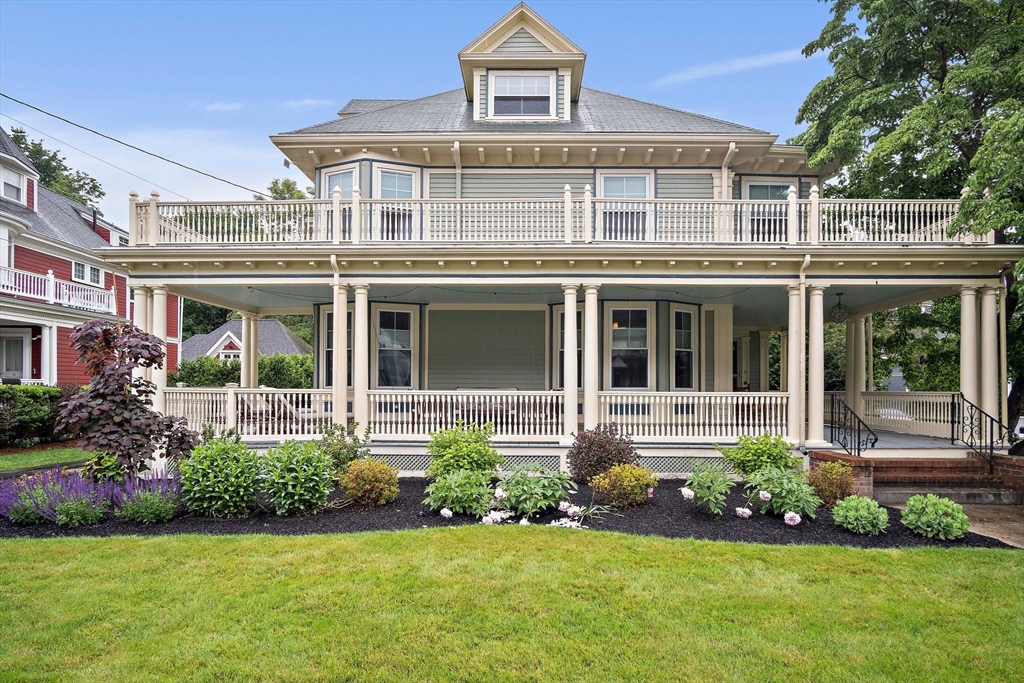
Active
$1,749,900
5
bds
|
4
ba
|
4,372
sqft
|
built
1890
9 Arlington Rd, Woburn, MA 01801
$-5,246
Cash flow
-15.6%
Cash-on-Cash Return
2.1%
Cap rate
0.3%
Rent to Value Ratio
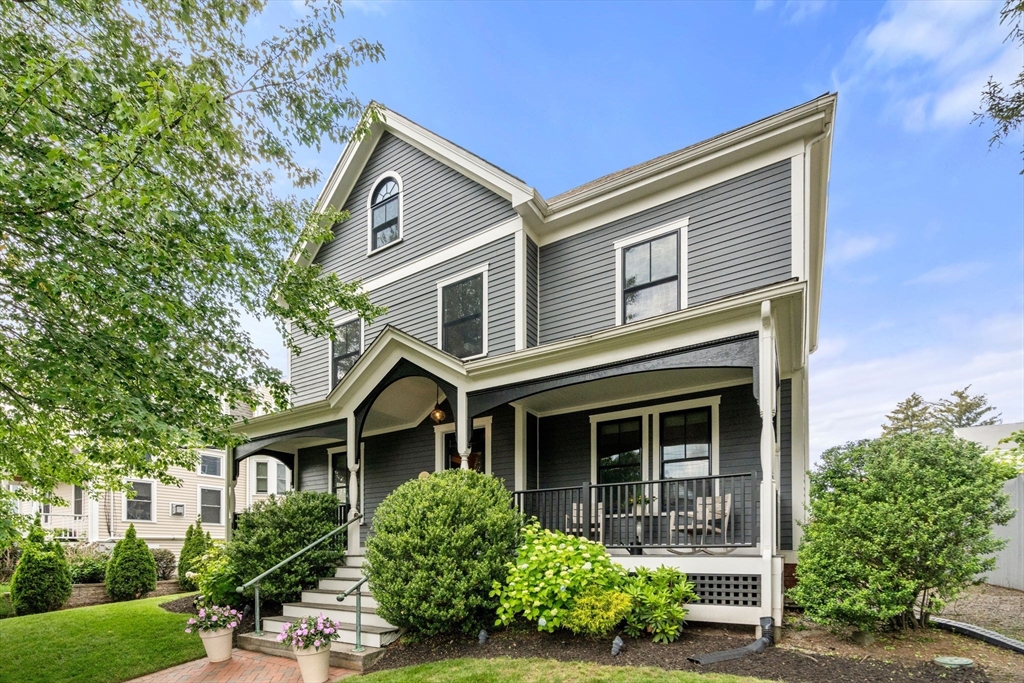
Active under contract
$1,575,000
4
bds
|
3
ba
|
2,750
sqft
|
built
1894
60 Church St, Watertown, MA 02472
$-6,155
Cash flow
-20.4%
Cash-on-Cash Return
1.0%
Cap rate
0.2%
Rent to Value Ratio
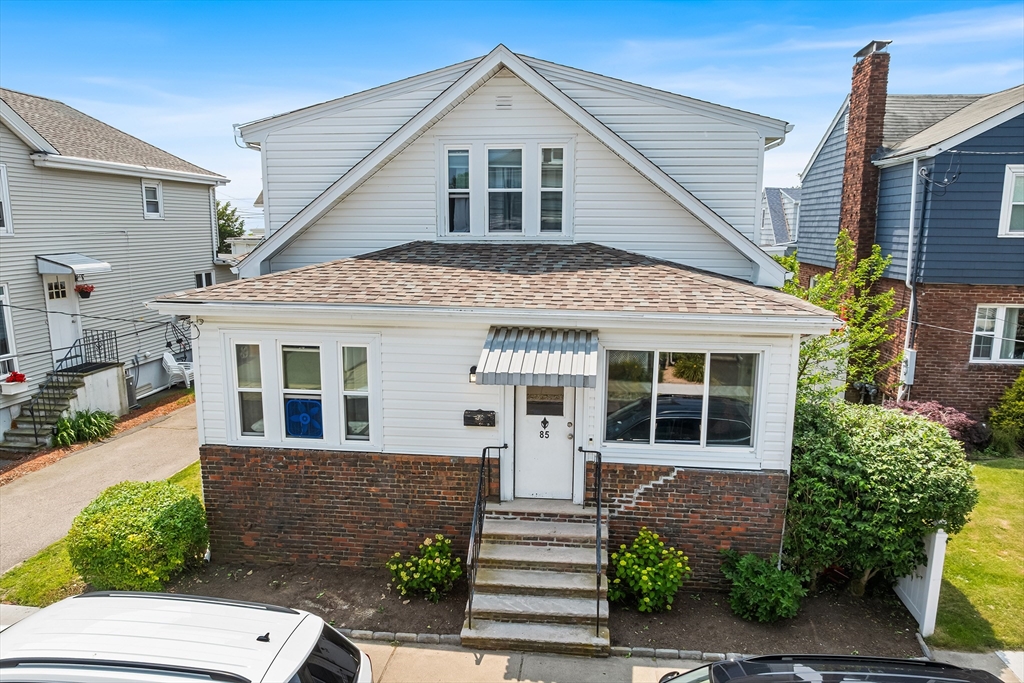
Active
$689,900
5
bds
|
2
ba
|
2,758
sqft
|
built
1930
85 Lancaster Ave, Revere, MA 02151
$-391
Cash flow
-3.0%
Cash-on-Cash Return
5.0%
Cap rate
0.7%
Rent to Value Ratio
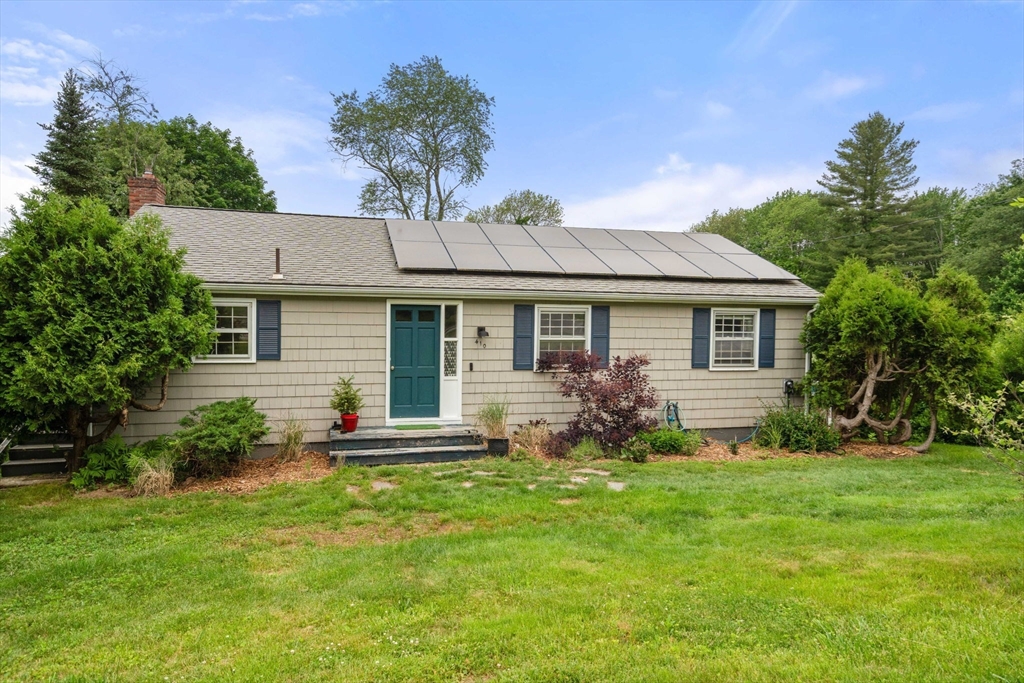
Active
$659,000
3
bds
|
2
ba
|
1,423
sqft
|
built
1968
410 Central St, Acton, MA 01720
$-1,408
Cash flow
-11.1%
Cash-on-Cash Return
3.1%
Cap rate
0.5%
Rent to Value Ratio
Active
$595,000
1
bds
|
1
ba
|
716
sqft
|
built
2010
25 Cross St, Somerville, MA 02145
$-1,798
Cash flow
-15.8%
Cash-on-Cash Return
2.1%
Cap rate
0.4%
Rent to Value Ratio
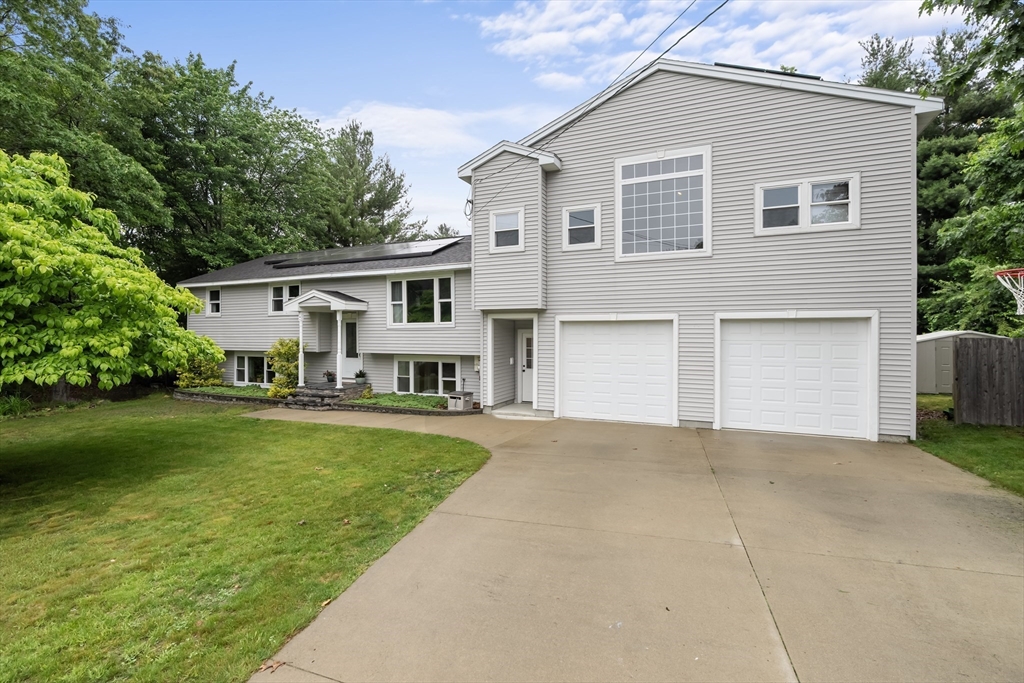
Pending
$850,000
4
bds
|
2
ba
|
2,100
sqft
|
built
1971
109 Georgia Rd, Tewksbury, MA 01876
$-2,044
Cash flow
-12.5%
Cash-on-Cash Return
2.8%
Cap rate
0.5%
Rent to Value Ratio
Active under contract
$989,000
9
bds
|
4
ba
|
3,482
sqft
|
built
1910
7 Cliff St, Attleboro, MA 02703
$-3,526
Cash flow
-18.6%
Cash-on-Cash Return
1.4%
Cap rate
0.3%
Rent to Value Ratio
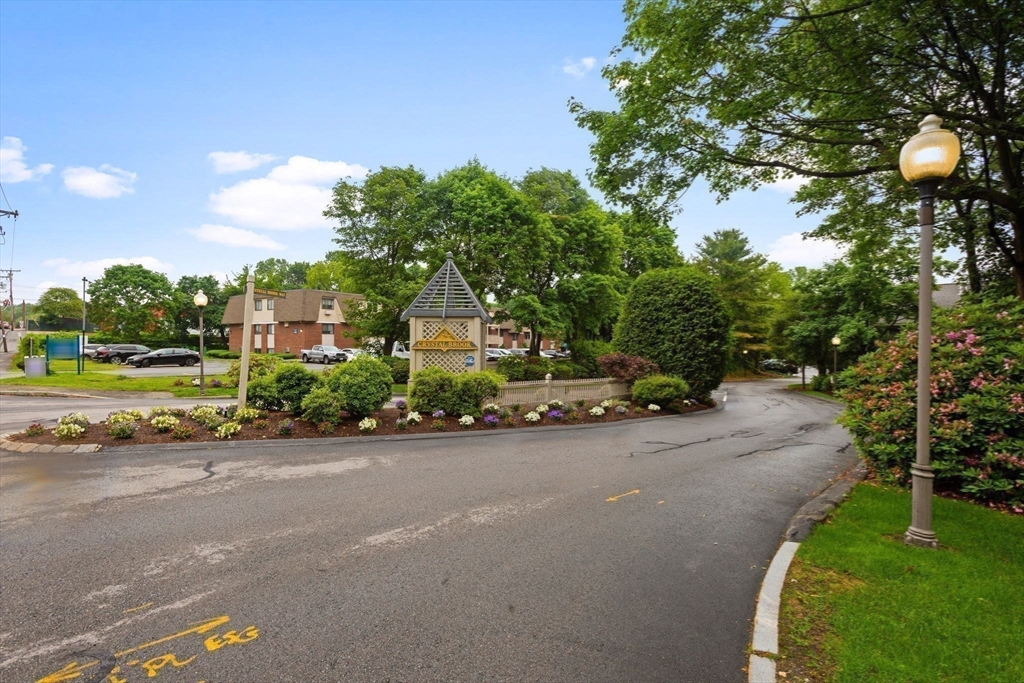
Active under contract
$449,900
2
bds
|
2
ba
|
1,644
sqft
|
built
1991
29 Crystal Brook Way, Marlborough, MA 01752
$-1,079
Cash flow
-12.5%
Cash-on-Cash Return
2.8%
Cap rate
0.6%
Rent to Value Ratio
Active
$520,000
2
bds
|
2
ba
|
1,116
sqft
|
built
1972
247 Washington Ave, Winthrop, MA 02152
$-1,223
Cash flow
-12.3%
Cash-on-Cash Return
2.9%
Cap rate
0.6%
Rent to Value Ratio
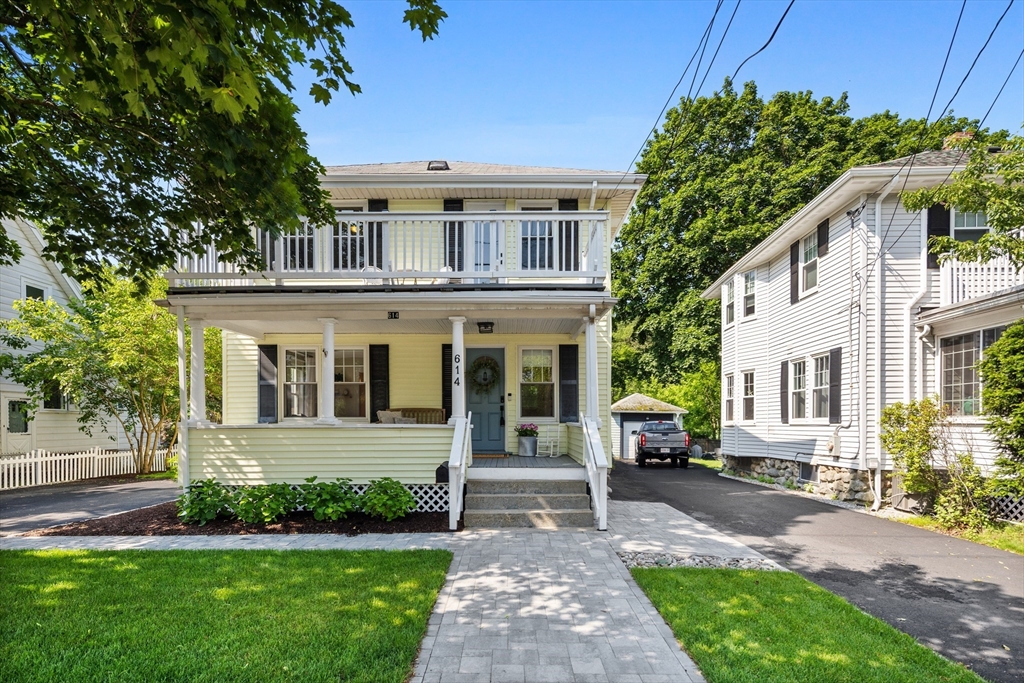
Active under contract
$949,000
4
bds
|
2
ba
|
1,570
sqft
|
built
1916
614 Summer St, Arlington, MA 02474
$-1,839
Cash flow
-10.1%
Cash-on-Cash Return
3.4%
Cap rate
0.5%
Rent to Value Ratio
Active
$2,895,000
4
bds
|
3
ba
|
4,225
sqft
|
built
1987
322 Standish St, Duxbury, MA 02332
$-11,172
Cash flow
-20.1%
Cash-on-Cash Return
1.0%
Cap rate
0.2%
Rent to Value Ratio
Pending
$564,000
3
bds
|
3
ba
|
2,264
sqft
|
built
2008
399 Princeton Rd, Fitchburg, MA 01420
$-810
Cash flow
-7.5%
Cash-on-Cash Return
4.0%
Cap rate
0.6%
Rent to Value Ratio
Active
$4,695,000
4
bds
|
6
ba
|
3,282
sqft
|
built
2003
88 Champlain Rd, Chatham, MA 02633
$-18,645
Cash flow
-20.7%
Cash-on-Cash Return
0.9%
Cap rate
0.2%
Rent to Value Ratio
Active
$1,050,000
2
bds
|
2
ba
|
1,045
sqft
|
built
1875
1682 Washington St, Boston, MA 02118
$-3,273
Cash flow
-16.3%
Cash-on-Cash Return
1.9%
Cap rate
0.4%
Rent to Value Ratio
Active
$1,399,000
4
bds
|
4
ba
|
3,632
sqft
|
built
2018
70 Rockland St, Natick, MA 01760
$-3,166
Cash flow
-11.8%
Cash-on-Cash Return
3.0%
Cap rate
0.5%
Rent to Value Ratio
Active
$1,749,000
5
bds
|
4
ba
|
5,860
sqft
|
built
2013
161 Pantry Rd, Sudbury, MA 01776
$-4,890
Cash flow
-14.6%
Cash-on-Cash Return
2.3%
Cap rate
0.5%
Rent to Value Ratio
Active under contract
$749,900
3
bds
|
2
ba
|
2,256
sqft
|
built
1955
61 Hillsboro St, Quincy, MA 02169
$-1,689
Cash flow
-11.8%
Cash-on-Cash Return
3.0%
Cap rate
0.5%
Rent to Value Ratio
Active
$1,149,000
5
bds
|
5
ba
|
3,716
sqft
|
built
2005
1 Pondview, Salisbury, MA 01952
$-2,324
Cash flow
-10.6%
Cash-on-Cash Return
3.3%
Cap rate
0.5%
Rent to Value Ratio
Active under contract
$629,900
3
bds
|
2
ba
|
1,934
sqft
|
built
1979
16 Bruce Rd, Plymouth, MA 02360
$-1,130
Cash flow
-9.4%
Cash-on-Cash Return
3.5%
Cap rate
0.6%
Rent to Value Ratio
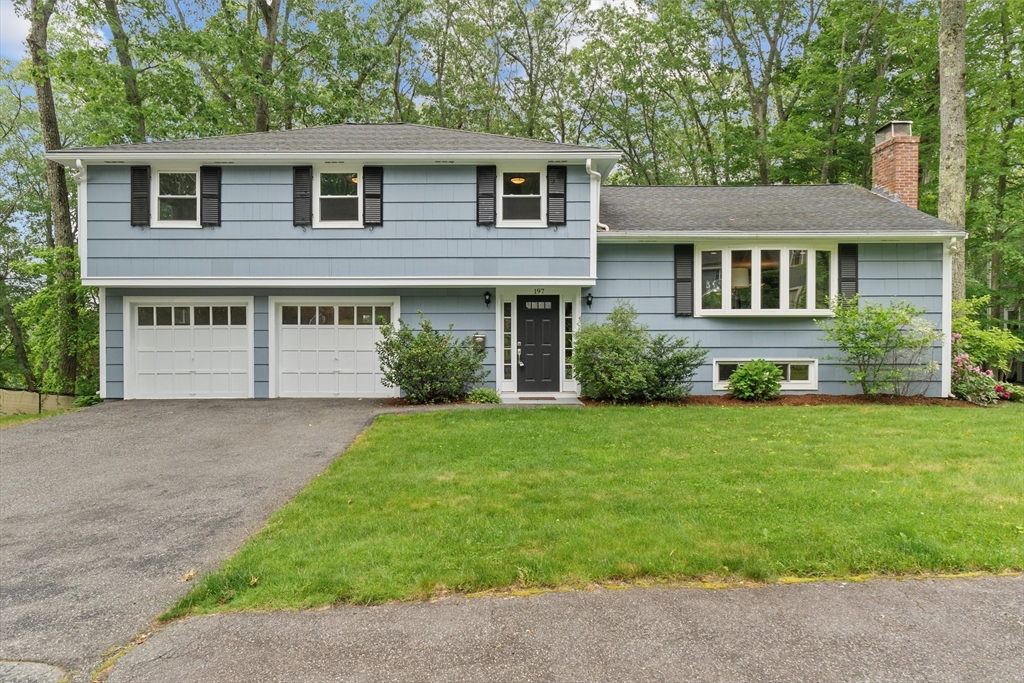
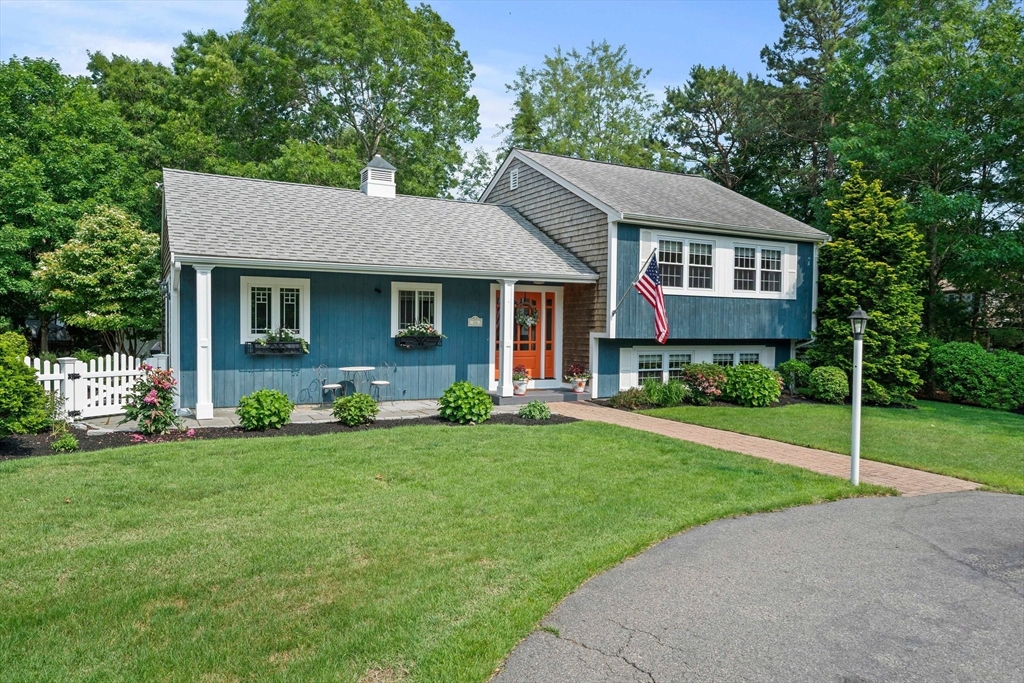
Pending
$799,900
4
bds
|
3
ba
|
2,172
sqft
|
built
1963
197 Lockland Ave, Framingham, MA 01701
$-1,449
Cash flow
-9.5%
Cash-on-Cash Return
3.5%
Cap rate
0.6%
Rent to Value Ratio
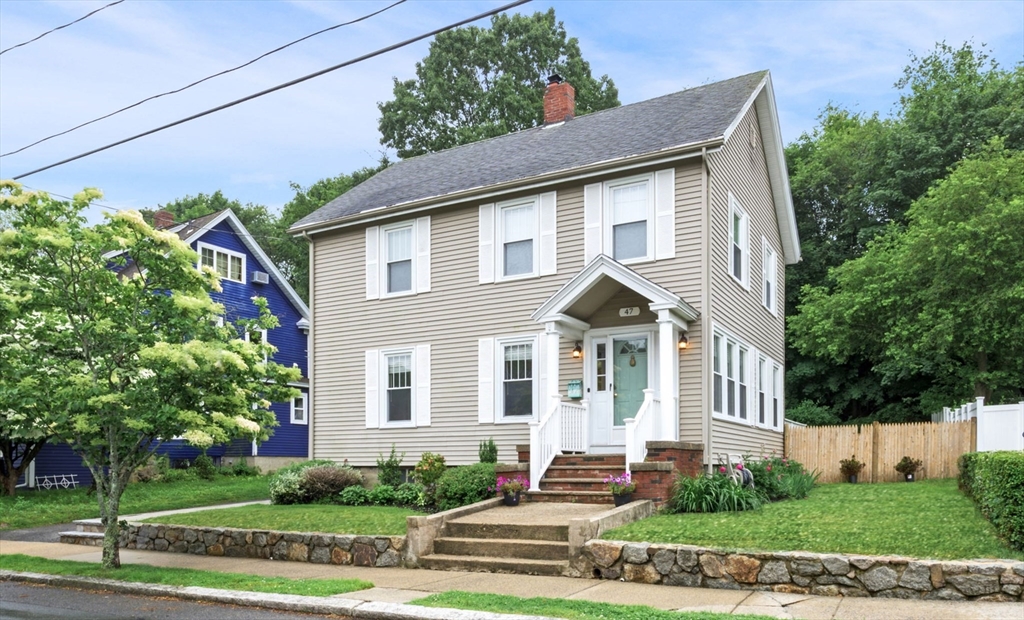
Active under contract
$649,900
4
bds
|
1
ba
|
1,440
sqft
|
built
1922
47 Moffatt Rd, Salem, MA 01970
$-1,155
Cash flow
-9.3%
Cash-on-Cash Return
3.5%
Cap rate
0.6%
Rent to Value Ratio
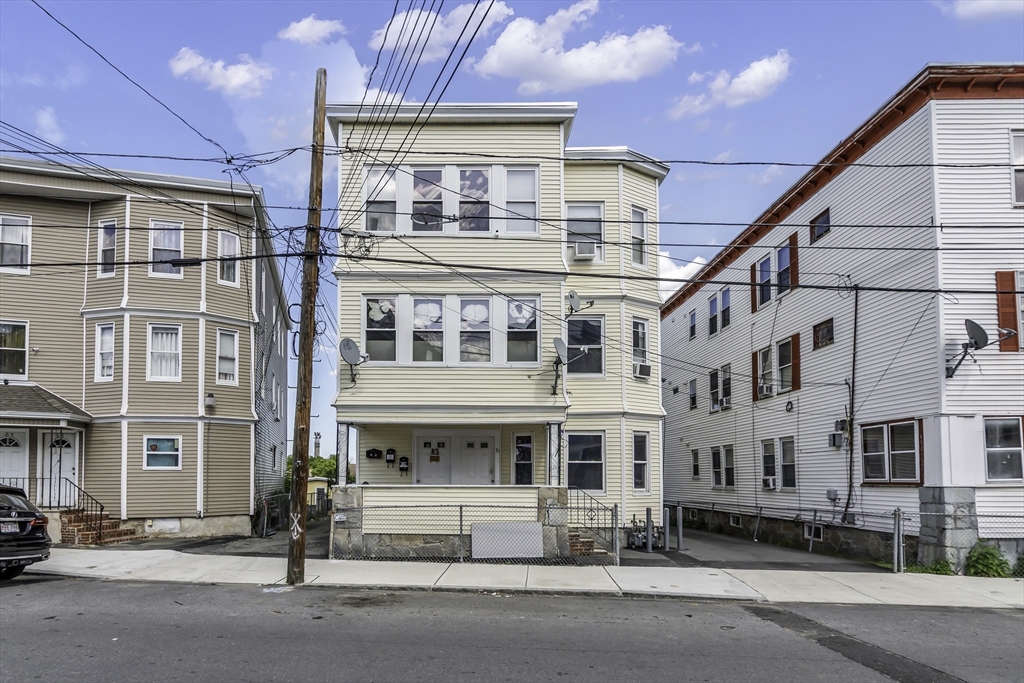
Active under contract
$900,000
9
bds
|
3
ba
|
3,846
sqft
|
built
1925
81-83 Greenwood St, Lawrence, MA 01841
$-2,538
Cash flow
-14.7%
Cash-on-Cash Return
2.3%
Cap rate
0.4%
Rent to Value Ratio
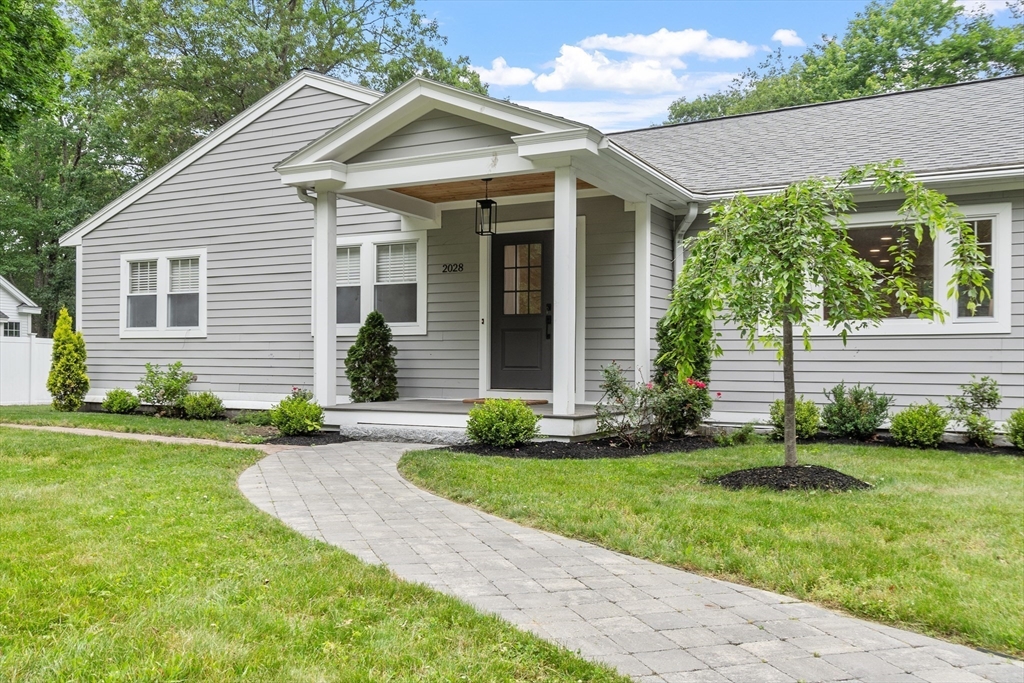
Active under contract
$1,425,000
4
bds
|
3
ba
|
3,115
sqft
|
built
1956
2028 Main St, Concord, MA 01742
$-3,014
Cash flow
-11.0%
Cash-on-Cash Return
3.1%
Cap rate
0.5%
Rent to Value Ratio
Active
$795,000
1
bds
|
1
ba
|
833
sqft
|
built
2011
257 Northampton St, Boston, MA 02118
$-2,407
Cash flow
-15.8%
Cash-on-Cash Return
2.0%
Cap rate
0.5%
Rent to Value Ratio
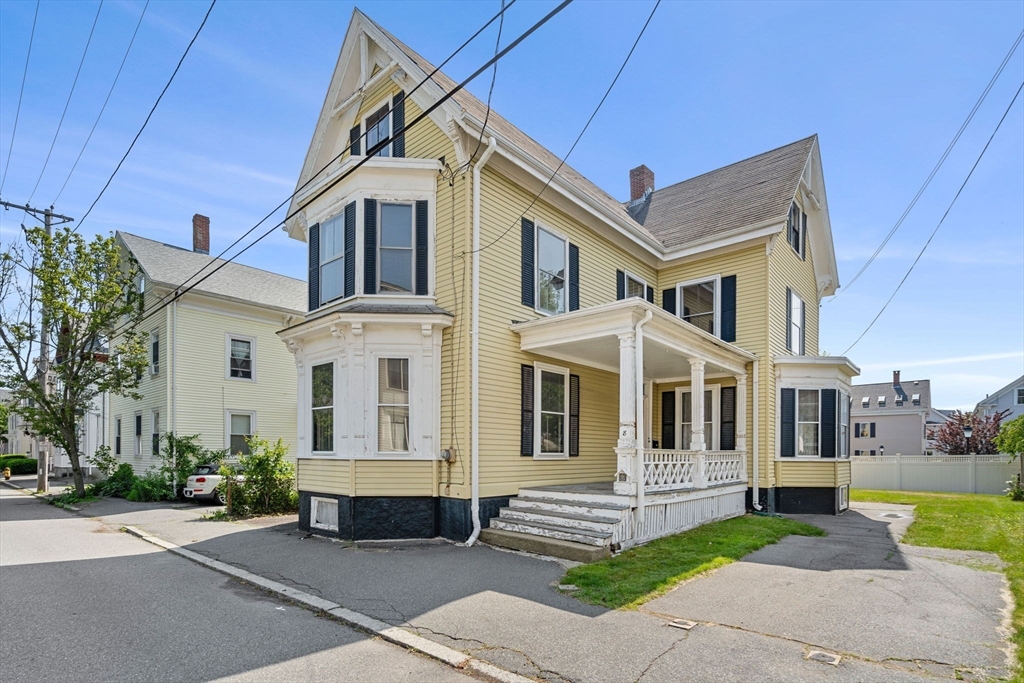
Active
$849,000
4
bds
|
2
ba
|
2,754
sqft
|
built
1880
8 Briggs St, Salem, MA 01970
$-1,781
Cash flow
-10.9%
Cash-on-Cash Return
3.2%
Cap rate
0.5%
Rent to Value Ratio
Active under contract
$344,950
2
bds
|
1
ba
|
720
sqft
|
built
1955
9 Tucker Ter, Randolph, MA 02368
$366
Cash flow
5.5%
Cash-on-Cash Return
7.0%
Cap rate
1.0%
Rent to Value Ratio
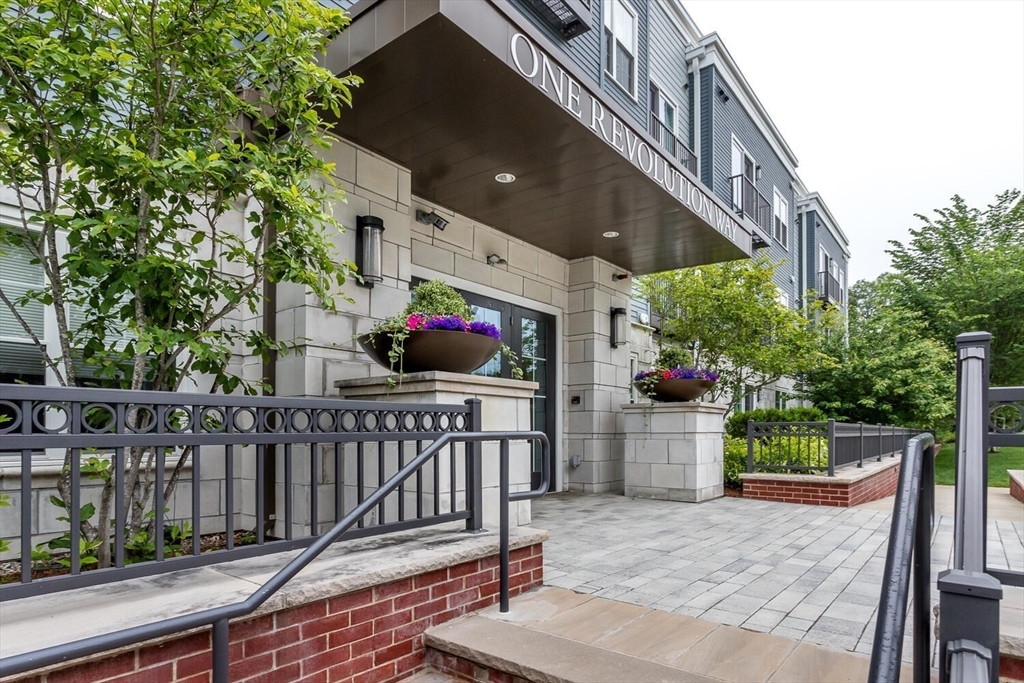
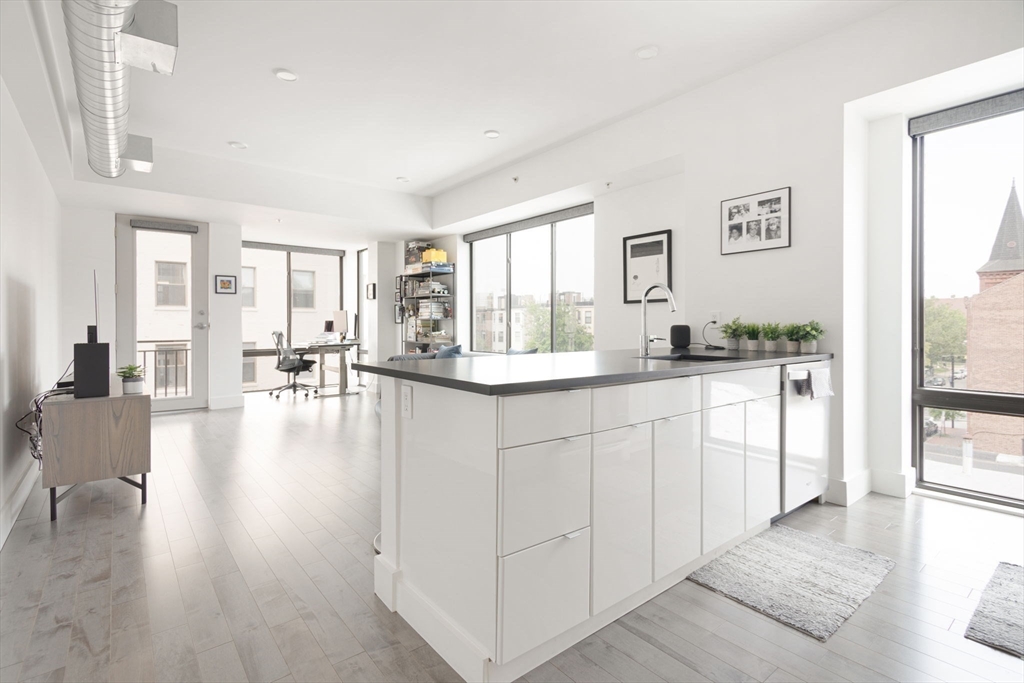
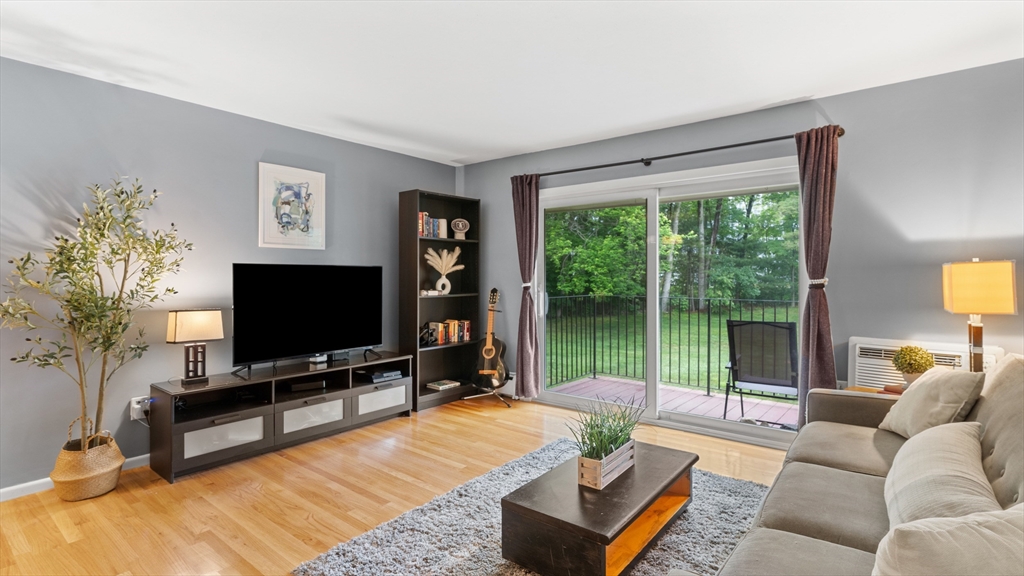
Active
$739,000
2
bds
|
2
ba
|
1,256
sqft
|
built
2019
1 Revolution Way, Canton, MA 02021
$-1,847
Cash flow
-13.0%
Cash-on-Cash Return
2.7%
Cap rate
0.5%
Rent to Value Ratio
Active
$1,599,000
6
bds
|
3
ba
|
3,121
sqft
|
built
1900
373 Medford St, Somerville, MA 02145
$-6,021
Cash flow
-19.6%
Cash-on-Cash Return
1.2%
Cap rate
0.2%
Rent to Value Ratio
Active under contract
$299,000
1
bds
|
1
ba
|
752
sqft
|
built
1966
9 Longwood Dr, Andover, MA 01810
$-640
Cash flow
-11.2%
Cash-on-Cash Return
3.1%
Cap rate
0.7%
Rent to Value Ratio
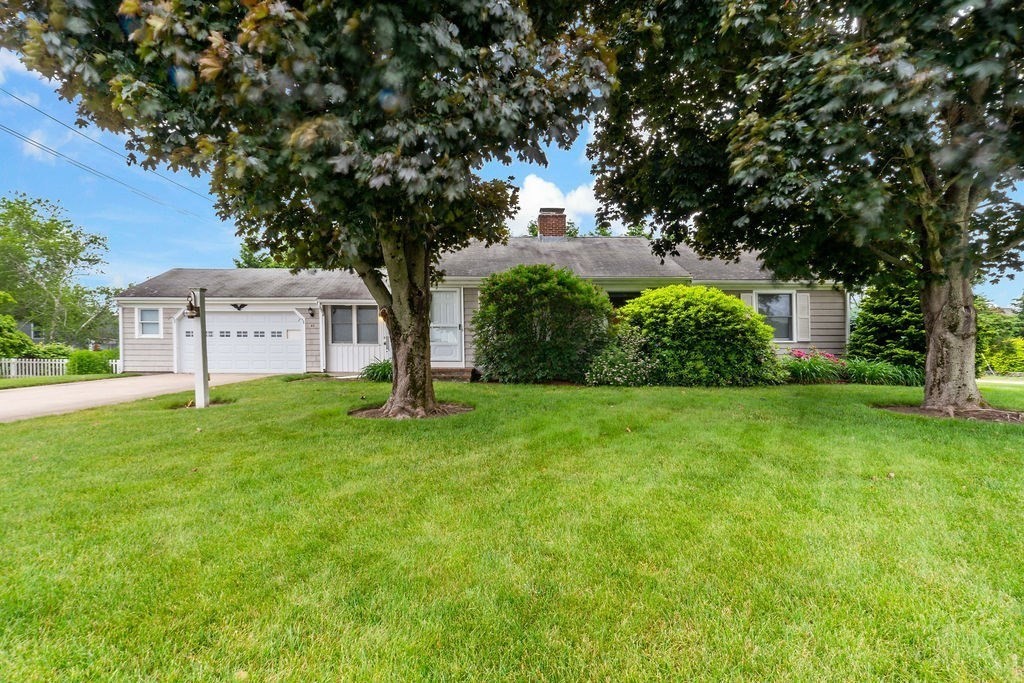
Active
$465,000
2
bds
|
1
ba
|
1,262
sqft
|
built
1963
23 George St, Seekonk, MA 02771
$-684
Cash flow
-7.7%
Cash-on-Cash Return
3.9%
Cap rate
0.6%
Rent to Value Ratio
Pending
$459,000
3
bds
|
2
ba
|
1,219
sqft
|
built
1900
26 Mansfield St, Gloucester, MA 01930
$-574
Cash flow
-6.5%
Cash-on-Cash Return
4.2%
Cap rate
0.6%
Rent to Value Ratio
Active
$1,199,900
7
bds
|
2
ba
|
2,696
sqft
|
built
1935
27-29 Waite St, Malden, MA 02148
$-4,082
Cash flow
-17.7%
Cash-on-Cash Return
1.6%
Cap rate
0.3%
Rent to Value Ratio
Active under contract
$769,900
3
bds
|
2
ba
|
1,562
sqft
|
built
2002
11 Quashnet Woods Dr, Mashpee, MA 02649
$-1,626
Cash flow
-11.0%
Cash-on-Cash Return
3.1%
Cap rate
0.5%
Rent to Value Ratio
Active
$559,999
2
bds
|
1
ba
|
865
sqft
|
built
1930
6 Nelly St, Wakefield, MA 01880
$-1,407
Cash flow
-13.1%
Cash-on-Cash Return
2.7%
Cap rate
0.5%
Rent to Value Ratio
Active under contract
$499,900
3
bds
|
2
ba
|
1,844
sqft
|
built
1997
95 Eleanor St, Fitchburg, MA 01420
$-700
Cash flow
-7.3%
Cash-on-Cash Return
4.0%
Cap rate
0.6%
Rent to Value Ratio
Active
$699,900
4
bds
|
2
ba
|
1,216
sqft
|
built
1953
174 N Central Ave, Quincy, MA 02170
$-1,471
Cash flow
-11.0%
Cash-on-Cash Return
3.2%
Cap rate
0.5%
Rent to Value Ratio
Active
$775,000
4
bds
|
3
ba
|
3,210
sqft
|
built
1997
13 Towne Hill Rd, Haverhill, MA 01835
$-1,353
Cash flow
-9.1%
Cash-on-Cash Return
3.6%
Cap rate
0.6%
Rent to Value Ratio
Active
$1,099,000
5
bds
|
3
ba
|
2,562
sqft
|
built
1974
382 Tilden Rd, Scituate, MA 02066
$-2,522
Cash flow
-12.0%
Cash-on-Cash Return
2.9%
Cap rate
0.4%
Rent to Value Ratio
Active
$985,000
5
bds
|
2
ba
|
2,591
sqft
|
built
1859
167 Brook Rd, Milton, MA 02186
$-2,275
Cash flow
-12.1%
Cash-on-Cash Return
2.9%
Cap rate
0.5%
Rent to Value Ratio
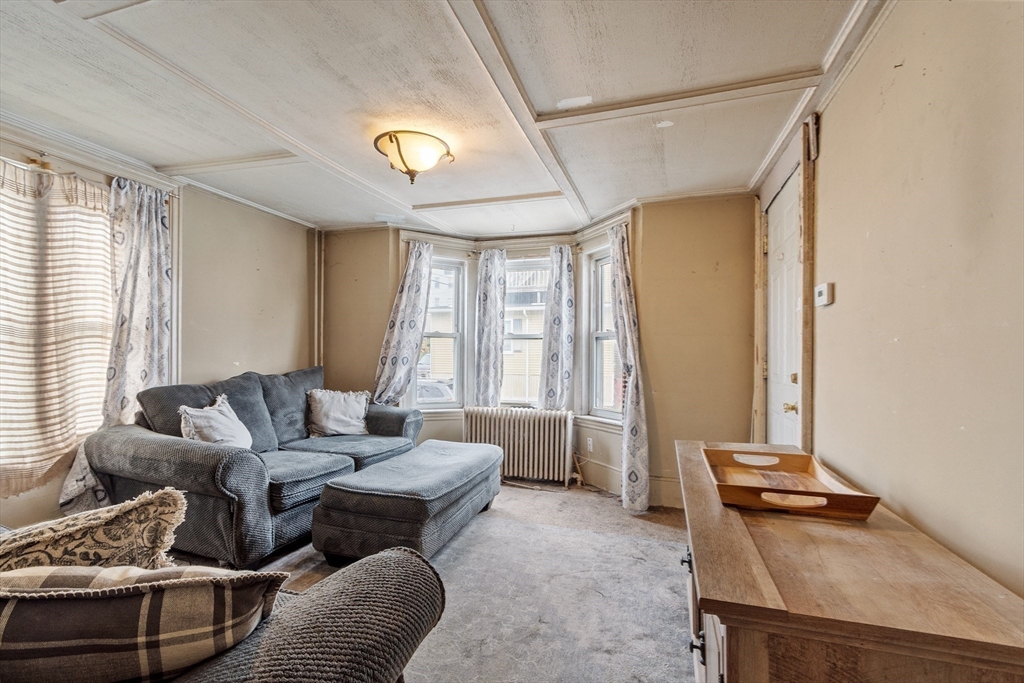
Active
$400,000
3
bds
|
1
ba
|
1,235
sqft
|
built
1900
104 Middle St, Leominster, MA 01453
$-348
Cash flow
-4.5%
Cash-on-Cash Return
4.6%
Cap rate
0.7%
Rent to Value Ratio