Mangonia Park, FL Investment Properties for Sale
Browse homes for sale and investment properties in Mangonia Park, FL. Refine your search by price, property type, or more.
Best cash flowing properties in Mangonia Park, FL
Active
$165,000
2
bds
|
1
ba
|
980
sqft
|
built
1973
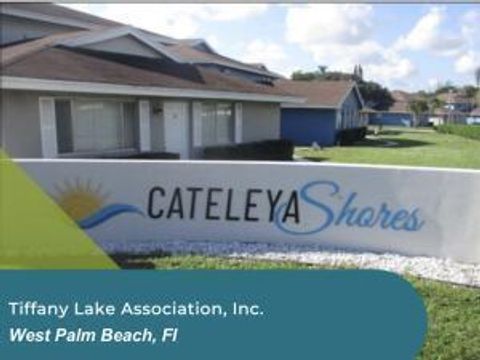
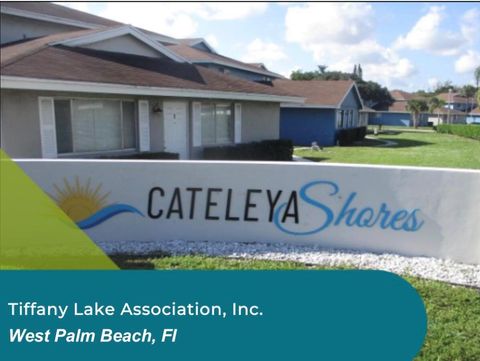
908 E Tiffany Dr, Mangonia Park, FL 33407
$-134
Cash flow
-4.2%
Cash-on-Cash Return
5.2%
Cap rate
1.1%
Rent to Value Ratio
Active
$176,000
2
bds
|
1
ba
|
980
sqft
|
built
1973
810 W Tiffany Dr, Mangonia Park, FL 33407
$-203
Cash flow
-6.0%
Cash-on-Cash Return
4.8%
Cap rate
1.0%
Rent to Value Ratio
7 out of 9 properties for sale in Mangonia Park, FL
Limited Results Shown
Create a free account, or log in to reveal all property listings and enjoy the complete experience.
Active
$405,000
3
bds
|
3
ba
|
1,454
sqft
|
built
2022
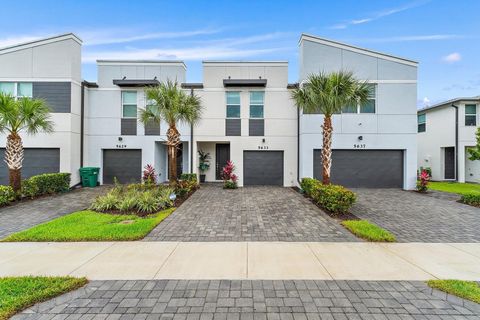
5633 Mentmore Dr, Mangonia Park, FL 33407
$-766
Cash flow
-9.9%
Cash-on-Cash Return
3.9%
Cap rate
0.8%
Rent to Value Ratio

Active
$465,000
3
bds
|
3
ba
|
1,758
sqft
|
built
2023
5720 Mentmore Dr, Mangonia Park, FL 33407
$-978
Cash flow
-11.0%
Cash-on-Cash Return
3.6%
Cap rate
0.7%
Rent to Value Ratio
Active
$389,990
3
bds
|
3
ba
|
1,485
sqft
|
built
2022
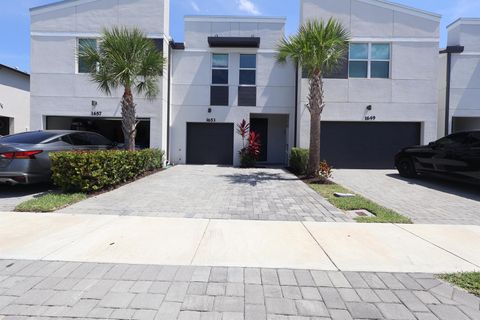
1653 Lindley St, Mangonia Park, FL 33407
$-788
Cash flow
-10.5%
Cash-on-Cash Return
3.7%
Cap rate
0.7%
Rent to Value Ratio
Active
$175,000
2
bds
|
1
ba
|
840
sqft
|
built
1973
826 E Tiffany Dr, Mangonia Park, FL 33407
$-319
Cash flow
-9.5%
Cash-on-Cash Return
4.0%
Cap rate
1.0%
Rent to Value Ratio
Active
$394,999
3
bds
|
3
ba
|
1,454
sqft
|
built
2022
5657 Mentmore Dr, Mangonia Park, FL 33407
$-732
Cash flow
-9.7%
Cash-on-Cash Return
3.9%
Cap rate
0.8%
Rent to Value Ratio