Margate, FL Investment Properties for Sale
Browse homes for sale and investment properties in Margate, FL. Refine your search by price, property type, or more.
Best cash flowing properties in Margate, FL

Active
$125,000
1
bds
|
2
ba
|
900
sqft
|
built
1979
7620 NW 18th St, Margate, FL 33063
$-10
Cash flow
-0.4%
Cash-on-Cash Return
6.0%
Cap rate
1.4%
Rent to Value Ratio

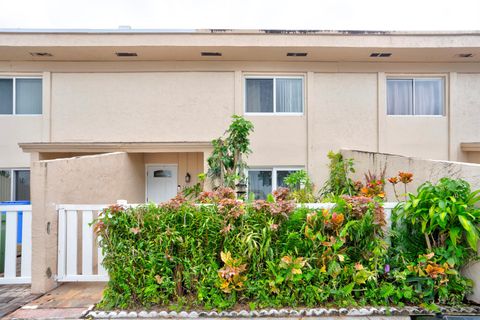
Active
$599,900
4
bds
|
3
ba
|
1,921
sqft
|
built
1970
6466 NW 20th St, Margate, FL 33063
$-98
Cash flow
-0.9%
Cash-on-Cash Return
6.0%
Cap rate
0.8%
Rent to Value Ratio
162 out of 188 properties for sale in Margate, FL
Limited Results Shown
Create a free account, or log in to reveal all property listings and enjoy the complete experience.
Active
$639,000
3
bds
|
3
ba
|
2,044
sqft
|
built
1993
7547 NW 25th St, Margate, FL 33063
$-1,110
Cash flow
-9.1%
Cash-on-Cash Return
4.1%
Cap rate
0.6%
Rent to Value Ratio

Active
$180,000
1
bds
|
1
ba
|
712
sqft
|
built
1990
3340 Pinewalk Dr N, Margate, FL 33063
$-341
Cash flow
-9.9%
Cash-on-Cash Return
3.9%
Cap rate
1.0%
Rent to Value Ratio
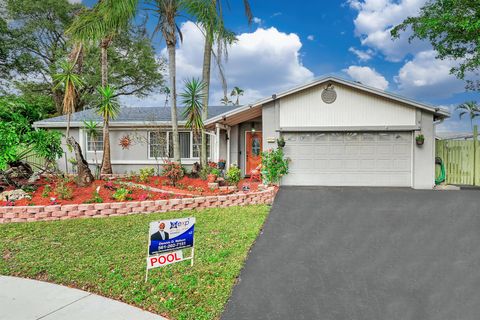
Active
$499,900
4
bds
|
2
ba
|
2,346
sqft
|
built
1960
1905 NW 62nd Ter, Margate, FL 33063
$-807
Cash flow
-8.4%
Cash-on-Cash Return
4.2%
Cap rate
0.8%
Rent to Value Ratio
Active
$525,000
3
bds
|
2
ba
|
1,844
sqft
|
built
1986
2281 NW 70th Ln, Margate, FL 33063
$-1,234
Cash flow
-12.3%
Cash-on-Cash Return
3.3%
Cap rate
0.6%
Rent to Value Ratio
Active
$158,000
1
bds
|
1
ba
|
595
sqft
|
built
1966
6560 Winfield Blvd, Margate, FL 33063
$-405
Cash flow
-13.4%
Cash-on-Cash Return
3.1%
Cap rate
1.0%
Rent to Value Ratio

Active
$349,000
3
bds
|
3
ba
|
1,371
sqft
|
built
2004
3383 Merrick Ct, Margate, FL 33063
$-1,035
Cash flow
-15.5%
Cash-on-Cash Return
2.6%
Cap rate
0.7%
Rent to Value Ratio

Active
$239,000
1
bds
|
2
ba
|
630
sqft
|
built
1986
5550 Lakeside Dr, Margate, FL 33063
$-563
Cash flow
-12.3%
Cash-on-Cash Return
3.3%
Cap rate
0.7%
Rent to Value Ratio
Active
$172,000
1
bds
|
2
ba
|
630
sqft
|
built
1983
5541 Lakeside Dr, Margate, FL 33063
$-261
Cash flow
-7.9%
Cash-on-Cash Return
4.3%
Cap rate
0.9%
Rent to Value Ratio
Active
$499,999
3
bds
|
2
ba
|
1,394
sqft
|
built
1972
391 SW 65th Ave, Margate, FL 33068
$-914
Cash flow
-9.5%
Cash-on-Cash Return
4.0%
Cap rate
0.7%
Rent to Value Ratio
Active
$469,000
2
bds
|
2
ba
|
1,812
sqft
|
built
1975
5361 SW 7th St, Margate, FL 33068
$-963
Cash flow
-10.7%
Cash-on-Cash Return
3.7%
Cap rate
0.7%
Rent to Value Ratio
Active
$125,000
1
bds
|
2
ba
|
900
sqft
|
built
1979
7620 NW 18th St, Margate, FL 33063
$-10
Cash flow
-0.4%
Cash-on-Cash Return
6.0%
Cap rate
1.4%
Rent to Value Ratio
Active
$430,000
3
bds
|
2
ba
|
1,175
sqft
|
built
1959
5561 SW 6th Ct, Margate, FL 33068
$-657
Cash flow
-8.0%
Cash-on-Cash Return
4.3%
Cap rate
0.7%
Rent to Value Ratio

Active
$409,000
3
bds
|
1
ba
|
805
sqft
|
built
1957
1504 NW 58th Ave, Margate, FL 33063
$-845
Cash flow
-10.8%
Cash-on-Cash Return
3.7%
Cap rate
0.6%
Rent to Value Ratio

Active
$542,000
4
bds
|
2
ba
|
1,196
sqft
|
built
1966
6541 NW 5th St, Margate, FL 33063
$-724
Cash flow
-7.0%
Cash-on-Cash Return
4.5%
Cap rate
0.7%
Rent to Value Ratio
Active
$650,000
4
bds
|
2
ba
|
1,710
sqft
|
built
1971
2126 NW 64th Ave, Margate, FL 33063
$-755
Cash flow
-6.1%
Cash-on-Cash Return
4.8%
Cap rate
0.6%
Rent to Value Ratio
Active
$168,000
2
bds
|
1
ba
|
724
sqft
|
built
1966
6560 Winfield Blvd, Margate, FL 33063
$-134
Cash flow
-4.2%
Cash-on-Cash Return
5.2%
Cap rate
1.1%
Rent to Value Ratio
Active
$179,000
1
bds
|
1
ba
|
712
sqft
|
built
1989
3360 Pinewalk Dr N, Margate, FL 33063
$-402
Cash flow
-11.7%
Cash-on-Cash Return
3.5%
Cap rate
0.9%
Rent to Value Ratio
Active
$530,000
3
bds
|
2
ba
|
1,674
sqft
|
built
1958
5813 NW 18th Ct, Margate, FL 33063
$-759
Cash flow
-7.5%
Cash-on-Cash Return
4.4%
Cap rate
0.7%
Rent to Value Ratio
Active
$357,950
3
bds
|
3
ba
|
1,512
sqft
|
built
1978
1455 NW 80th Ave, Margate, FL 33063
$-215
Cash flow
-3.1%
Cash-on-Cash Return
5.4%
Cap rate
0.8%
Rent to Value Ratio
Active
$659,900
4
bds
|
3
ba
|
1,974
sqft
|
built
1996
6604 Schooner Ter, Margate, FL 33063
$-739
Cash flow
-5.8%
Cash-on-Cash Return
4.8%
Cap rate
0.7%
Rent to Value Ratio
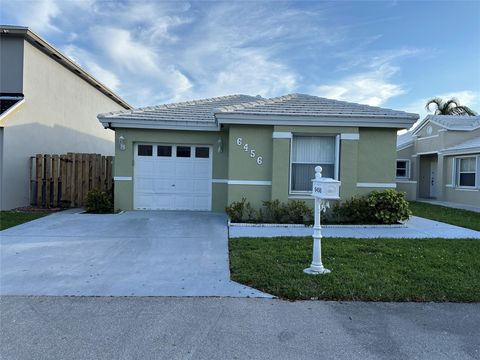
Active
$490,000
3
bds
|
2
ba
|
1,195
sqft
|
built
1993
6456 Rock Beauty Ter, Margate, FL 33063
$-1,048
Cash flow
-11.2%
Cash-on-Cash Return
3.6%
Cap rate
0.7%
Rent to Value Ratio

Active
$174,000
2
bds
|
2
ba
|
1,019
sqft
|
built
1983
310 W Laurel Dr, Margate, FL 33063
$-318
Cash flow
-9.5%
Cash-on-Cash Return
4.0%
Cap rate
1.1%
Rent to Value Ratio
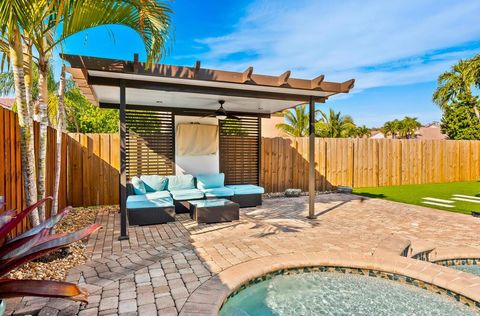
Active
$670,000
4
bds
|
2
ba
|
1,640
sqft
|
built
1985
4924 SW 11th Pl, Margate, FL 33068
$-642
Cash flow
-5.0%
Cash-on-Cash Return
5.0%
Cap rate
0.7%
Rent to Value Ratio
Active
$235,000
2
bds
|
2
ba
|
963
sqft
|
built
1990
3430 Pinewalk Dr N, Margate, FL 33063
$-720
Cash flow
-16.0%
Cash-on-Cash Return
2.5%
Cap rate
0.9%
Rent to Value Ratio
Active
$410,000
3
bds
|
2
ba
|
1,210
sqft
|
built
2002
2938 Crestwood Ter, Margate, FL 33063
$-951
Cash flow
-12.1%
Cash-on-Cash Return
3.4%
Cap rate
0.7%
Rent to Value Ratio
Active
$620,000
4
bds
|
3
ba
|
2,607
sqft
|
built
1992
3100 NW 72nd Ave, Margate, FL 33063
$-793
Cash flow
-6.7%
Cash-on-Cash Return
4.6%
Cap rate
0.7%
Rent to Value Ratio
Active
$378,000
3
bds
|
3
ba
|
1,518
sqft
|
built
2005
3202 Merrick Ter, Margate, FL 33063
$-885
Cash flow
-12.2%
Cash-on-Cash Return
3.3%
Cap rate
0.8%
Rent to Value Ratio
Active
$329,999
2
bds
|
2
ba
|
1,190
sqft
|
built
1996
5525 Parade Pl, Margate, FL 33063
$-629
Cash flow
-9.9%
Cash-on-Cash Return
3.9%
Cap rate
0.8%
Rent to Value Ratio

Active
$549,000
3
bds
|
2
ba
|
1,696
sqft
|
built
1993
6314 Duval Dr, Margate, FL 33063
$-721
Cash flow
-6.9%
Cash-on-Cash Return
4.6%
Cap rate
0.7%
Rent to Value Ratio
Active
$299,000
2
bds
|
3
ba
|
1,199
sqft
|
built
1985
4809 S Hemingway Cir, Margate, FL 33063
$-291
Cash flow
-5.1%
Cash-on-Cash Return
5.0%
Cap rate
0.8%
Rent to Value Ratio
Active
$395,000
3
bds
|
3
ba
|
1,356
sqft
|
built
2006
490 Princess Dr, Margate, FL 33068
$-346
Cash flow
-4.6%
Cash-on-Cash Return
5.1%
Cap rate
0.7%
Rent to Value Ratio
Active
$740,000
4
bds
|
3
ba
|
2,334
sqft
|
built
1996
3123 Sunset Cir, Margate, FL 33063
$-1,852
Cash flow
-13.1%
Cash-on-Cash Return
3.1%
Cap rate
0.6%
Rent to Value Ratio
Active
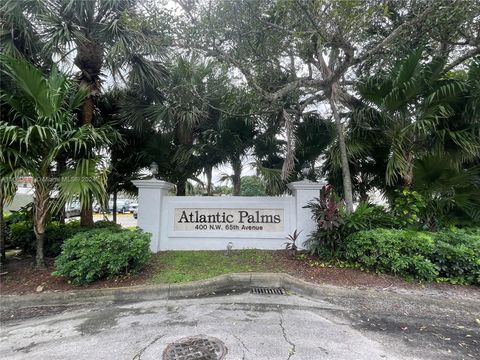
$170,000
2
bds
|
1
ba
|
990
sqft
|
built
1973
400 NW 65th Ave, Margate, FL 33063
$-437
Cash flow
-13.4%
Cash-on-Cash Return
3.1%
Cap rate
1.2%
Rent to Value Ratio

Active
$469,900
3
bds
|
2
ba
|
1,758
sqft
|
built
1960
5801 Royal Palm Blvd, Margate, FL 33063
$-588
Cash flow
-6.5%
Cash-on-Cash Return
4.6%
Cap rate
0.7%
Rent to Value Ratio
Active
$320,000
2
bds
|
2
ba
|
1,110
sqft
|
built
1996
3332 Confetti Ln, Margate, FL 33063
$-487
Cash flow
-7.9%
Cash-on-Cash Return
4.4%
Cap rate
0.7%
Rent to Value Ratio

Active
$210,000
2
bds
|
2
ba
|
1,000
sqft
|
built
1977
7875 Margate Blvd, Margate, FL 33063
$-486
Cash flow
-12.1%
Cash-on-Cash Return
3.4%
Cap rate
1.0%
Rent to Value Ratio
Active
$599,900
4
bds
|
3
ba
|
1,921
sqft
|
built
1970
6466 NW 20th St, Margate, FL 33063
$-98
Cash flow
-0.9%
Cash-on-Cash Return
6.0%
Cap rate
0.8%
Rent to Value Ratio
Active
$234,500
2
bds
|
2
ba
|
1,027
sqft
|
built
1989
3390 Pinewalk Dr N, Margate, FL 33063
$-563
Cash flow
-12.5%
Cash-on-Cash Return
3.3%
Cap rate
0.9%
Rent to Value Ratio

Active
$469,999
3
bds
|
2
ba
|
1,195
sqft
|
built
1990
3084 Lighthouse Pl, Margate, FL 33063
$-924
Cash flow
-10.3%
Cash-on-Cash Return
3.8%
Cap rate
0.7%
Rent to Value Ratio
Active
$699,999
3
bds
|
2
ba
|
1,606
sqft
|
built
1993
6972 NW 19th St, Margate, FL 33063
$-1,301
Cash flow
-9.7%
Cash-on-Cash Return
3.9%
Cap rate
0.6%
Rent to Value Ratio