Maywood, IL Investment Properties for Sale
Browse homes for sale and investment properties in Maywood, IL. Refine your search by price, property type, or more.
Best cash flowing properties in Maywood, IL
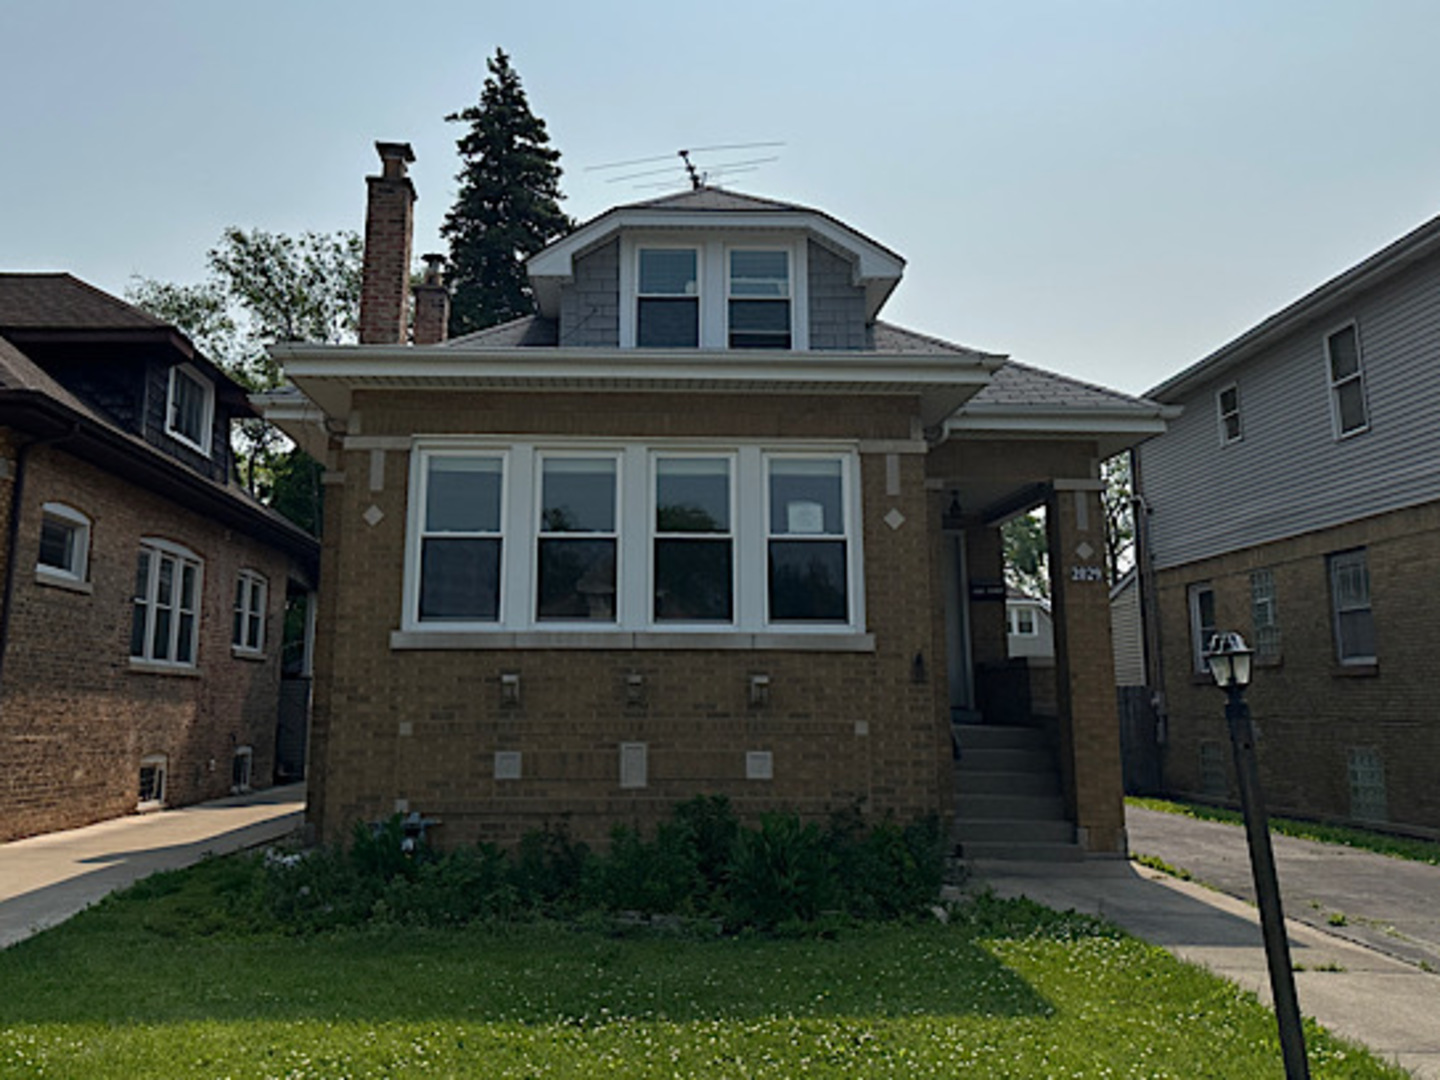
Active
$249,500
3
bds
|
3
ba
|
1,655
sqft
|
built
1926
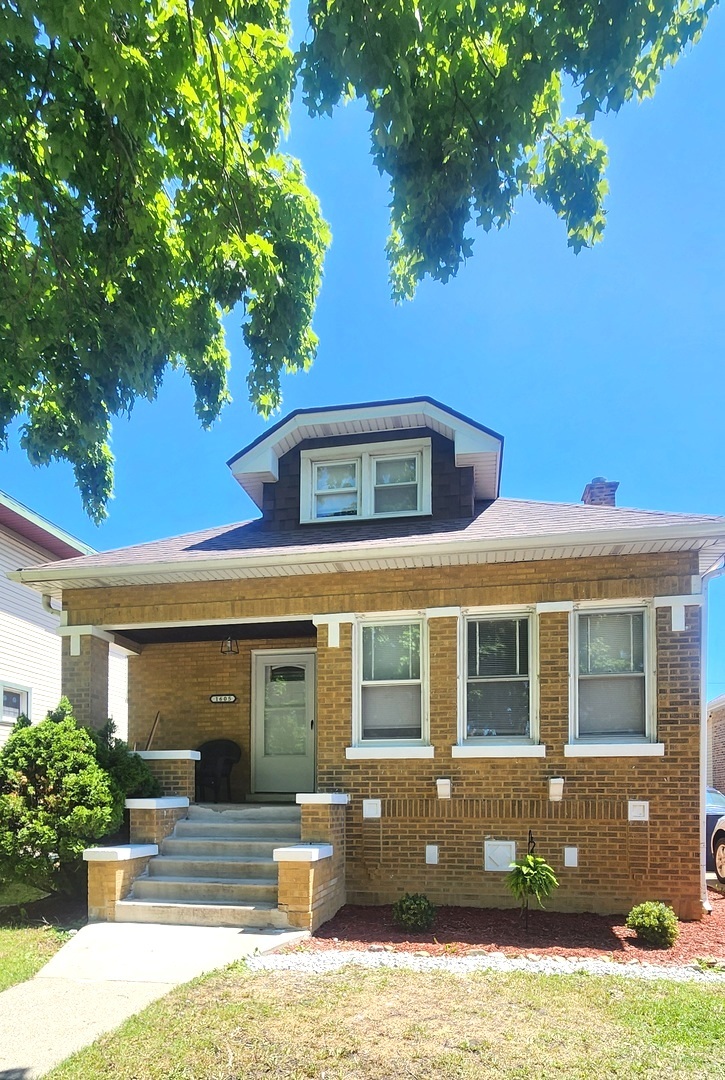
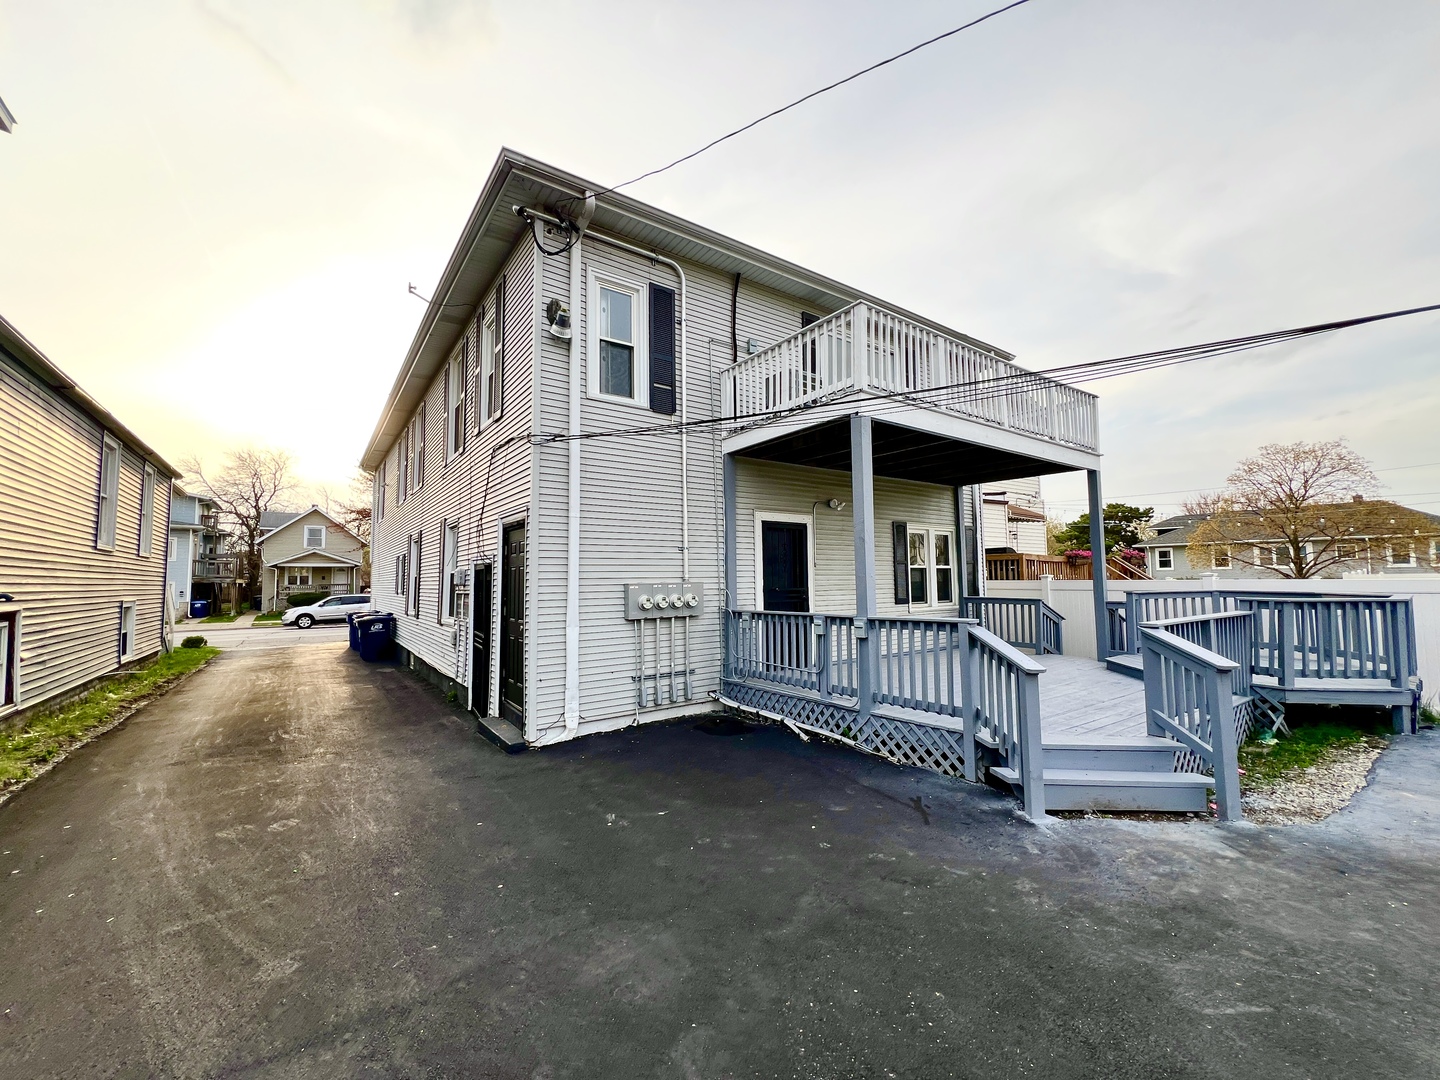
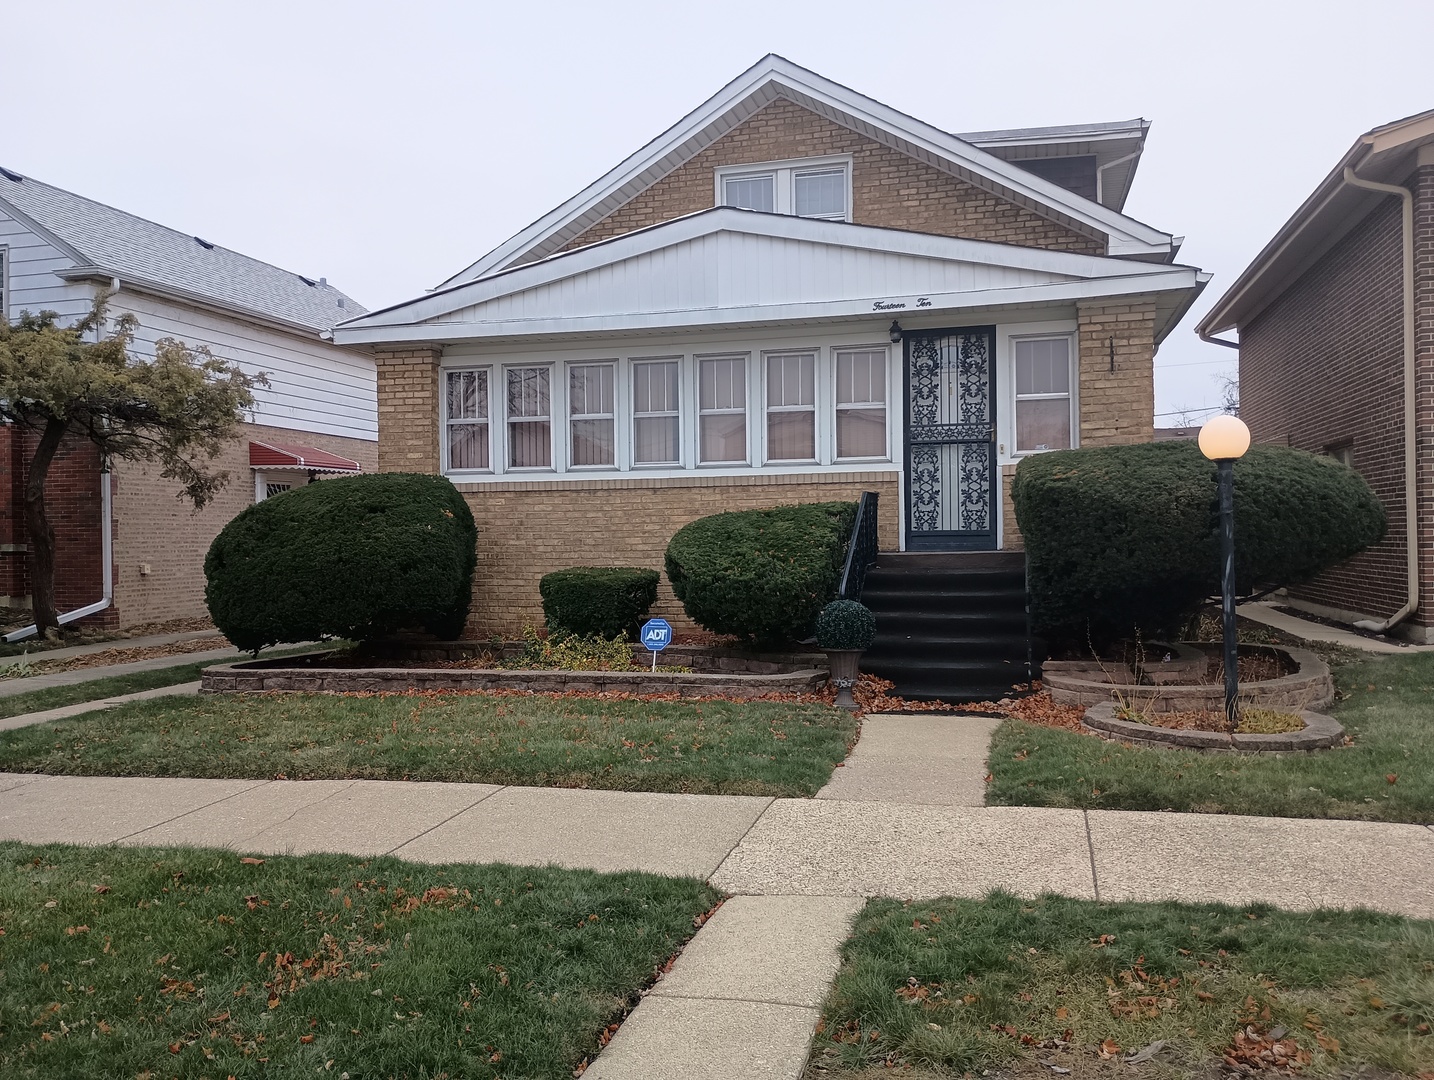
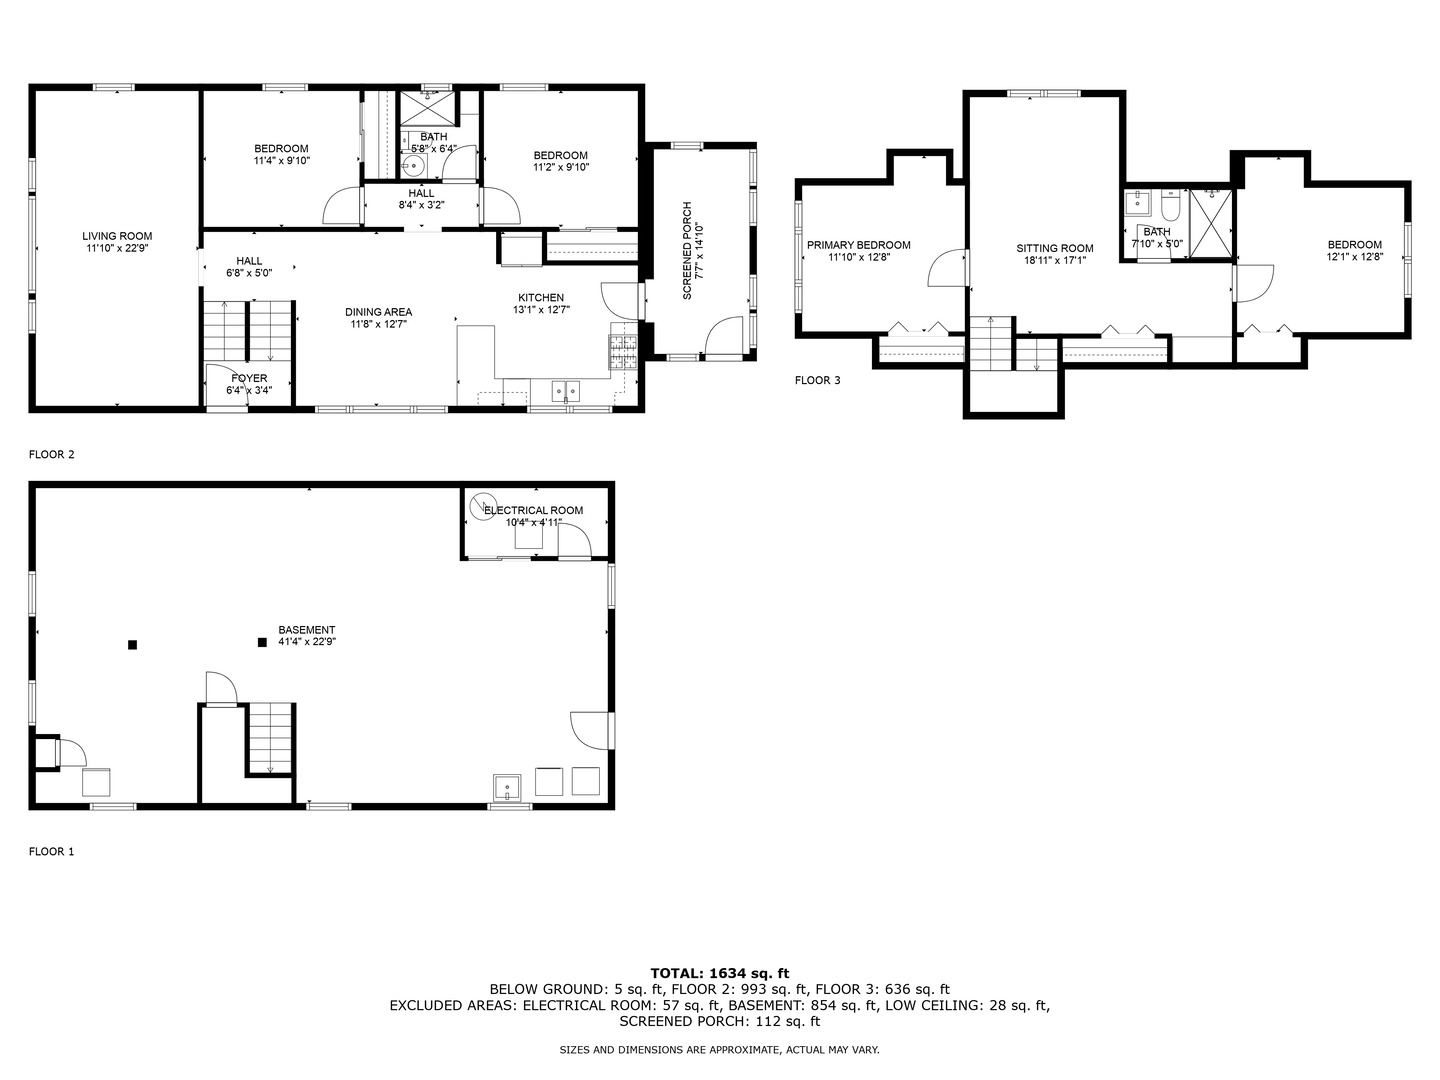
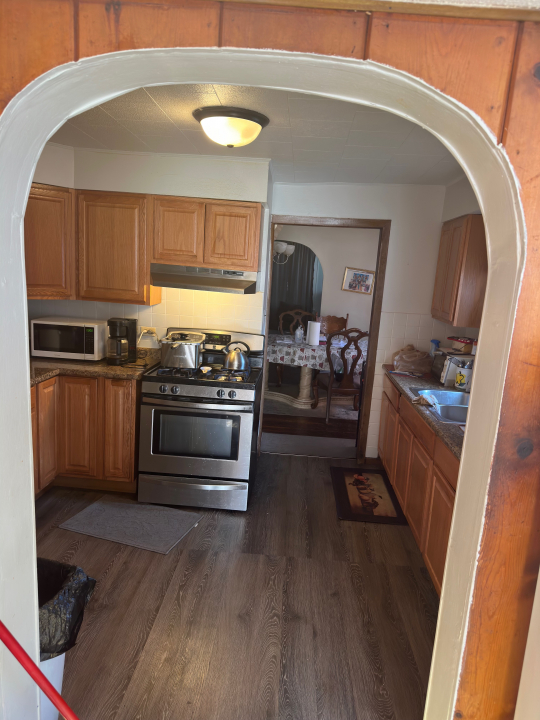
2029 S 11th Ave, Maywood, IL 60153
$287
Cash flow
6.0%
Cash-on-Cash Return
7.1%
Cap rate
1.2%
Rent to Value Ratio
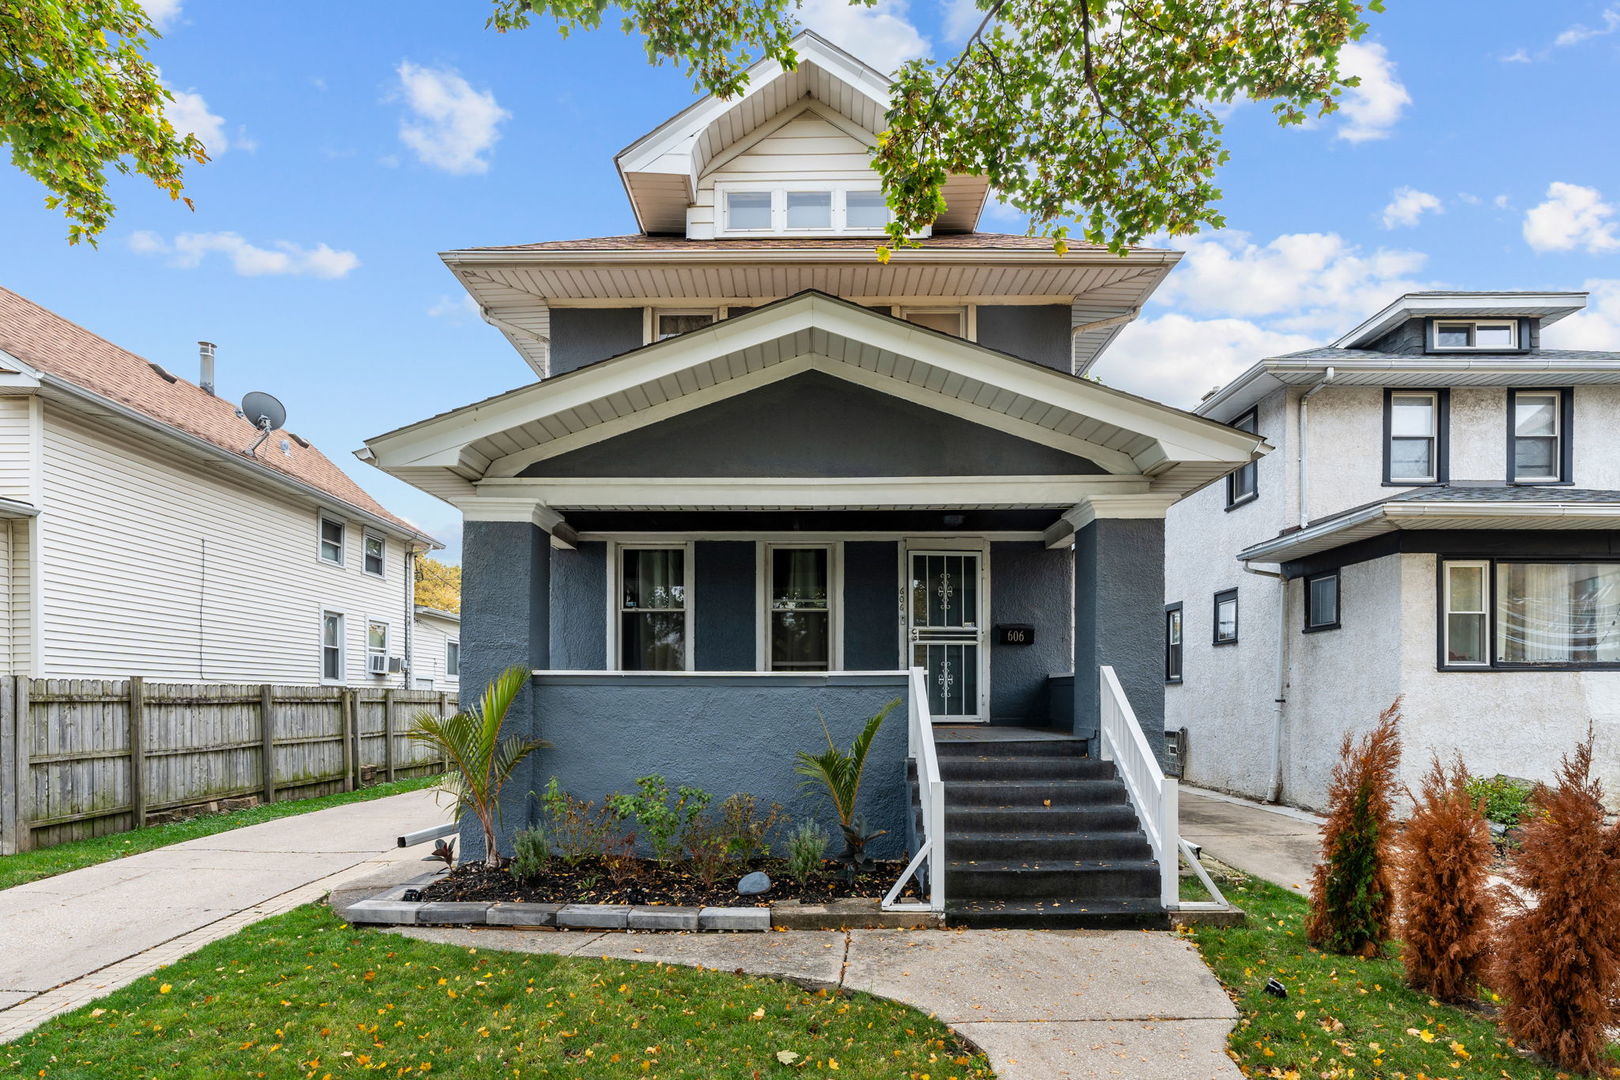
Active
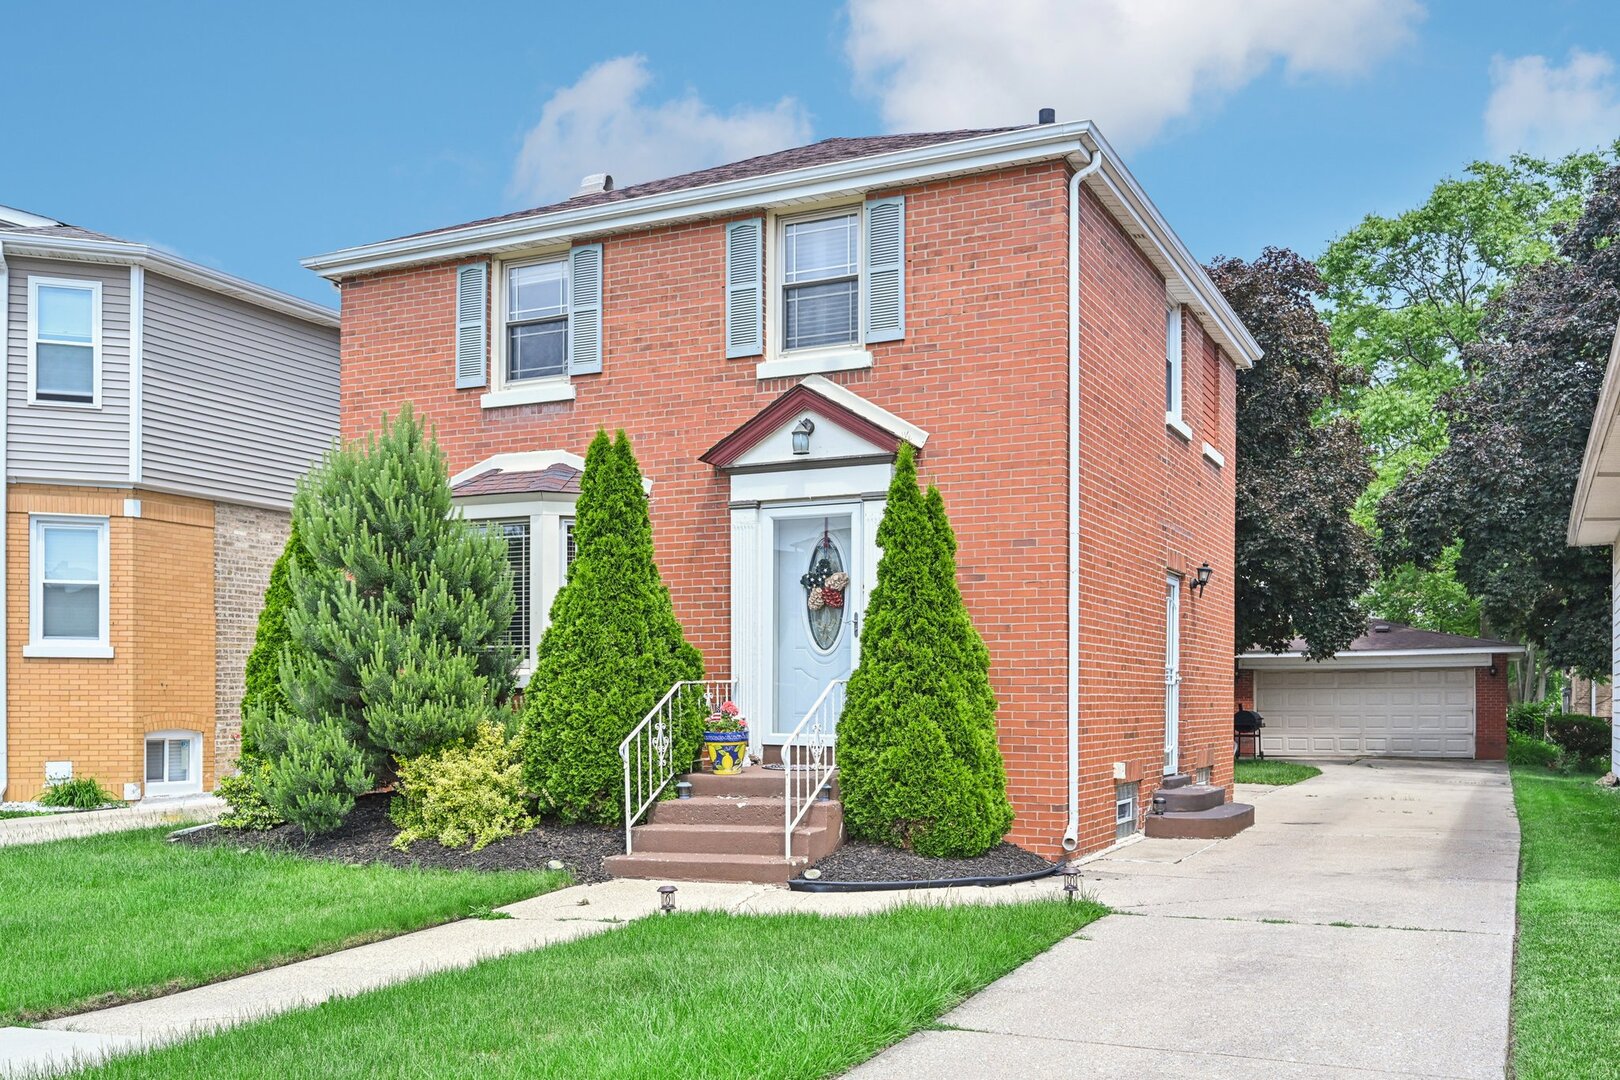
$385,000
3
bds
|
3
ba
|
2,000
sqft
|
built
1918
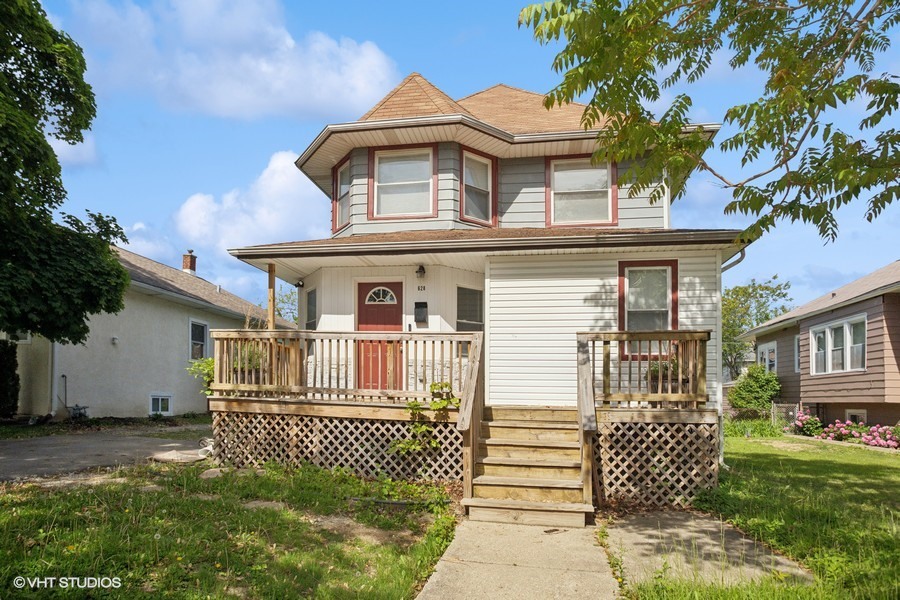
606 S 2nd Ave, Maywood, IL 60153
$224
Cash flow
3.0%
Cash-on-Cash Return
6.4%
Cap rate
0.9%
Rent to Value Ratio
25 out of 30 properties for sale in Maywood, IL
Limited Results Shown
Create a free account, or log in to reveal all property listings and enjoy the complete experience.
Active
$385,000
3
bds
|
3
ba
|
2,000
sqft
|
built
1918
606 S 2nd Ave, Maywood, IL 60153
$224
Cash flow
3.0%
Cash-on-Cash Return
6.4%
Cap rate
0.9%
Rent to Value Ratio
Active
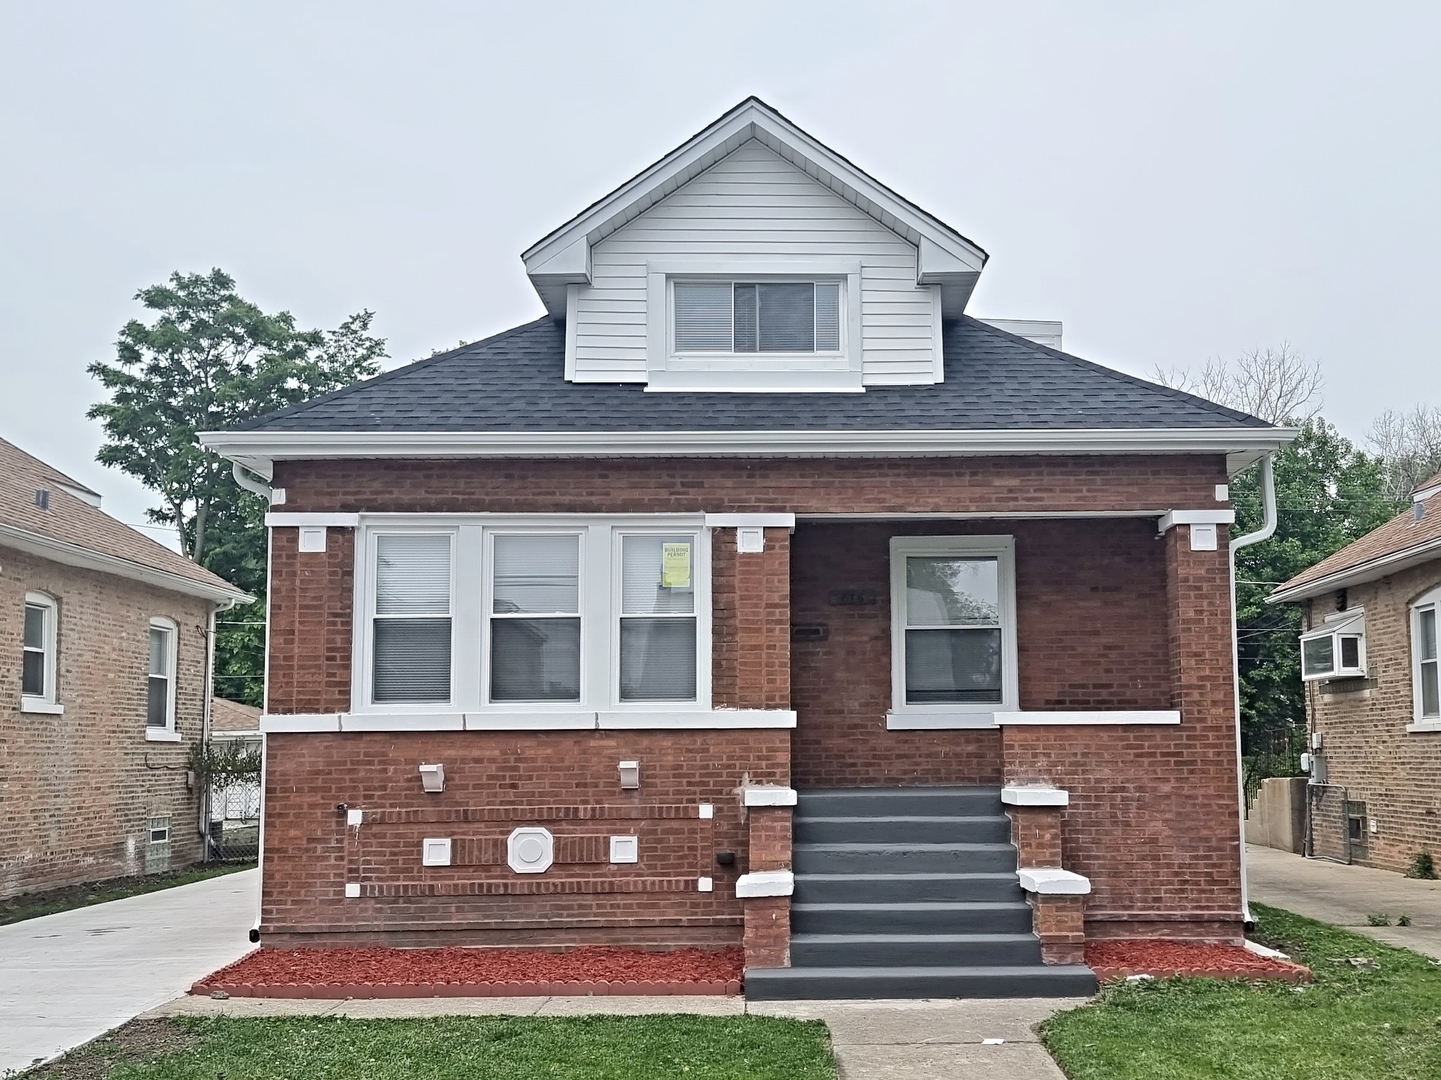
$249,500
3
bds
|
3
ba
|
1,655
sqft
|
built
1926
2029 S 11th Ave, Maywood, IL 60153
$287
Cash flow
6.0%
Cash-on-Cash Return
7.1%
Cap rate
1.2%
Rent to Value Ratio
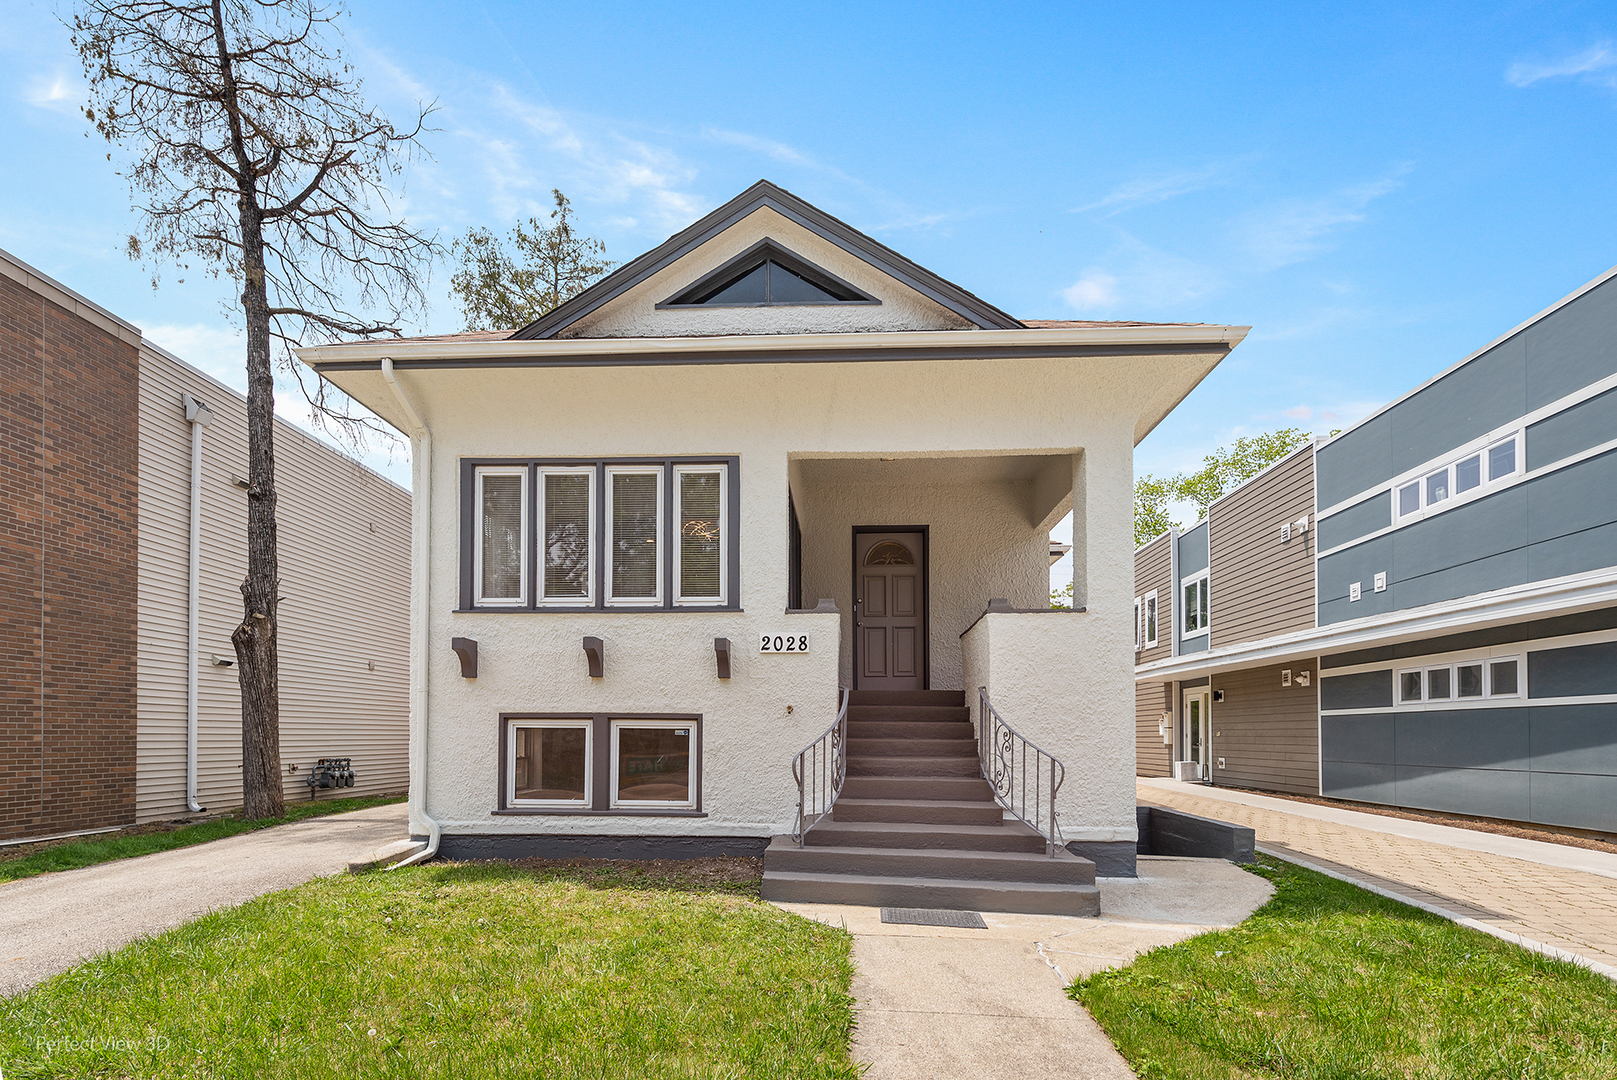
Active
$347,500
2
bds
|
2
ba
|
1,105
sqft
|
built
1912
2028 S 5th Ave, Maywood, IL 60153
$-833
Cash flow
-12.5%
Cash-on-Cash Return
2.8%
Cap rate
0.6%
Rent to Value Ratio
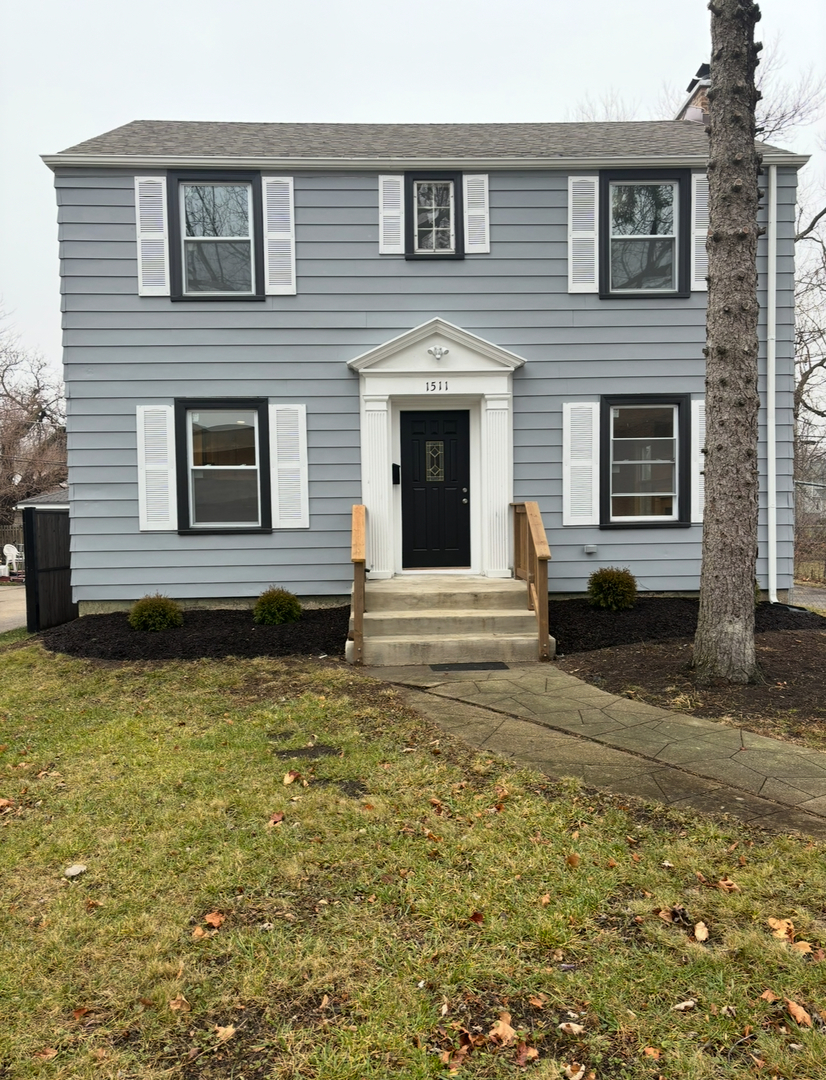
Active
$315,000
3
bds
|
1
ba
|
1,334
sqft
|
built
1938
1511 S 9th Ave, Maywood, IL 60153
$-98
Cash flow
-1.6%
Cash-on-Cash Return
5.3%
Cap rate
0.9%
Rent to Value Ratio
Active
$439,000
4
bds
|
3
ba
|
2,787
sqft
|
built
1926
816 S 21st Ave, Maywood, IL 60153
$-1,208
Cash flow
-14.4%
Cash-on-Cash Return
2.4%
Cap rate
0.5%
Rent to Value Ratio
Active
$389,000
3
bds
|
3
ba
|
1,843
sqft
|
built
1941
807 S 20th Ave, Maywood, IL 60153
$-301
Cash flow
-4.0%
Cash-on-Cash Return
4.8%
Cap rate
0.8%
Rent to Value Ratio
Active
$349,000
3
bds
|
2
ba
|
1,400
sqft
|
built
1940
1927 S 18th Ave, Maywood, IL 60153
$-335
Cash flow
-5.0%
Cash-on-Cash Return
4.5%
Cap rate
0.7%
Rent to Value Ratio
Active under contract
$419,000
4
bds
|
3
ba
|
0
sqft
|
built
1909
412 S 12th Ave, Maywood, IL 60153
$-1,286
Cash flow
-16.0%
Cash-on-Cash Return
2.0%
Cap rate
0.5%
Rent to Value Ratio
Active
$349,900
3
bds
|
2
ba
|
2,675
sqft
|
built
1952
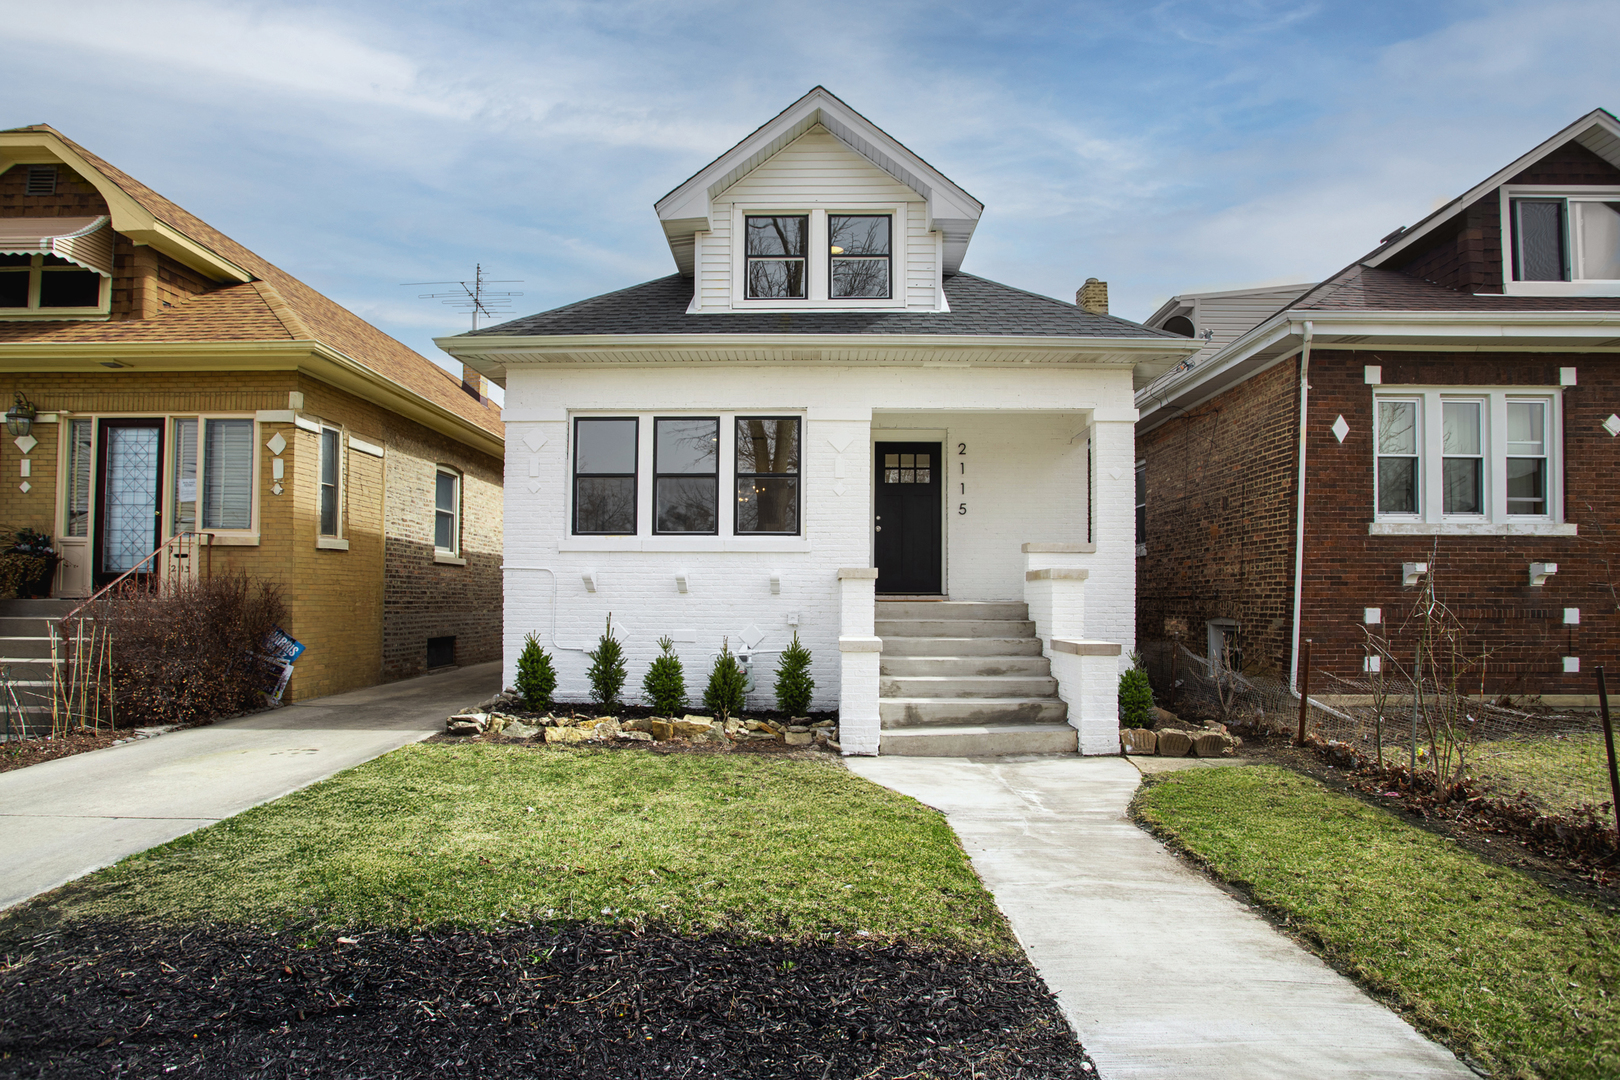
2115 S 7th Ave, Maywood, IL 60153
$-588
Cash flow
-8.8%
Cash-on-Cash Return
3.7%
Cap rate
0.7%
Rent to Value Ratio
Active
$424,900
4
bds
|
3
ba
|
2,000
sqft
|
built
1925
821 S 20th Ave, Maywood, IL 60153
$-836
Cash flow
-10.3%
Cash-on-Cash Return
3.3%
Cap rate
0.7%
Rent to Value Ratio
Active
$415,000
5
bds
|
2
ba
|
2,393
sqft
|
built
1907
1100 S 3rd Ave, Maywood, IL 60153
$-954
Cash flow
-12.0%
Cash-on-Cash Return
2.9%
Cap rate
0.6%
Rent to Value Ratio
Active
$379,999
3
bds
|
3
ba
|
2,304
sqft
|
built
1899
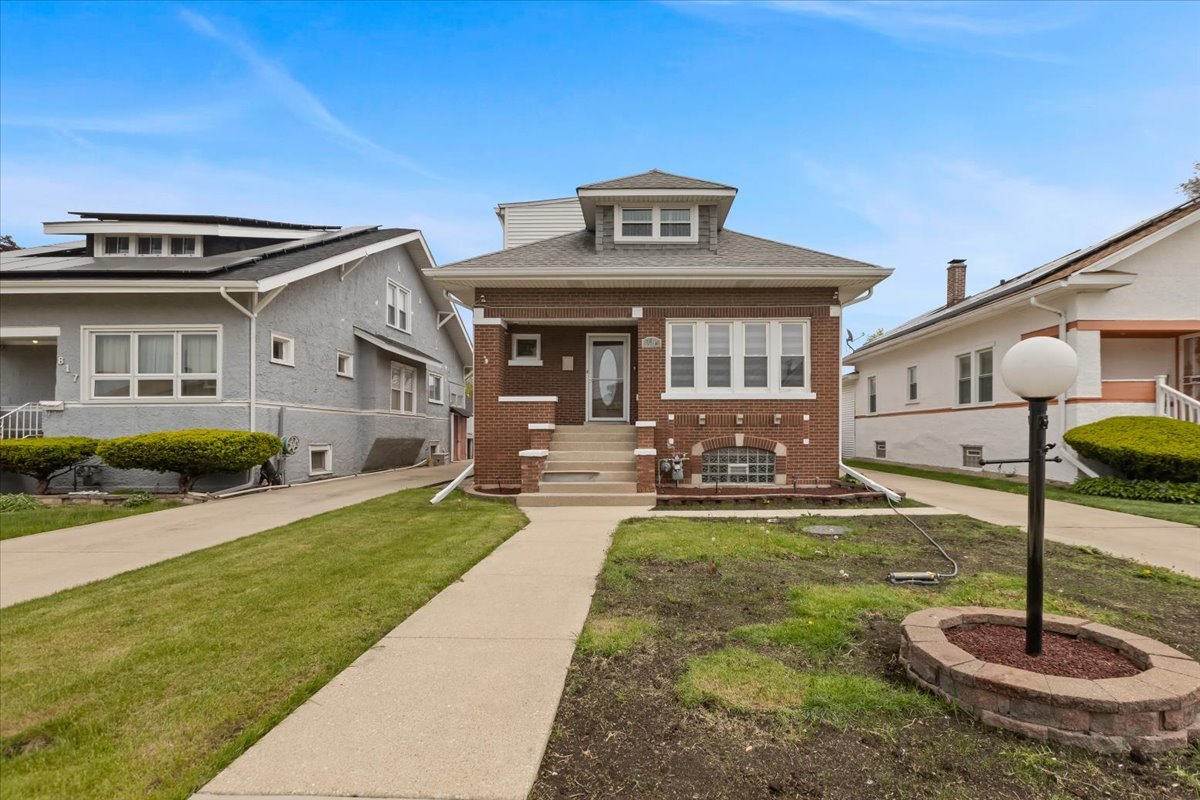
212 S 11th Ave, Maywood, IL 60153
$130
Cash flow
1.8%
Cash-on-Cash Return
6.1%
Cap rate
0.9%
Rent to Value Ratio
Active
$265,000
4
bds
|
1
ba
|
1,070
sqft
|
built
1926
1605 S 16th Ave, Maywood, IL 60153
$-299
Cash flow
-5.9%
Cash-on-Cash Return
4.3%
Cap rate
0.8%
Rent to Value Ratio
Active
$335,000
4
bds
|
2
ba
|
1,860
sqft
|
built
1909
628 S 15th Ave, Maywood, IL 60153
$11
Cash flow
0.2%
Cash-on-Cash Return
5.7%
Cap rate
0.9%
Rent to Value Ratio
Active
$325,000
2
bds
|
2
ba
|
800
sqft
|
built
1922
1914 S 21st Ave, Maywood, IL 60153
$-1,009
Cash flow
-16.2%
Cash-on-Cash Return
2.0%
Cap rate
0.5%
Rent to Value Ratio
Active
$259,900
2
bds
|
2
ba
|
1,724
sqft
|
built
1926
2101 S 7th Ave, Maywood, IL 60153
$-348
Cash flow
-7.0%
Cash-on-Cash Return
4.1%
Cap rate
0.9%
Rent to Value Ratio
Active under contract
$529,900
6
bds
|
4
ba
|
0
sqft
|
built
1893
505 S 9th Ave, Maywood, IL 60153
$-2,067
Cash flow
-20.4%
Cash-on-Cash Return
1.0%
Cap rate
0.4%
Rent to Value Ratio

Active
$399,900
4
bds
|
3
ba
|
2,200
sqft
|
built
1924
1902 S 9th Ave, Maywood, IL 60153
$-455
Cash flow
-5.9%
Cash-on-Cash Return
4.3%
Cap rate
0.9%
Rent to Value Ratio
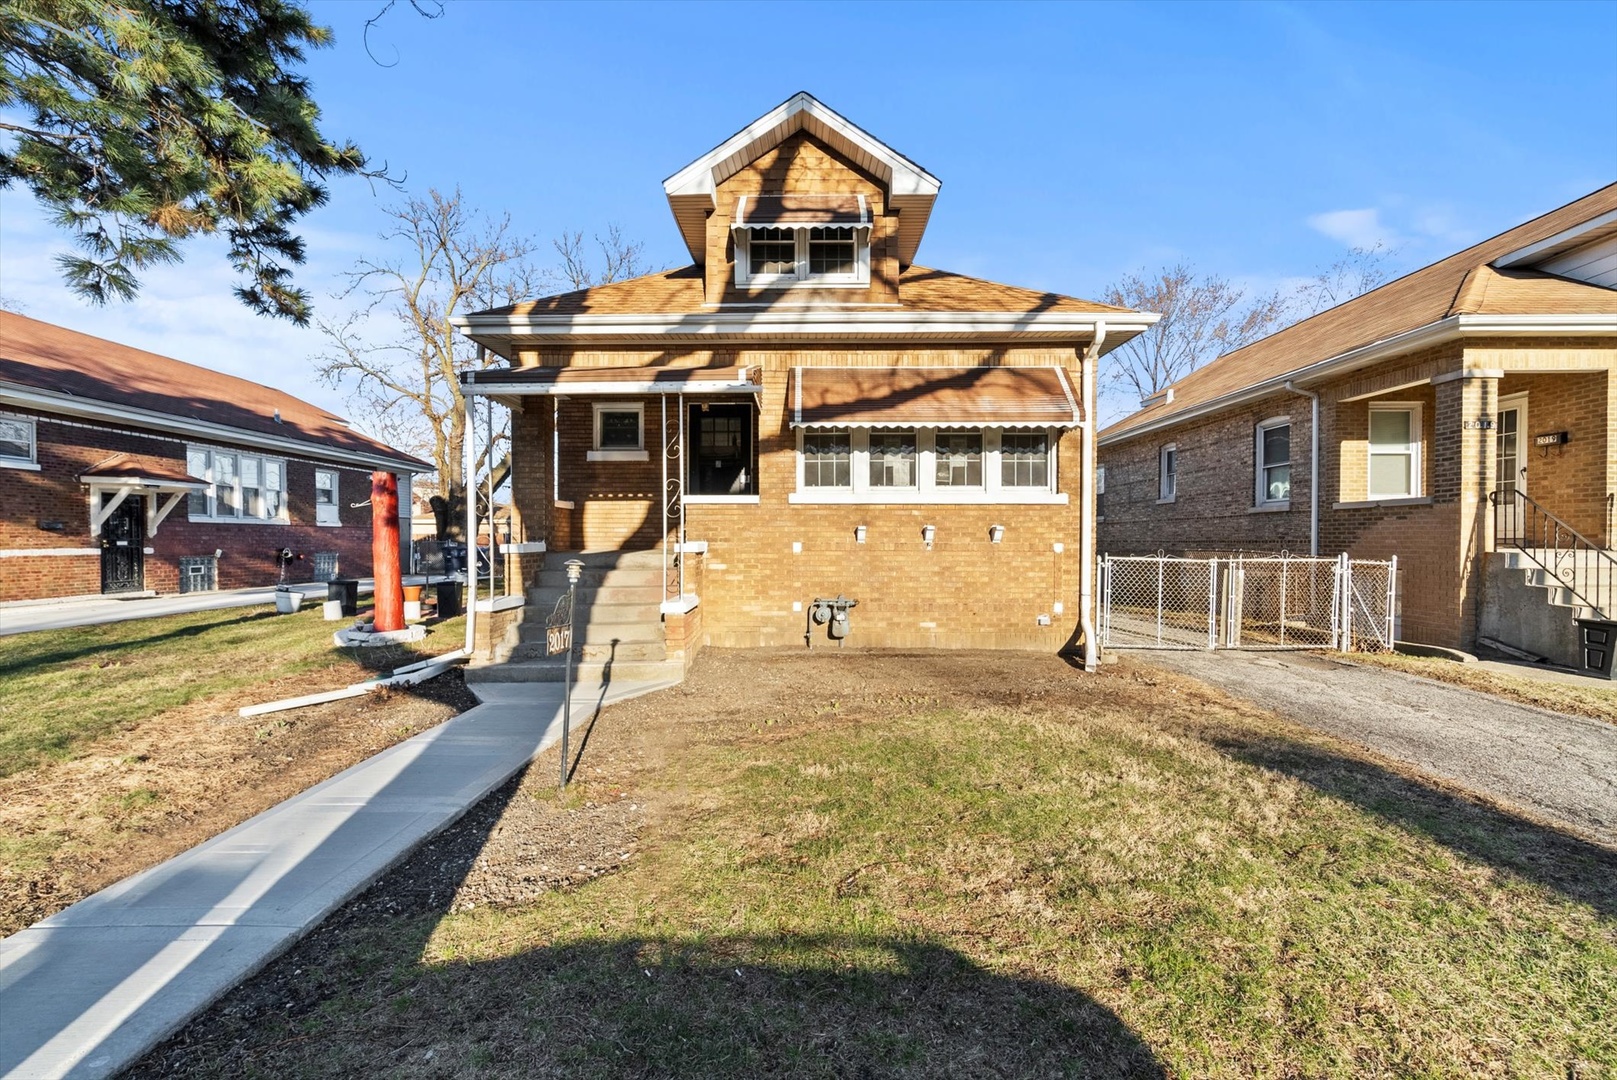
Closed
$375,000
4
bds
|
2
ba
|
1,380
sqft
|
built
1928
2017 S 5th Ave, Maywood, IL 60153
$-327
Cash flow
-4.5%
Cash-on-Cash Return
4.6%
Cap rate
0.7%
Rent to Value Ratio
Active
$339,900
3
bds
|
2
ba
|
1,117
sqft
|
built
1915
1825 S 8th Ave, Maywood, IL 60153
$-669
Cash flow
-10.3%
Cash-on-Cash Return
3.3%
Cap rate
0.7%
Rent to Value Ratio
Active
$194,000
2
bds
|
2
ba
|
1,000
sqft
|
built
1925
2010 S 7th Ave, Maywood, IL 60153
$-140
Cash flow
-3.8%
Cash-on-Cash Return
4.8%
Cap rate
1.0%
Rent to Value Ratio
Pending
$259,900
3
bds
|
1
ba
|
1,163
sqft
|
built
1923
1410 S 21st Ave, Maywood, IL 60153
$85
Cash flow
1.7%
Cash-on-Cash Return
6.1%
Cap rate
1.0%
Rent to Value Ratio
Active
$445,000
4
bds
|
2
ba
|
1,800
sqft
|
built
1924
1702 S 4th Ave, Maywood, IL 60153
$-503
Cash flow
-5.9%
Cash-on-Cash Return
4.3%
Cap rate
0.7%
Rent to Value Ratio

Active
$284,900
3
bds
|
1
ba
|
1,185
sqft
|
built
1923
1329 S 12th Ave, Maywood, IL 60153
$-15
Cash flow
-0.3%
Cash-on-Cash Return
5.6%
Cap rate
1.0%
Rent to Value Ratio
Active
$250,000
4
bds
|
2
ba
|
1,058
sqft
|
built
1912
1416 S 17th Ave, Maywood, IL 60153
$38
Cash flow
0.8%
Cash-on-Cash Return
5.9%
Cap rate
1.0%
Rent to Value Ratio