Kent County Investment Properties for Sale
Browse homes for sale and investment properties in Kent County. Refine your search by price, property type, or more.
Best cash flowing properties in Kent County
Active
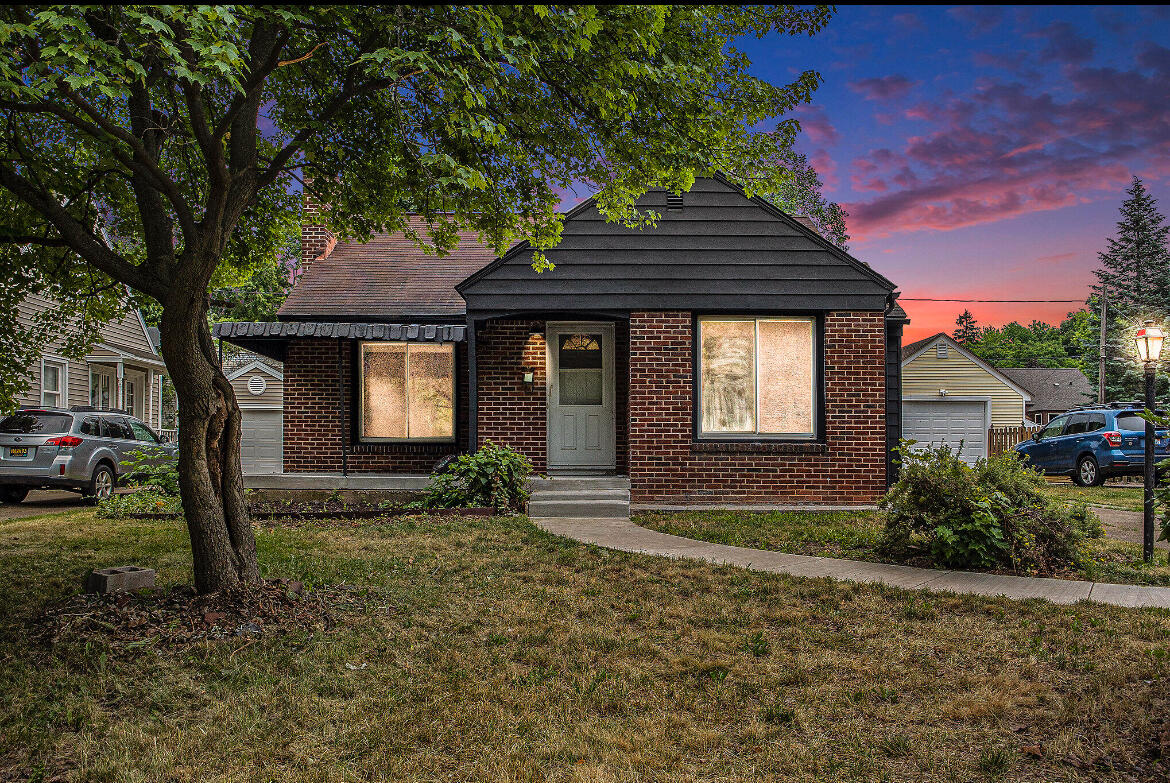
$205,900
2
bds
|
1
ba
|
852
sqft
|
built
1920
6773 Kitson Dr NE, Rockford, MI 49341
$108
Cash flow
2.7%
Cash-on-Cash Return
6.8%
Cap rate
0.9%
Rent to Value Ratio
Active
$200,000
3
bds
|
2
ba
|
1,494
sqft
|
built
1925
1230 Prospect Ave SE, Grand Rapids, MI 49507
$0
Cash flow
0.0%
Cash-on-Cash Return
6.1%
Cap rate
0.8%
Rent to Value Ratio
476 out of 645 properties for sale in Kent County
Limited Results Shown
Create a free account, or log in to reveal all property listings and enjoy the complete experience.
Active
$1,995,000
6
bds
|
4
ba
|
4,394
sqft
|
built
2011
7192 Wilkinson Dr NE, Rockford, MI 49341
$-8,077
Cash flow
-21.1%
Cash-on-Cash Return
1.3%
Cap rate
0.2%
Rent to Value Ratio
Active
$689,000
3
bds
|
3
ba
|
2,765
sqft
|
built
2000
6817 Martin View St NE, Rockford, MI 49341
$-1,766
Cash flow
-13.4%
Cash-on-Cash Return
3.1%
Cap rate
0.5%
Rent to Value Ratio
Active
$320,000
2
bds
|
2
ba
|
1,237
sqft
|
built
1900
600 Broadway Ave NW, Grand Rapids, MI 49504
$-678
Cash flow
-11.1%
Cash-on-Cash Return
3.6%
Cap rate
0.8%
Rent to Value Ratio
Active
$1,175,000
6
bds
|
5
ba
|
4,806
sqft
|
built
2007
10377 Ivanrest Ave SW, Byron Center, MI 49315
$-3,908
Cash flow
-17.4%
Cash-on-Cash Return
2.2%
Cap rate
0.3%
Rent to Value Ratio
Active
$1,149,000
4
bds
|
4
ba
|
4,242
sqft
|
built
1978
2370 Holtman Dr NE, Grand Rapids, MI 49525
$-3,899
Cash flow
-17.7%
Cash-on-Cash Return
2.1%
Cap rate
0.3%
Rent to Value Ratio
Pending
$1,350,000
4
bds
|
5
ba
|
3,956
sqft
|
built
1967
589 Grand River Dr NE, Ada, MI 49301
$-3,861
Cash flow
-14.9%
Cash-on-Cash Return
2.7%
Cap rate
0.4%
Rent to Value Ratio
Active
$675,000
5
bds
|
4
ba
|
4,143
sqft
|
built
2022
658 Petoskey Stone Dr SW, Byron Center, MI 49315
$-1,716
Cash flow
-13.3%
Cash-on-Cash Return
3.1%
Cap rate
0.5%
Rent to Value Ratio
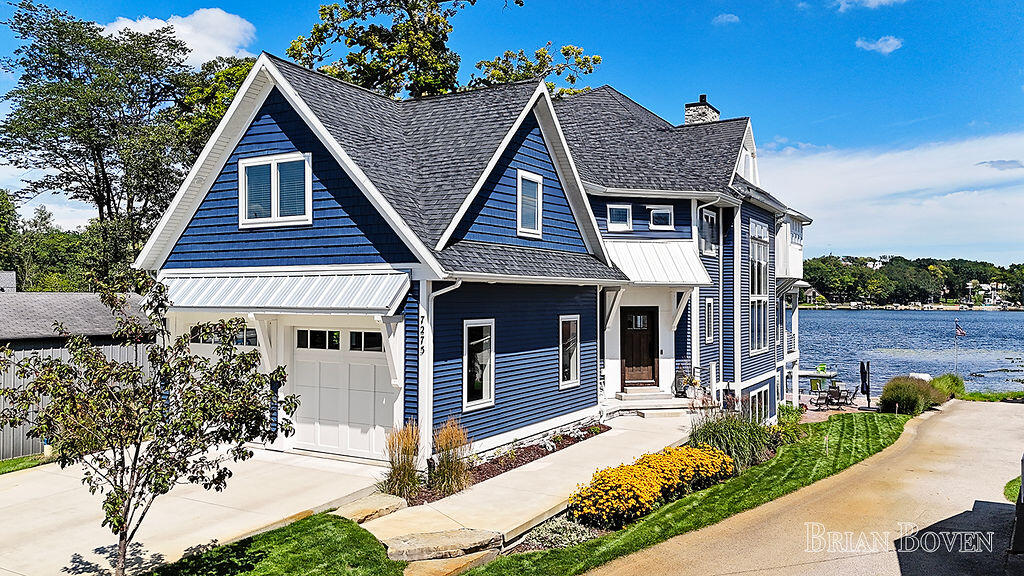
Pending
$1,975,000
5
bds
|
4
ba
|
5,100
sqft
|
built
2018
7275 Peninsula Dr NE, Rockford, MI 49341
$-6,433
Cash flow
-17.0%
Cash-on-Cash Return
2.2%
Cap rate
0.4%
Rent to Value Ratio
Active
$275,000
2
bds
|
1
ba
|
1,017
sqft
|
built
1855
44 Lafayette Ave NE, Grand Rapids, MI 49503
$-330
Cash flow
-6.3%
Cash-on-Cash Return
4.7%
Cap rate
0.8%
Rent to Value Ratio
Active
$325,000
4
bds
|
2
ba
|
1,512
sqft
|
built
1900
359 Atlas Ave SE, Grand Rapids, MI 49506
$-332
Cash flow
-5.3%
Cash-on-Cash Return
4.9%
Cap rate
0.7%
Rent to Value Ratio
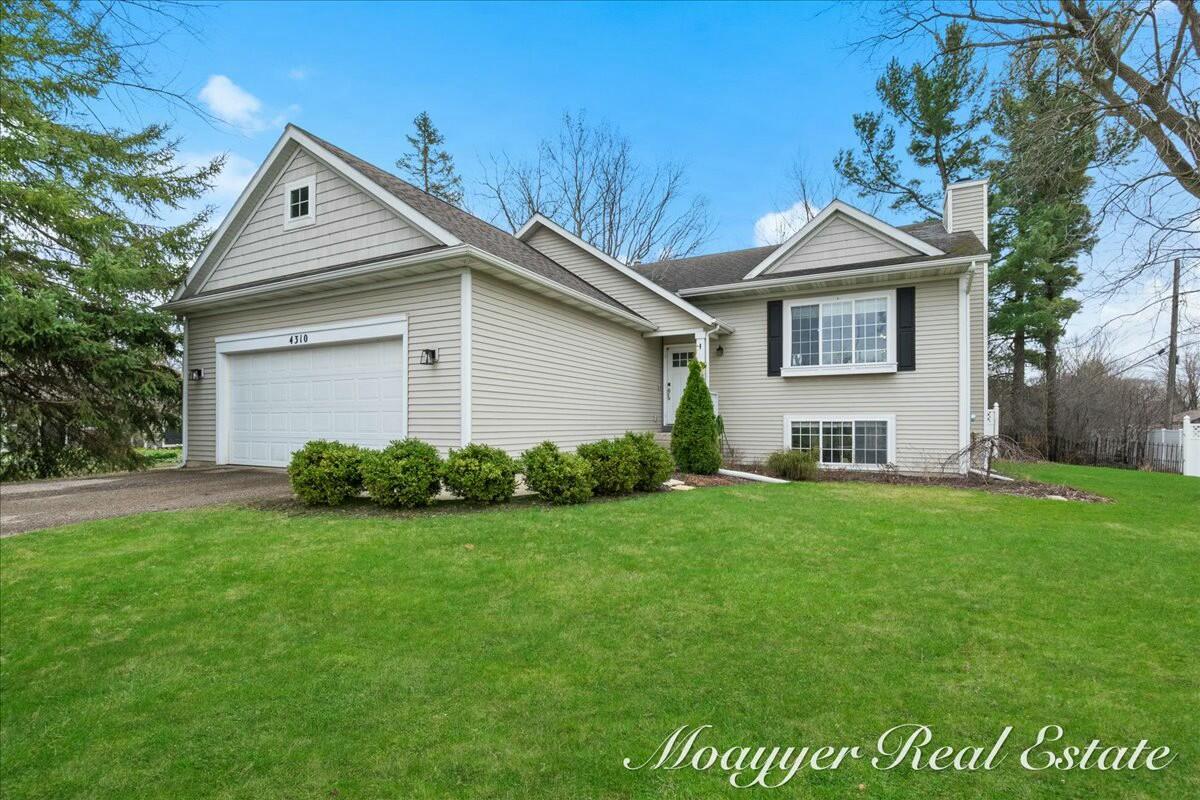
Active
$520,000
5
bds
|
3
ba
|
2,418
sqft
|
built
2002
4310 Heather Ln SE, Grand Rapids, MI 49546
$-1,129
Cash flow
-11.3%
Cash-on-Cash Return
3.5%
Cap rate
0.5%
Rent to Value Ratio
Active
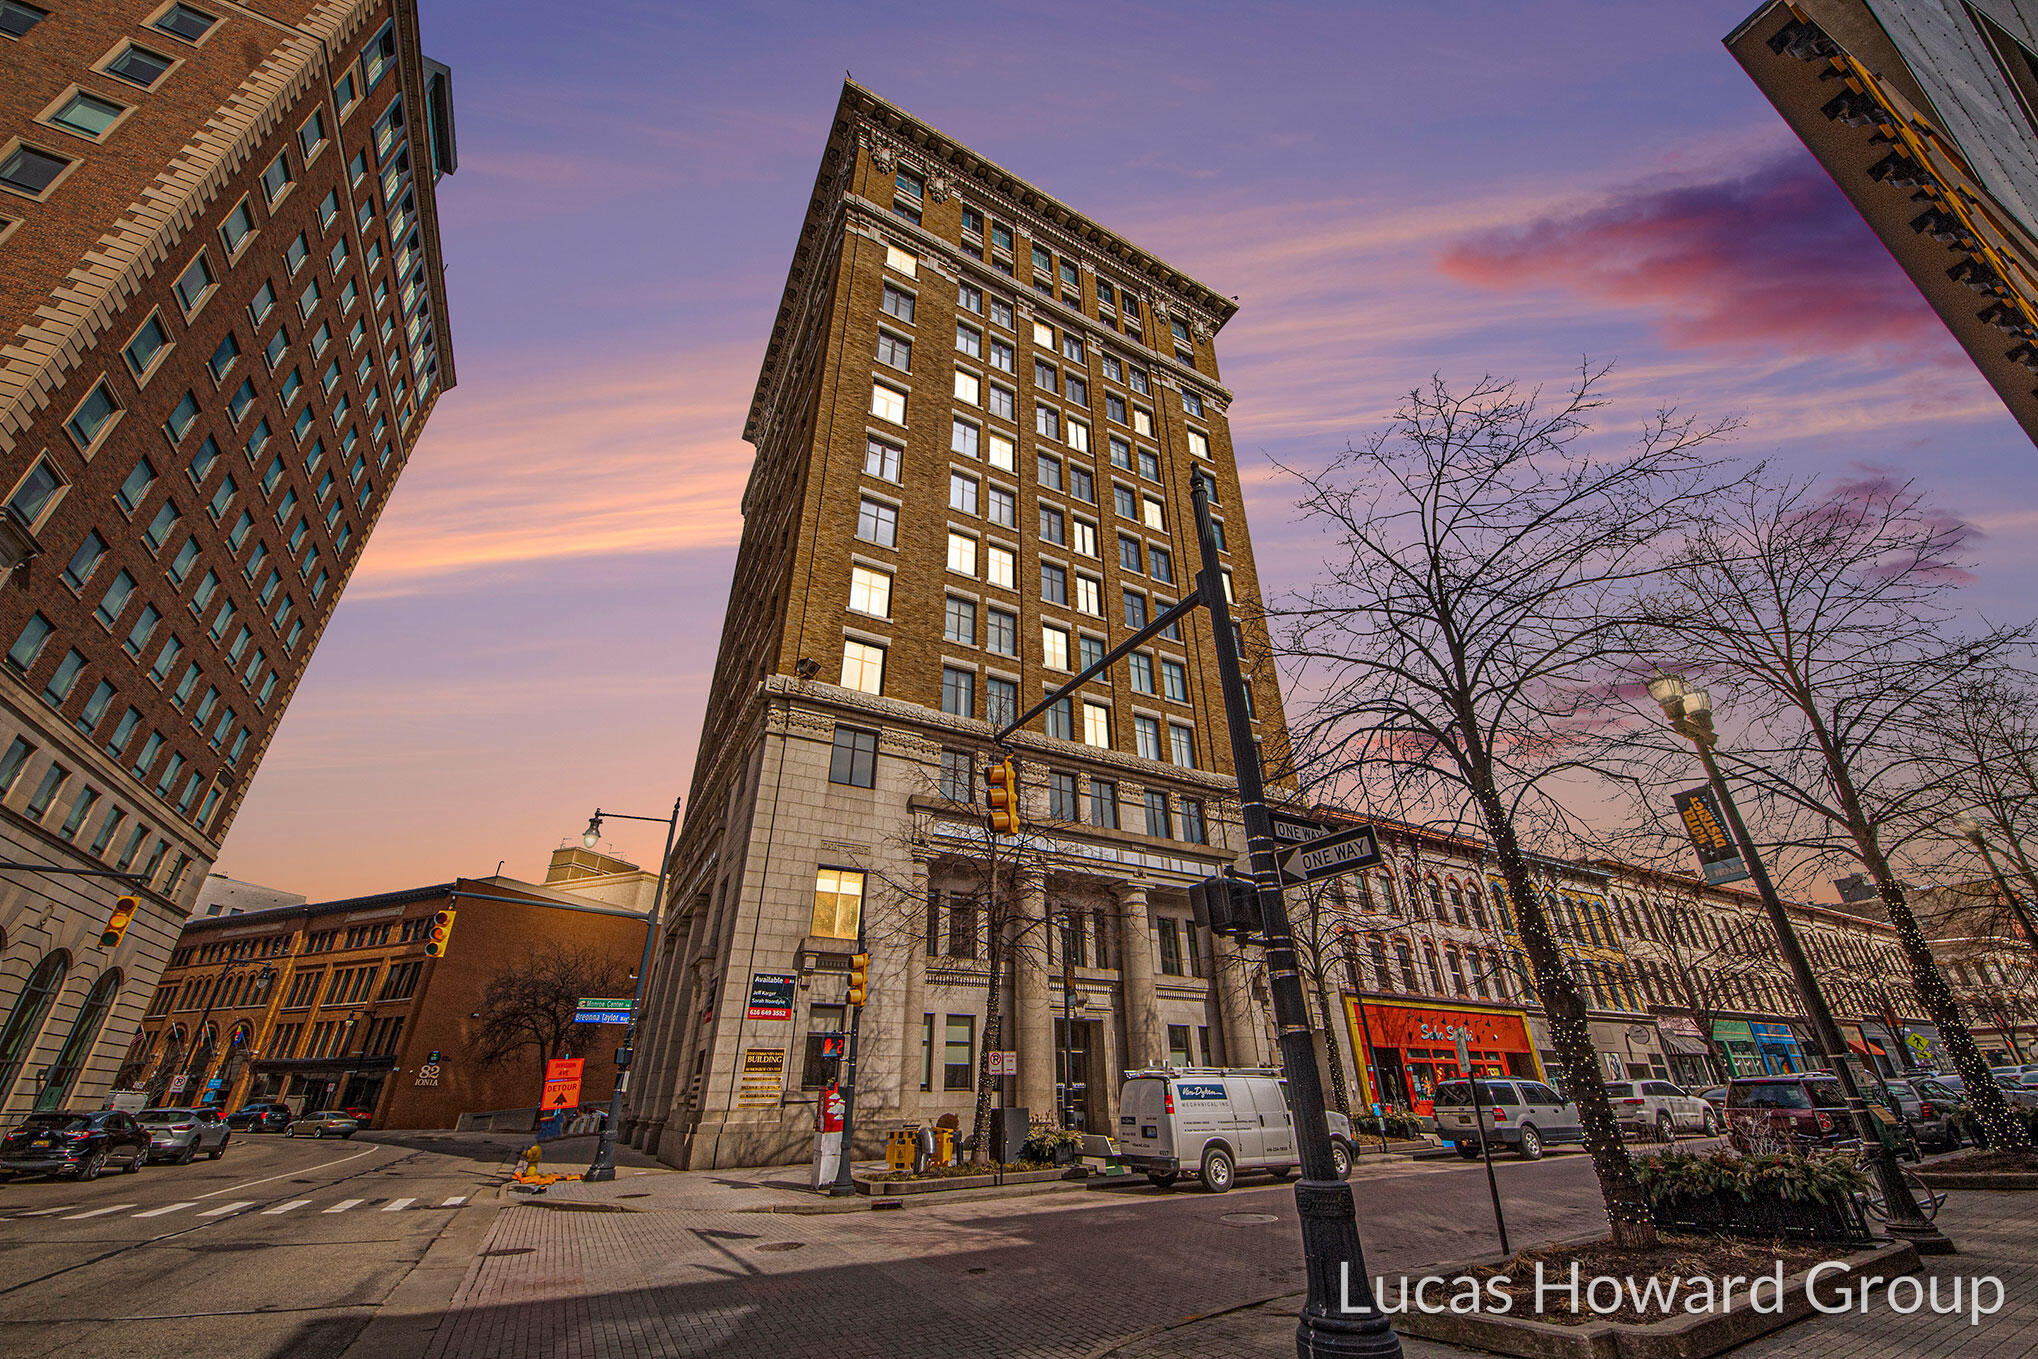
$399,999
2
bds
|
2
ba
|
1,703
sqft
|
built
1915
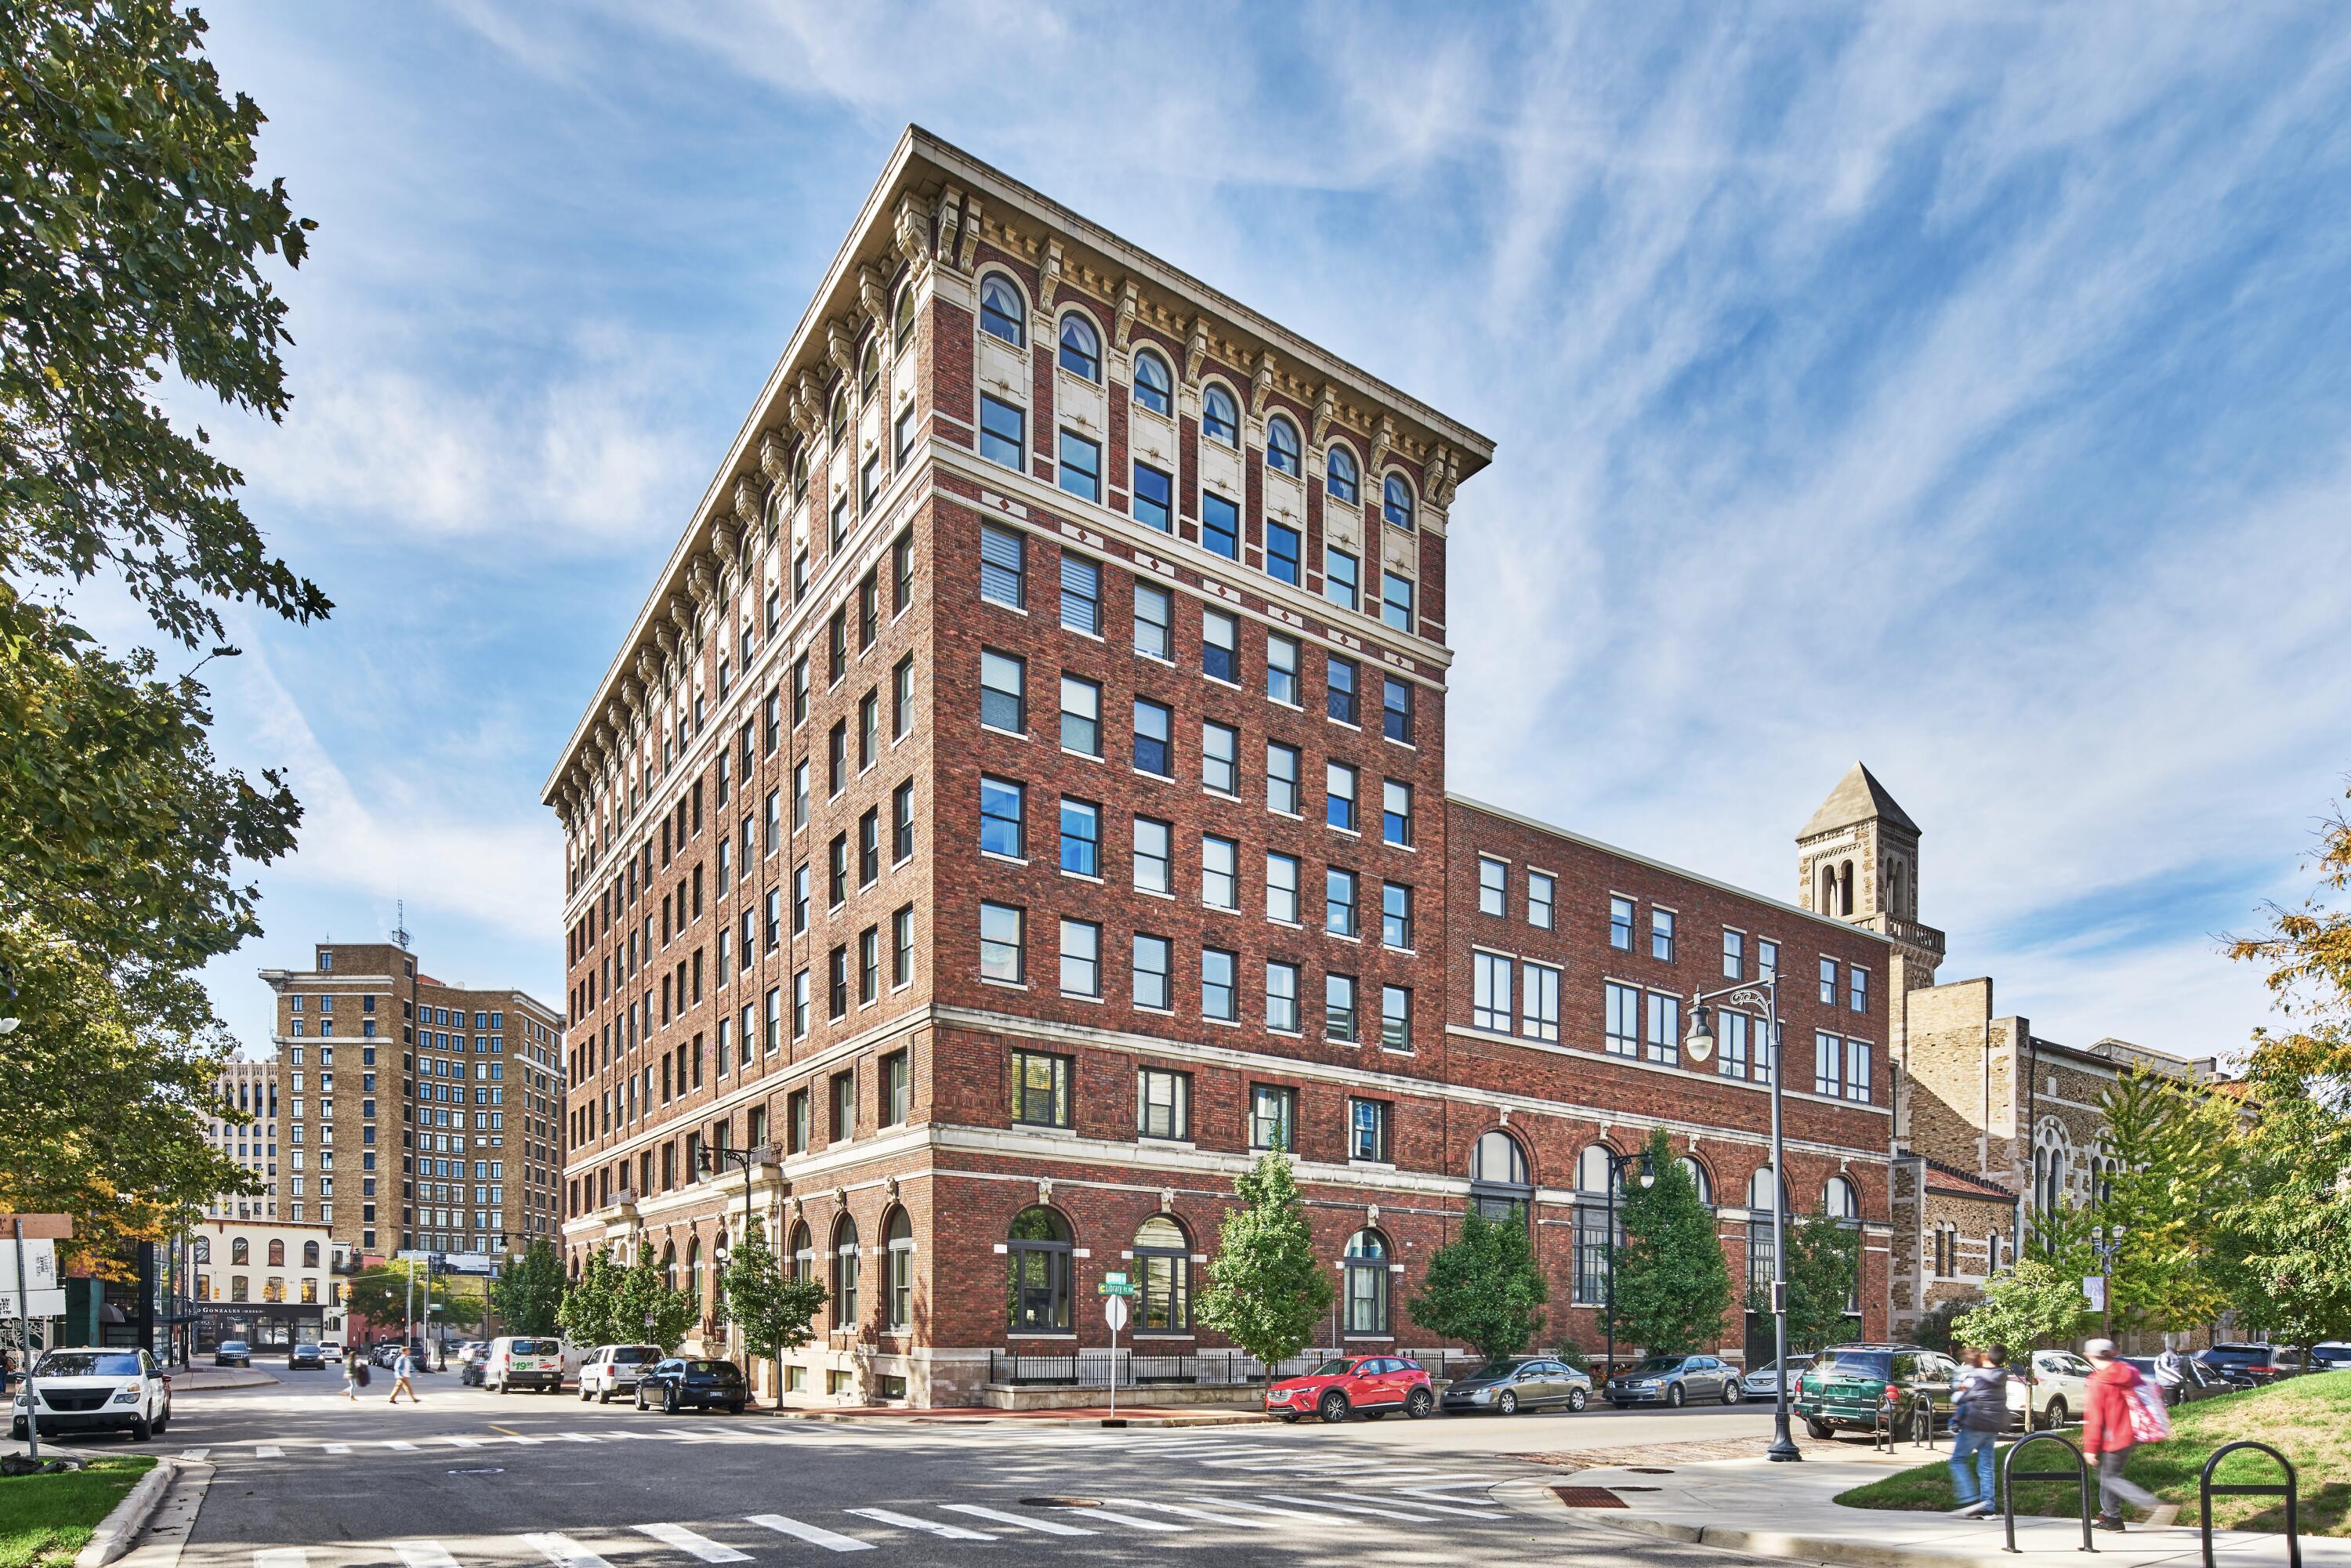
60 Monroe Center St NW, Grand Rapids, MI 49503
$-347
Cash flow
-4.5%
Cash-on-Cash Return
5.1%
Cap rate
1.0%
Rent to Value Ratio
Active
$200,000
3
bds
|
2
ba
|
1,494
sqft
|
built
1925
1230 Prospect Ave SE, Grand Rapids, MI 49507
$0
Cash flow
0.0%
Cash-on-Cash Return
6.1%
Cap rate
0.8%
Rent to Value Ratio
Pending
$365,000
3
bds
|
3
ba
|
2,024
sqft
|
built
2000
1509 Maplehollow St SE, Kentwood, MI 49508
$-608
Cash flow
-8.7%
Cash-on-Cash Return
4.1%
Cap rate
0.7%
Rent to Value Ratio

Active
$479,999
3
bds
|
2
ba
|
1,710
sqft
|
built
1920
2030 19 Mile Rd NE, Cedar Springs, MI 49319
$-916
Cash flow
-10.0%
Cash-on-Cash Return
3.9%
Cap rate
0.5%
Rent to Value Ratio

Active
$825,000
bds
|
0
ba
|
0
sqft
|
built
1893
234 Madison Ave SE, Grand Rapids, MI 49503
$-3,768
Cash flow
-23.8%
Cash-on-Cash Return
0.7%
Cap rate
0.2%
Rent to Value Ratio
Active
$539,000
3
bds
|
3
ba
|
2,410
sqft
|
built
1987
2376 Bob White Ct SE, Grand Rapids, MI 49546
$-1,936
Cash flow
-18.7%
Cash-on-Cash Return
1.8%
Cap rate
0.5%
Rent to Value Ratio

Active
$1,450,000
6
bds
|
4
ba
|
5,864
sqft
|
built
2021
5661 Walnut Run Ct, Caledonia, MI 49316
$-3,012
Cash flow
-10.8%
Cash-on-Cash Return
3.7%
Cap rate
0.4%
Rent to Value Ratio
Active
$450,000
2
bds
|
3
ba
|
2,485
sqft
|
built
2001
1663 Oakleigh Woods Dr NW, Grand Rapids, MI 49504
$-1,206
Cash flow
-14.0%
Cash-on-Cash Return
2.9%
Cap rate
0.7%
Rent to Value Ratio
Active
$1,499,900
3
bds
|
4
ba
|
3,529
sqft
|
built
1915
27 Library St NE, Grand Rapids, MI 49503
$-6,113
Cash flow
-21.3%
Cash-on-Cash Return
1.3%
Cap rate
0.4%
Rent to Value Ratio
Active
$499,900
5
bds
|
4
ba
|
2,996
sqft
|
built
1995
9610 Grange Ave NE, Rockford, MI 49341
$-884
Cash flow
-9.2%
Cash-on-Cash Return
4.0%
Cap rate
0.6%
Rent to Value Ratio
Active
$399,900
4
bds
|
3
ba
|
2,499
sqft
|
built
1973
5281 Queensbury Dr SE, Grand Rapids, MI 49508
$-492
Cash flow
-6.4%
Cash-on-Cash Return
4.7%
Cap rate
0.7%
Rent to Value Ratio
Active
$775,000
3
bds
|
3
ba
|
2,052
sqft
|
built
2014
678 Croswell Ave SE, Grand Rapids, MI 49506
$-3,225
Cash flow
-21.7%
Cash-on-Cash Return
1.2%
Cap rate
0.5%
Rent to Value Ratio
Active
$350,000
3
bds
|
3
ba
|
2,220
sqft
|
built
1962
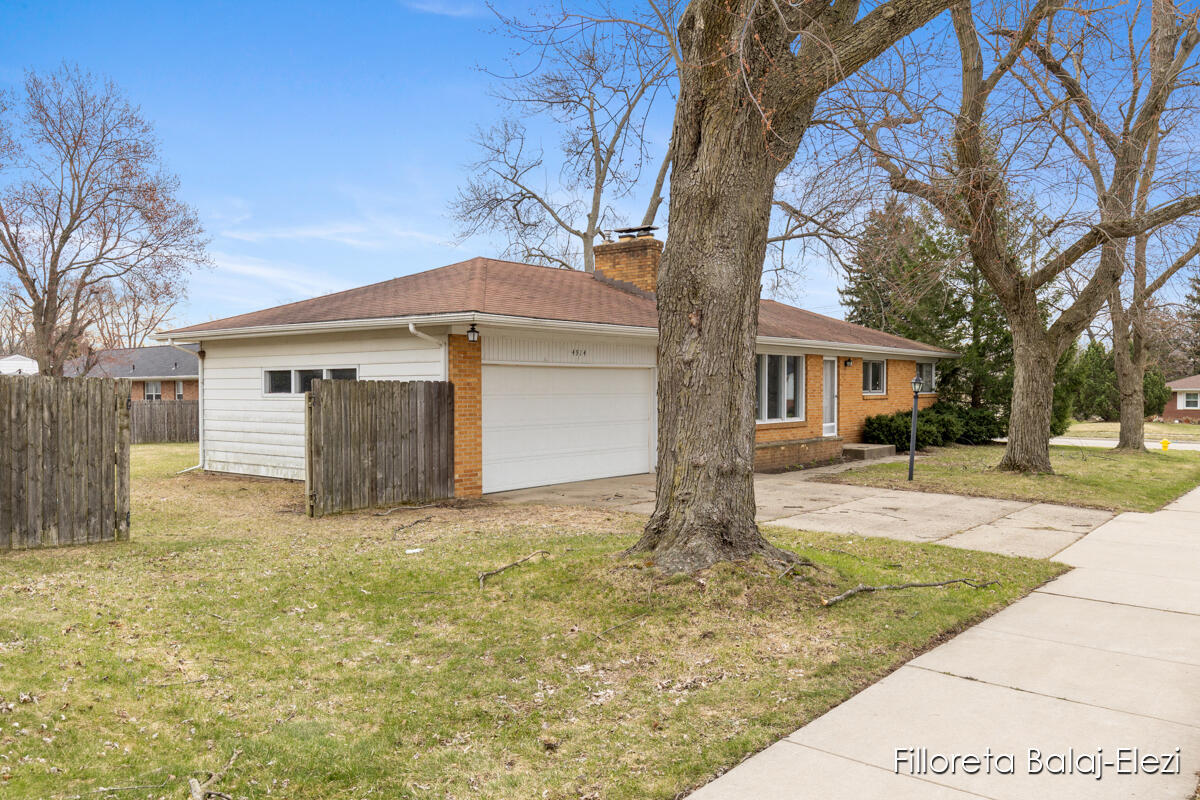
4914 Ash Ave SE, Kentwood, MI 49508
$-645
Cash flow
-9.6%
Cash-on-Cash Return
3.9%
Cap rate
0.6%
Rent to Value Ratio
Active
$289,000
3
bds
|
2
ba
|
1,044
sqft
|
built
1950
2100 Dawson Ave NE, Grand Rapids, MI 49505
$-564
Cash flow
-10.2%
Cash-on-Cash Return
3.8%
Cap rate
0.6%
Rent to Value Ratio
Active
$499,500
3
bds
|
3
ba
|
1,924
sqft
|
built
1900
600 Broadway Ave NW, Grand Rapids, MI 49504
$-2,019
Cash flow
-21.1%
Cash-on-Cash Return
1.3%
Cap rate
0.6%
Rent to Value Ratio
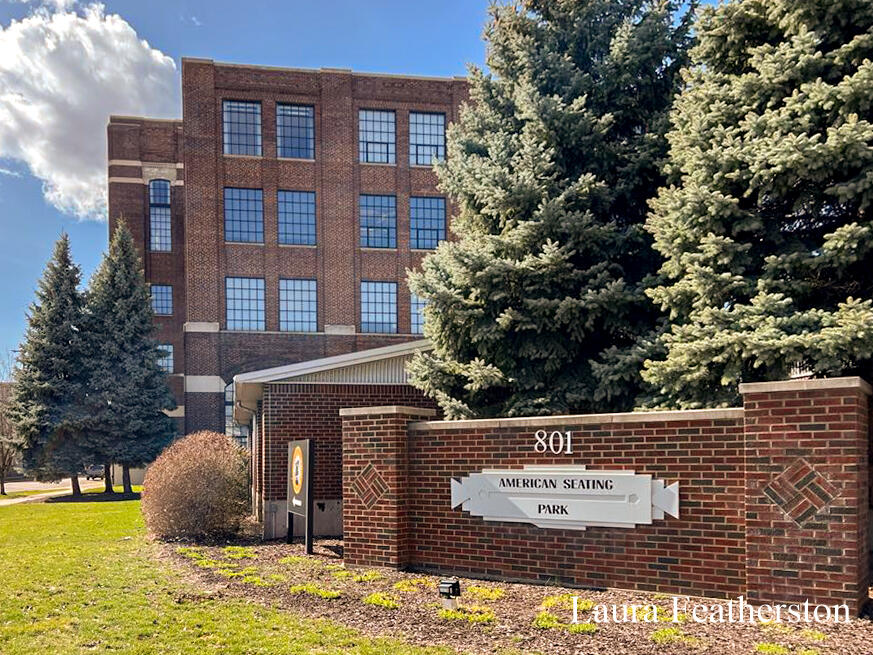
Pending
$375,000
2
bds
|
2
ba
|
1,741
sqft
|
built
2013
801 Broadway Ave NW, Grand Rapids, MI 49504
$-1,155
Cash flow
-16.1%
Cash-on-Cash Return
2.5%
Cap rate
0.7%
Rent to Value Ratio

Active
$650,000
6
bds
|
5
ba
|
3,791
sqft
|
built
2022
2905 Woodside Ave SE, Grand Rapids, MI 49508
$-2,230
Cash flow
-17.9%
Cash-on-Cash Return
2.0%
Cap rate
0.4%
Rent to Value Ratio
Active
$290,000
bds
|
0
ba
|
0
sqft
|
built
1915
855 Adams St SE, Grand Rapids, MI 49507
$-397
Cash flow
-7.1%
Cash-on-Cash Return
4.5%
Cap rate
0.6%
Rent to Value Ratio
Active
$205,900
2
bds
|
1
ba
|
852
sqft
|
built
1920
6773 Kitson Dr NE, Rockford, MI 49341
$108
Cash flow
2.7%
Cash-on-Cash Return
6.8%
Cap rate
0.9%
Rent to Value Ratio
Active
$782,500
5
bds
|
4
ba
|
3,043
sqft
|
built
2015
3269 Hopewell Ct NE, Rockford, MI 49341
$-2,926
Cash flow
-19.5%
Cash-on-Cash Return
1.7%
Cap rate
0.3%
Rent to Value Ratio

Active
$789,000
3
bds
|
3
ba
|
1,719
sqft
|
built
2019
631 Fairview Ave NE, Grand Rapids, MI 49503
$-3,264
Cash flow
-21.6%
Cash-on-Cash Return
1.2%
Cap rate
0.4%
Rent to Value Ratio
Active
$230,000
bds
|
0
ba
|
0
sqft
|
built
1950
1714 Eastern Ave SE, Grand Rapids, MI 49507
$-117
Cash flow
-2.7%
Cash-on-Cash Return
5.5%
Cap rate
0.8%
Rent to Value Ratio
Active
$450,000
4
bds
|
3
ba
|
2,065
sqft
|
built
1974
8945 Vergennes St SE, Ada, MI 49301
$-925
Cash flow
-10.7%
Cash-on-Cash Return
3.7%
Cap rate
0.4%
Rent to Value Ratio
Active
$333,500
4
bds
|
2
ba
|
1,850
sqft
|
built
1946
2328 Monroe Ave NE, Grand Rapids, MI 49505
$-262
Cash flow
-4.1%
Cash-on-Cash Return
5.2%
Cap rate
0.7%
Rent to Value Ratio
Active
$549,900
2
bds
|
2
ba
|
1,145
sqft
|
built
1921
201 Michigan St NW, Grand Rapids, MI 49503
$-1,483
Cash flow
-14.1%
Cash-on-Cash Return
2.9%
Cap rate
0.6%
Rent to Value Ratio

Active
$1,900,000
4
bds
|
4
ba
|
4,320
sqft
|
built
2017
9924 Summit Ave NE, Rockford, MI 49341
$-9,514
Cash flow
-26.1%
Cash-on-Cash Return
0.1%
Cap rate
0.1%
Rent to Value Ratio
Active
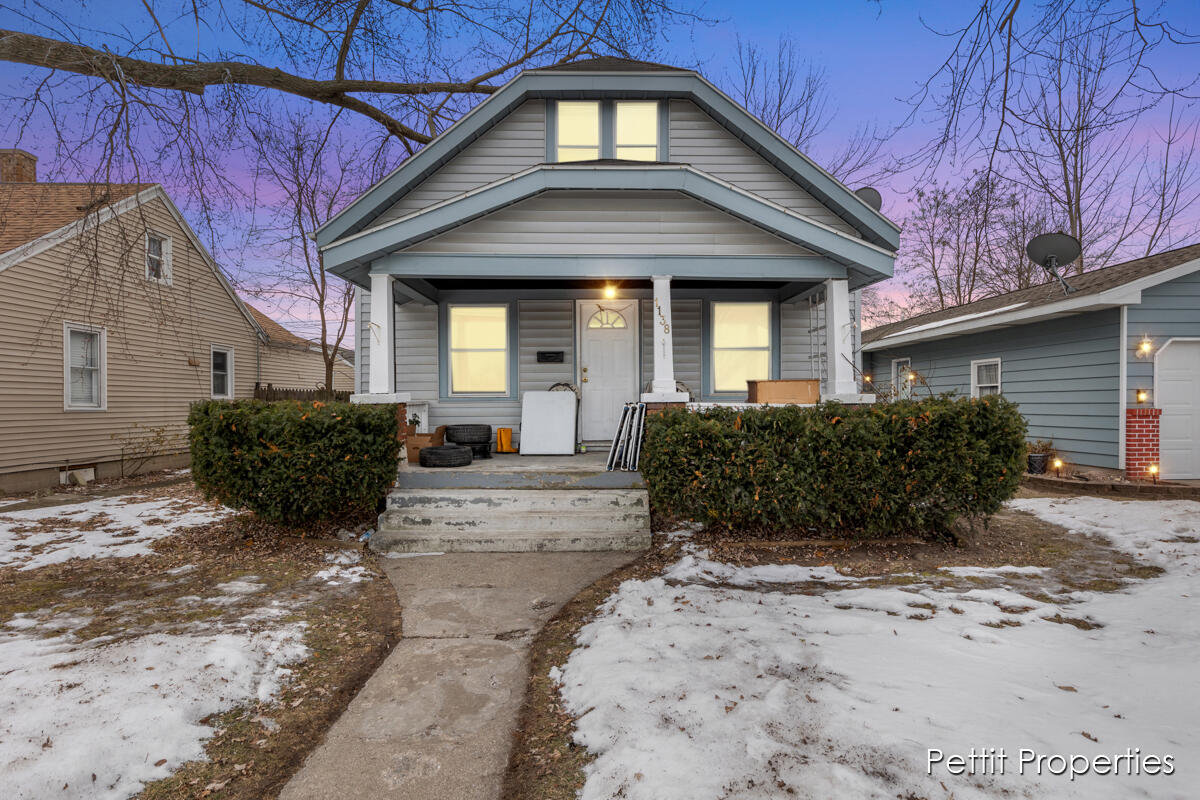
$250,000
3
bds
|
2
ba
|
1,375
sqft
|
built
1929
1138 Whiting St SW, Grand Rapids, MI 49509
$-64
Cash flow
-1.3%
Cash-on-Cash Return
5.8%
Cap rate
0.8%
Rent to Value Ratio
Active
$209,000
bds
|
0
ba
|
0
sqft
|
built
1900
224 Burton St SW, Grand Rapids, MI 49507
$-37
Cash flow
-0.9%
Cash-on-Cash Return
5.9%
Cap rate
0.9%
Rent to Value Ratio
Active
$539,900
2
bds
|
2
ba
|
1,474
sqft
|
built
1990
32 Campau Cir NW, Grand Rapids, MI 49503
$-2,244
Cash flow
-21.7%
Cash-on-Cash Return
1.2%
Cap rate
0.6%
Rent to Value Ratio