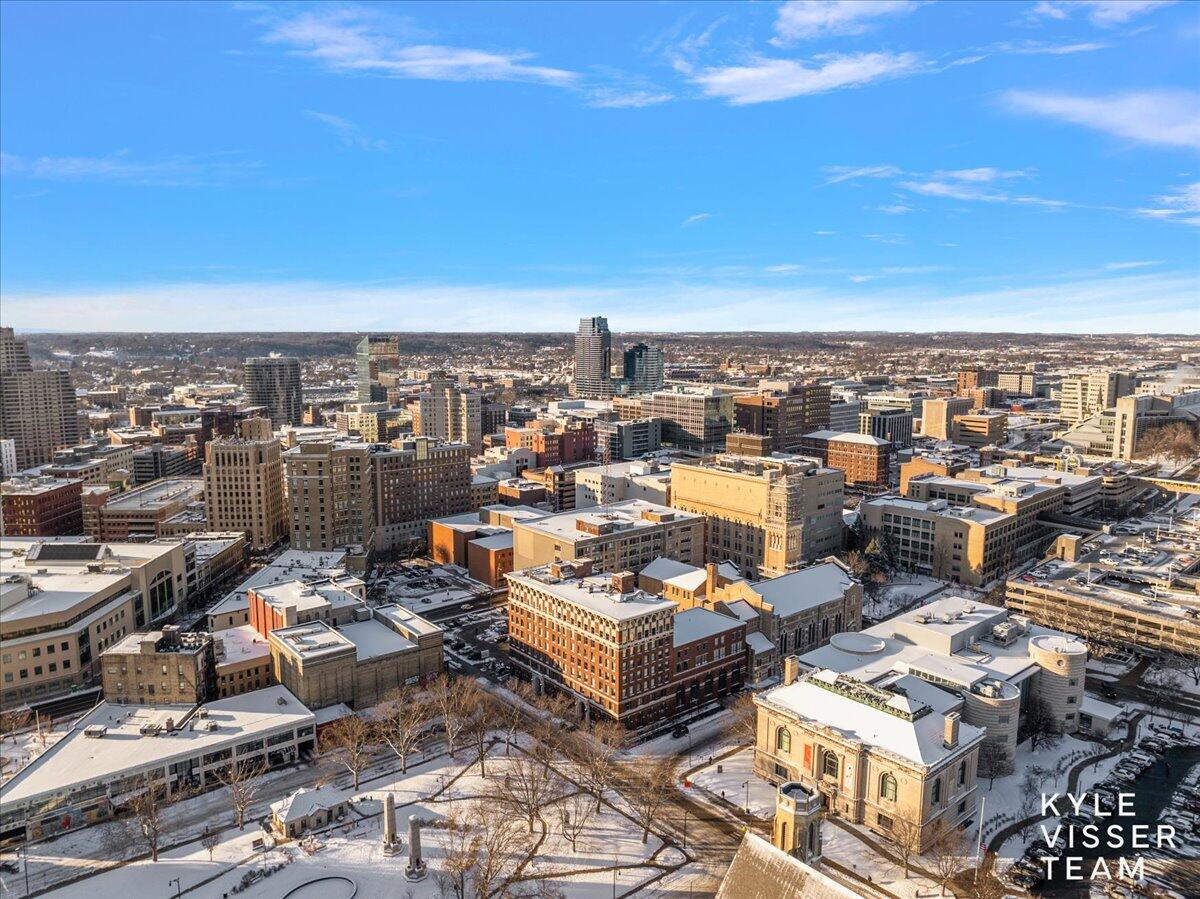
Kent County Investment Properties for Sale
Browse homes for sale and investment properties in Kent County. Refine your search by price, property type, or more.
Best cash flowing properties in Kent County
Active
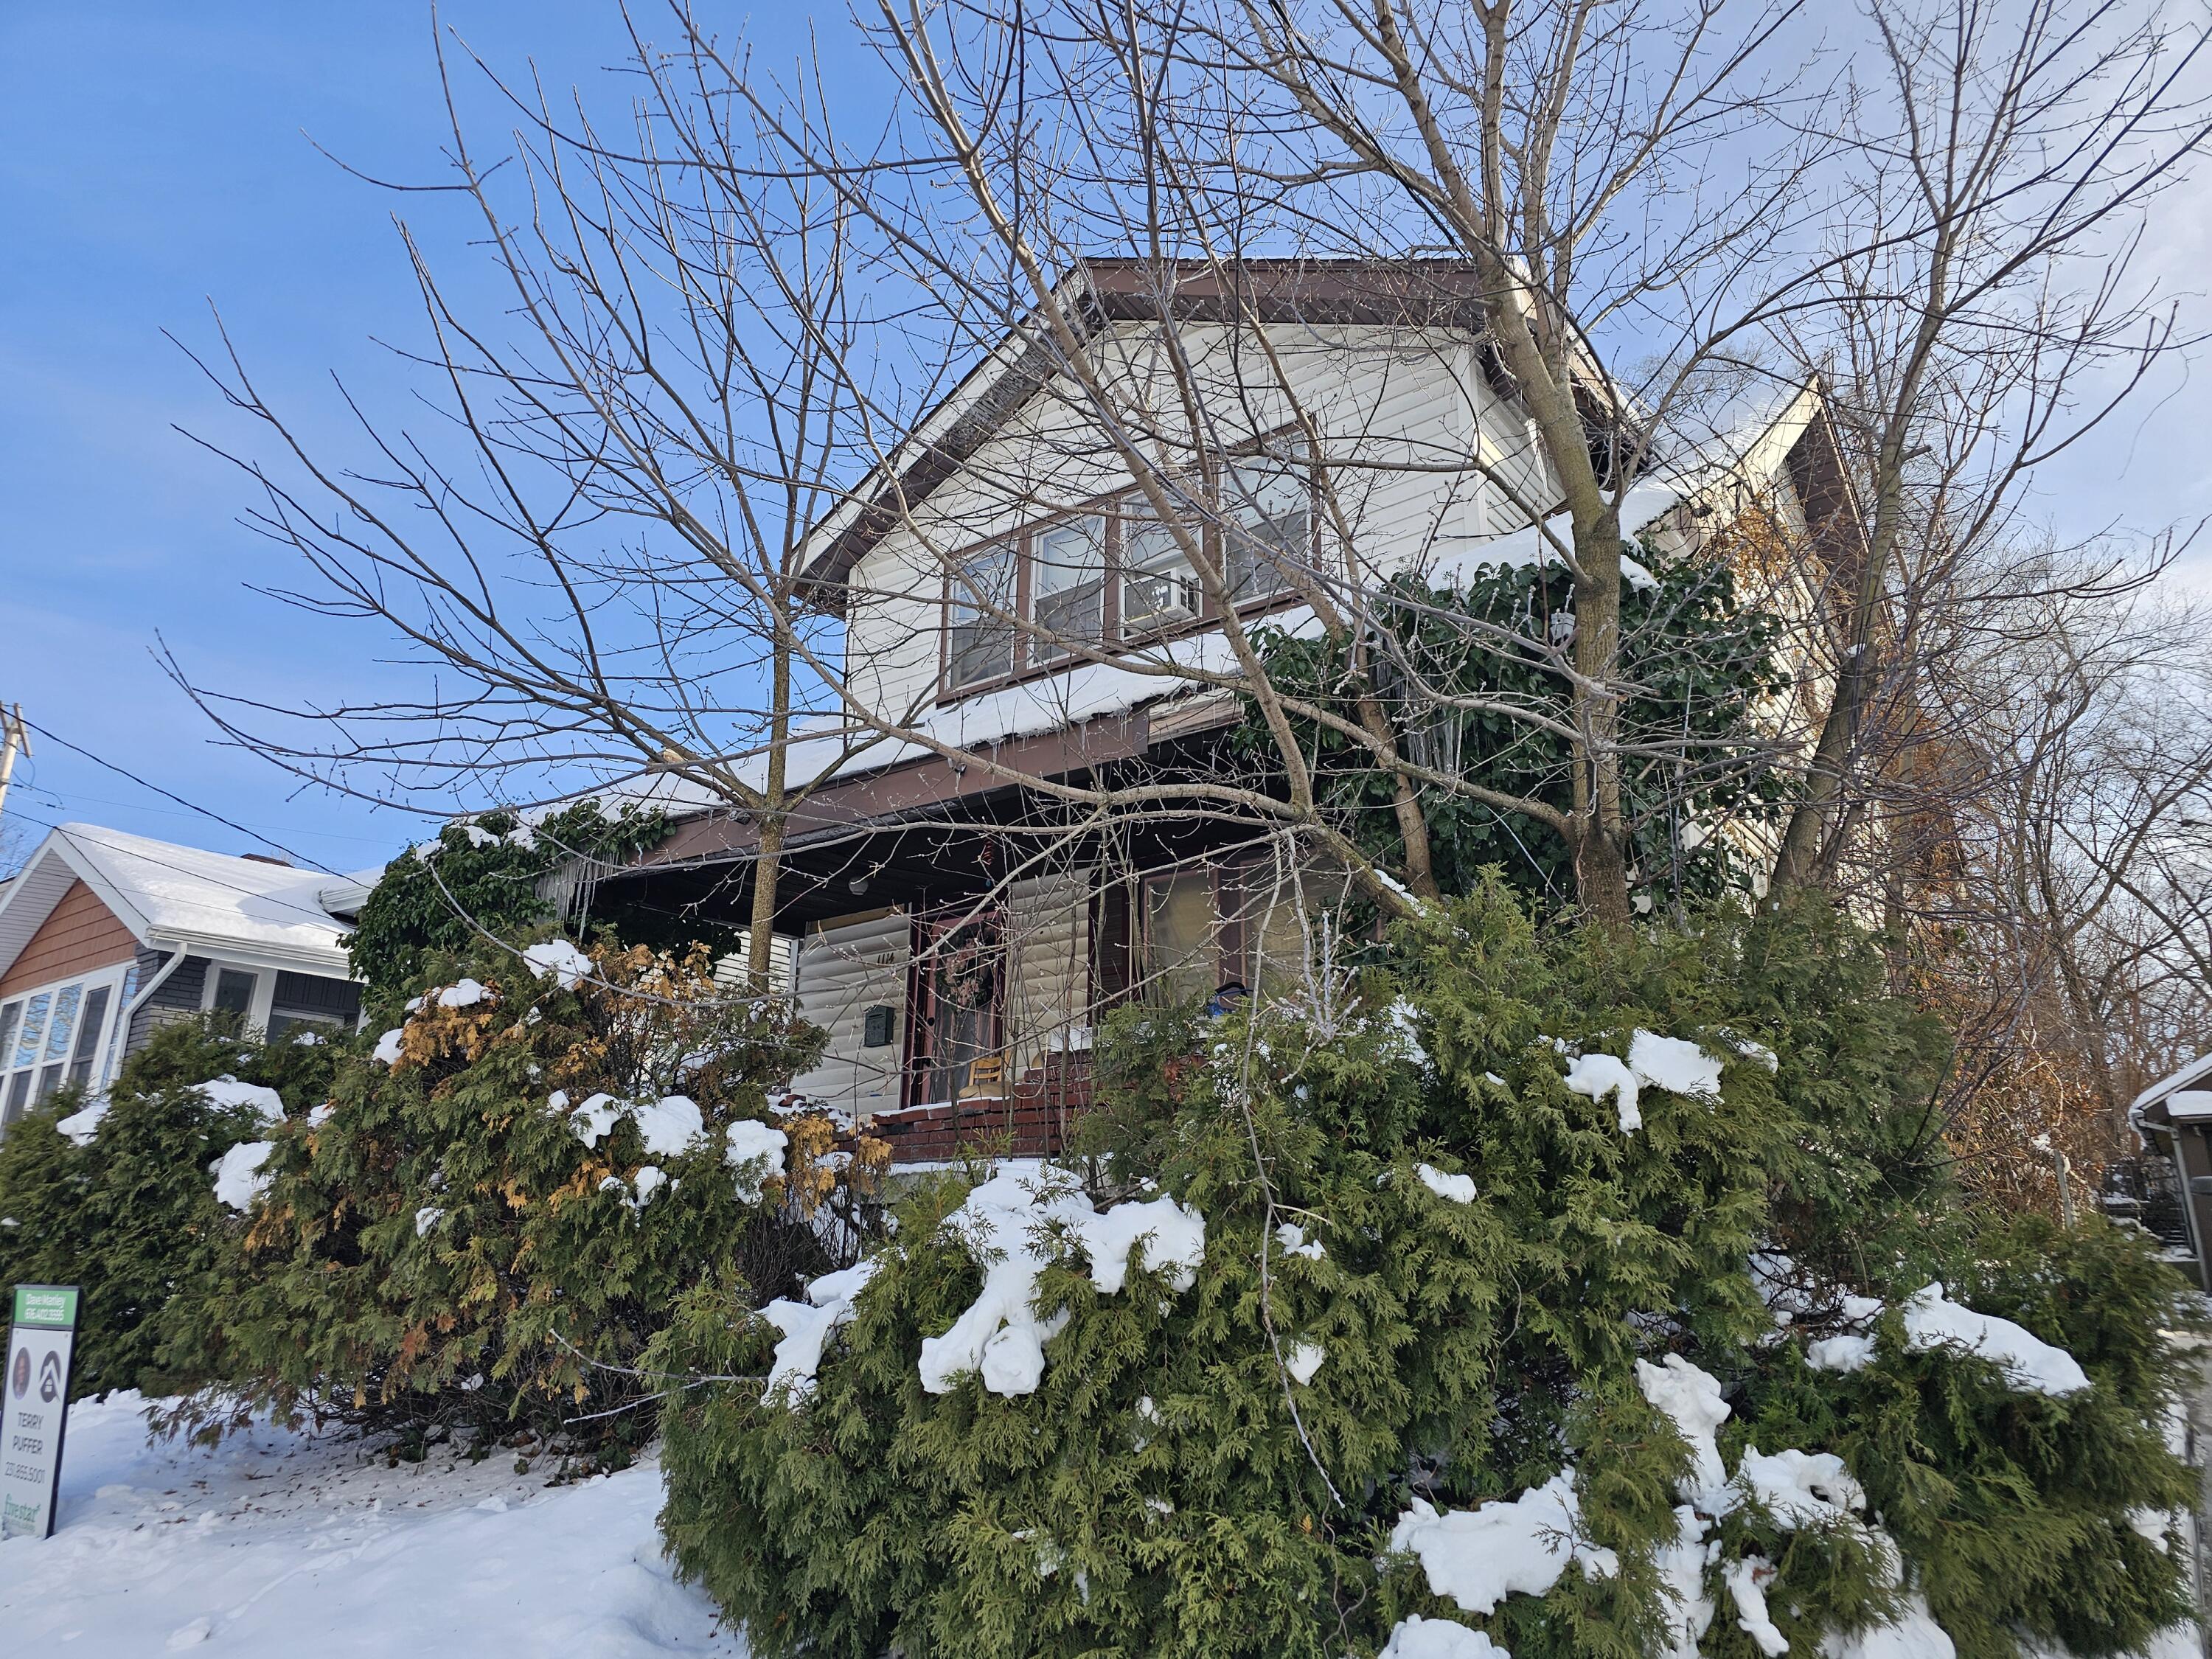
$159,999
4
bds
|
3
ba
|
2,744
sqft
|
built
1925
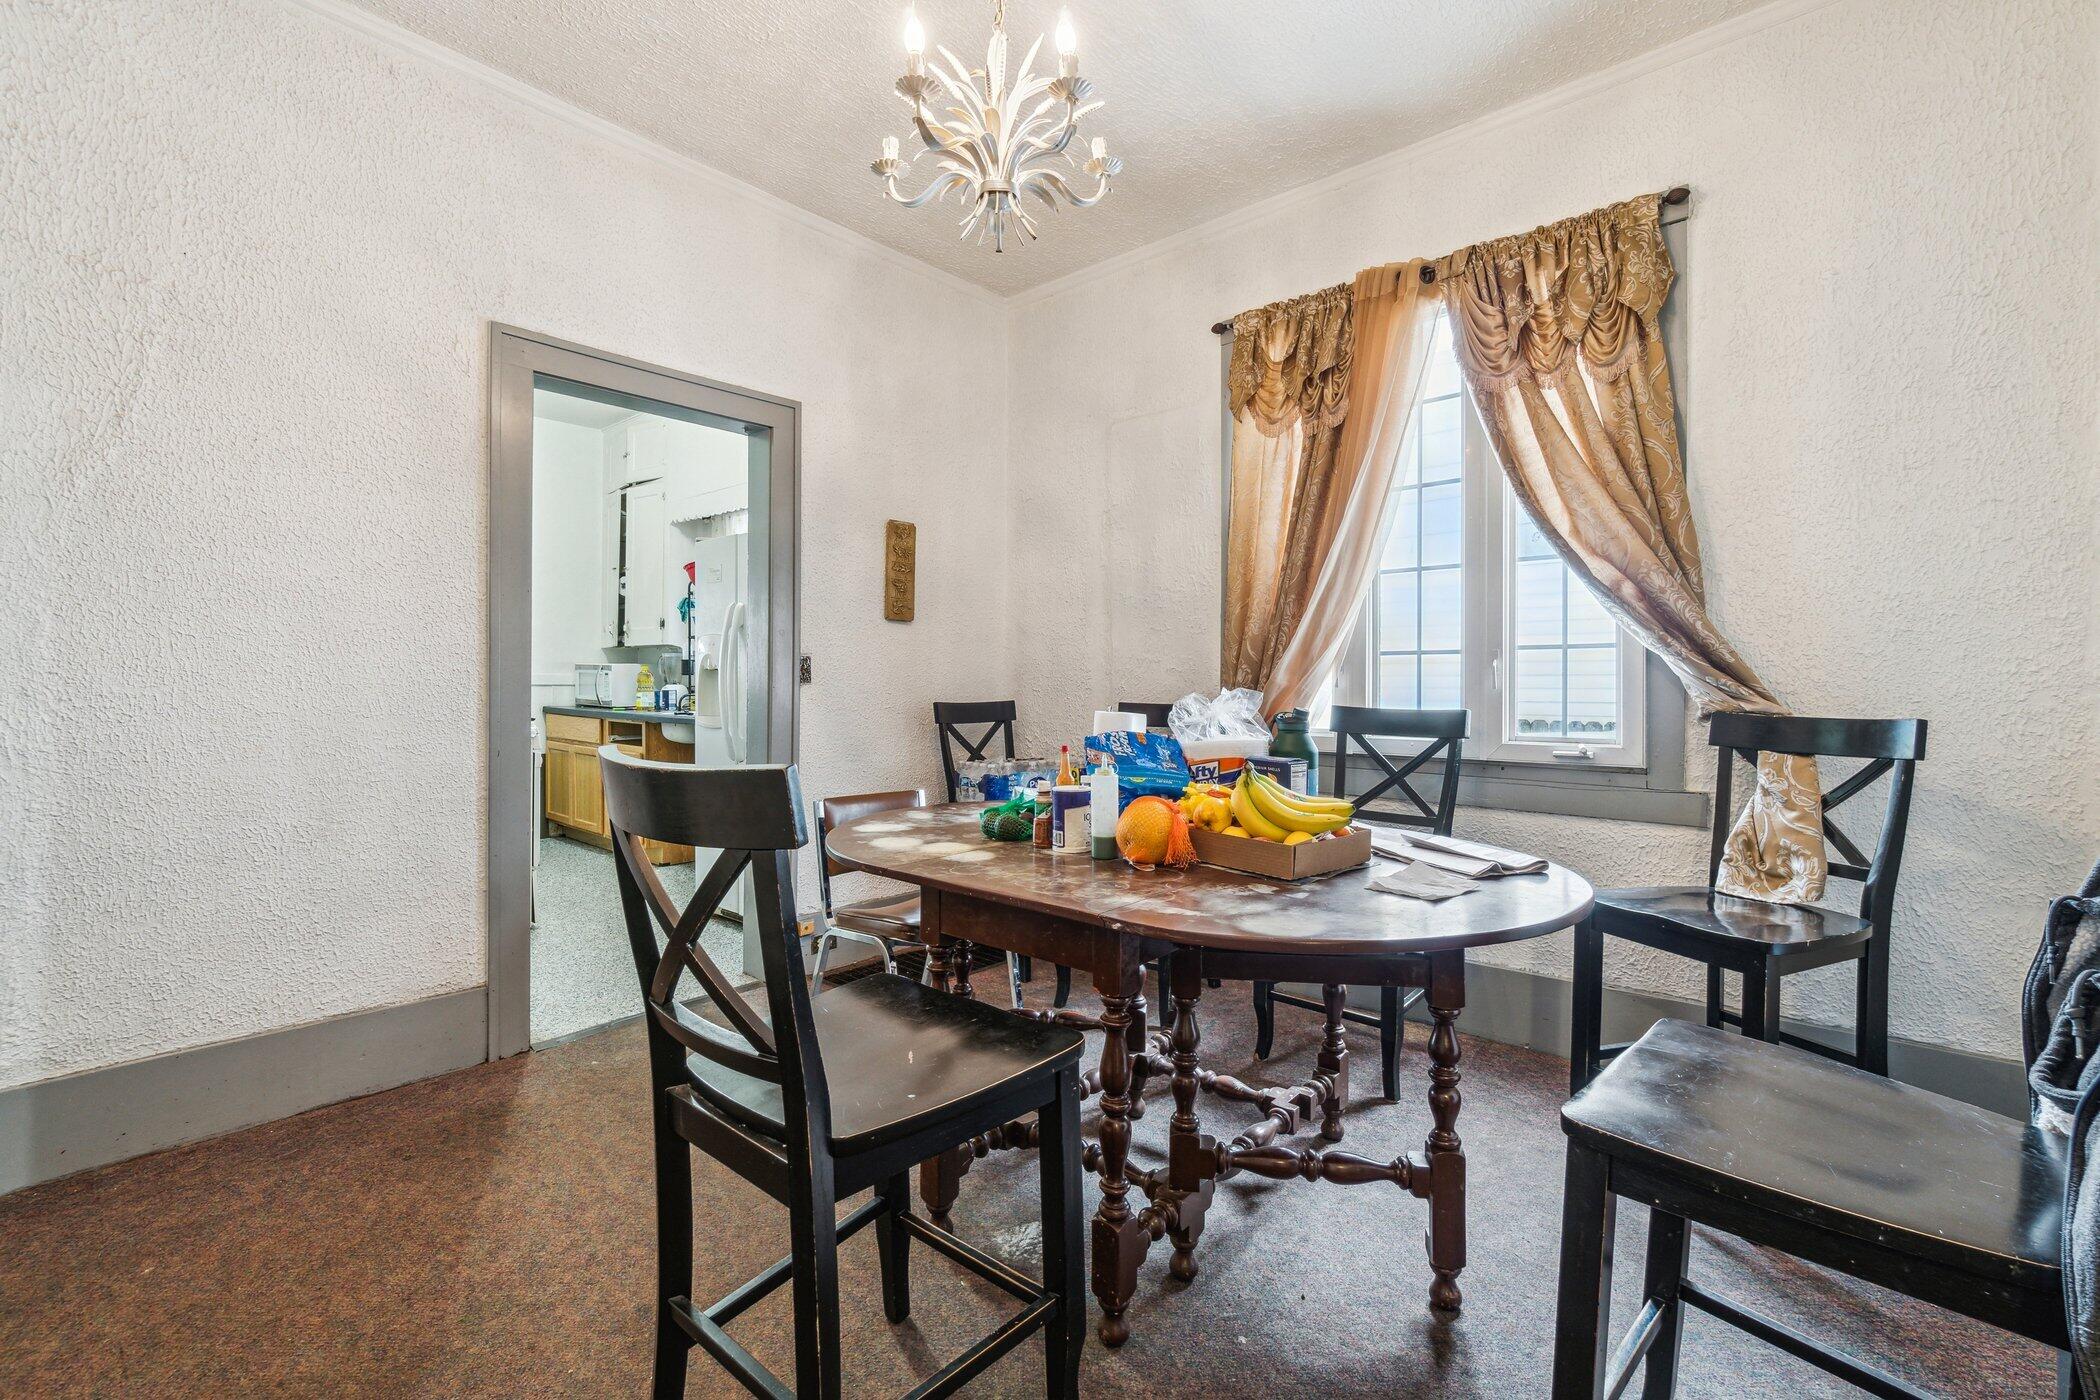
1114 Hall St SE, Grand Rapids, MI 49507
$333
Cash flow
10.9%
Cash-on-Cash Return
8.6%
Cap rate
1.1%
Rent to Value Ratio
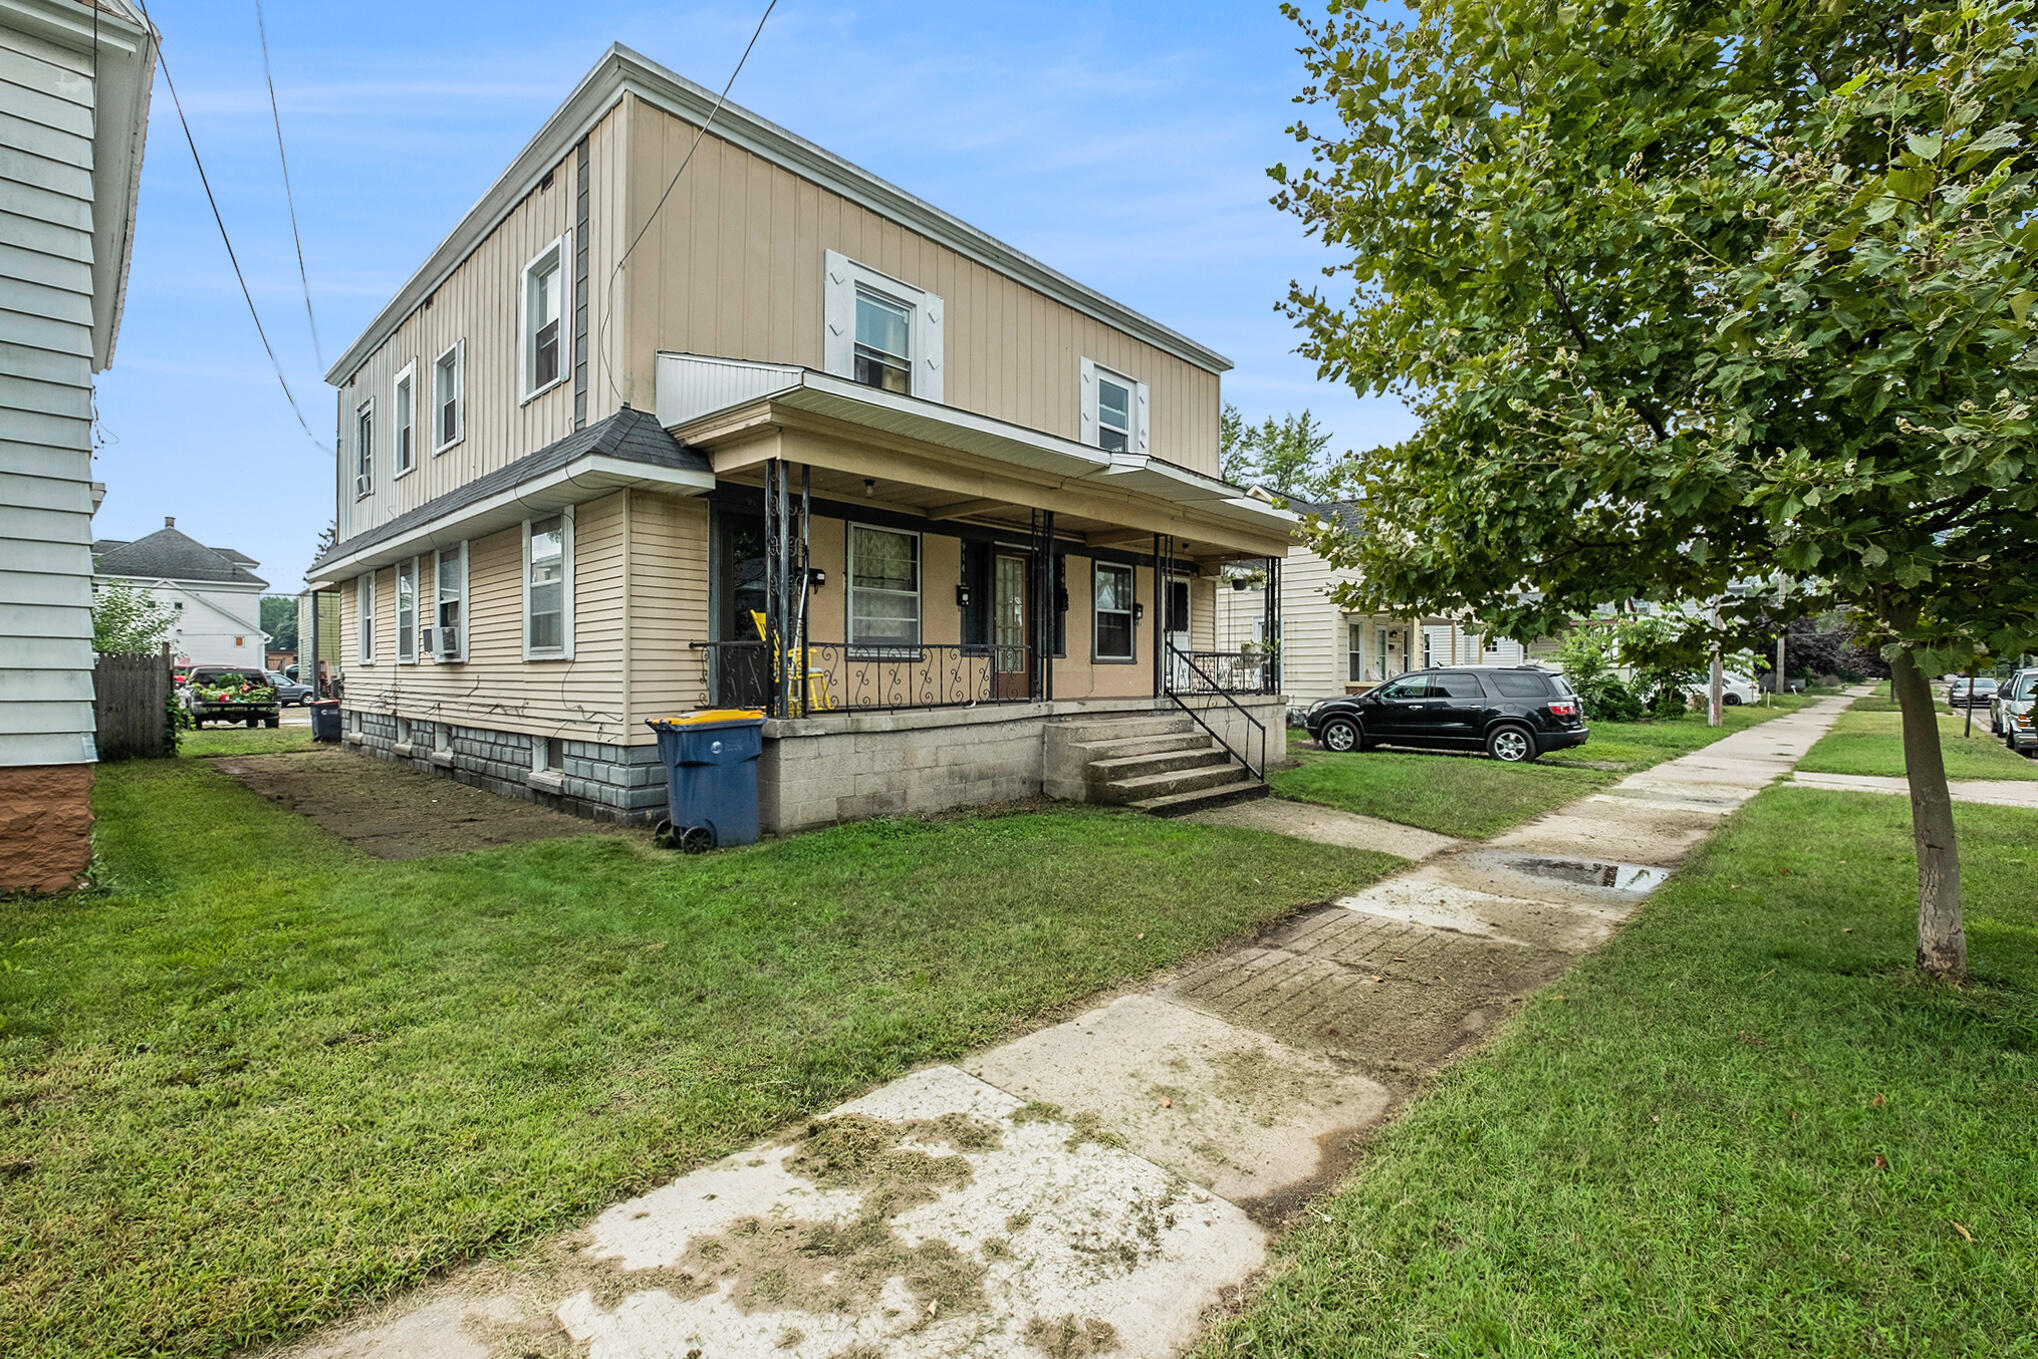
Active
$210,000
3
bds
|
1
ba
|
1,116
sqft
|
built
1925
1632 Kalamazoo Ave SE, Grand Rapids, MI 49507
$-2
Cash flow
0.0%
Cash-on-Cash Return
6.1%
Cap rate
1.0%
Rent to Value Ratio
479 out of 649 properties for sale in Kent County
Limited Results Shown
Create a free account, or log in to reveal all property listings and enjoy the complete experience.
Active
$250,000
3
bds
|
2
ba
|
1,375
sqft
|
built
1929
1138 Whiting St SW, Grand Rapids, MI 49509
$-64
Cash flow
-1.3%
Cash-on-Cash Return
5.8%
Cap rate
0.8%
Rent to Value Ratio
Active
$209,000
bds
|
0
ba
|
0
sqft
|
built
1900
224 Burton St SW, Grand Rapids, MI 49507
$-37
Cash flow
-0.9%
Cash-on-Cash Return
5.9%
Cap rate
0.9%
Rent to Value Ratio
Active
$539,900
2
bds
|
2
ba
|
1,474
sqft
|
built
1990
32 Campau Cir NW, Grand Rapids, MI 49503
$-2,244
Cash flow
-21.7%
Cash-on-Cash Return
1.2%
Cap rate
0.6%
Rent to Value Ratio
Active
$265,900
5
bds
|
2
ba
|
1,824
sqft
|
built
1920
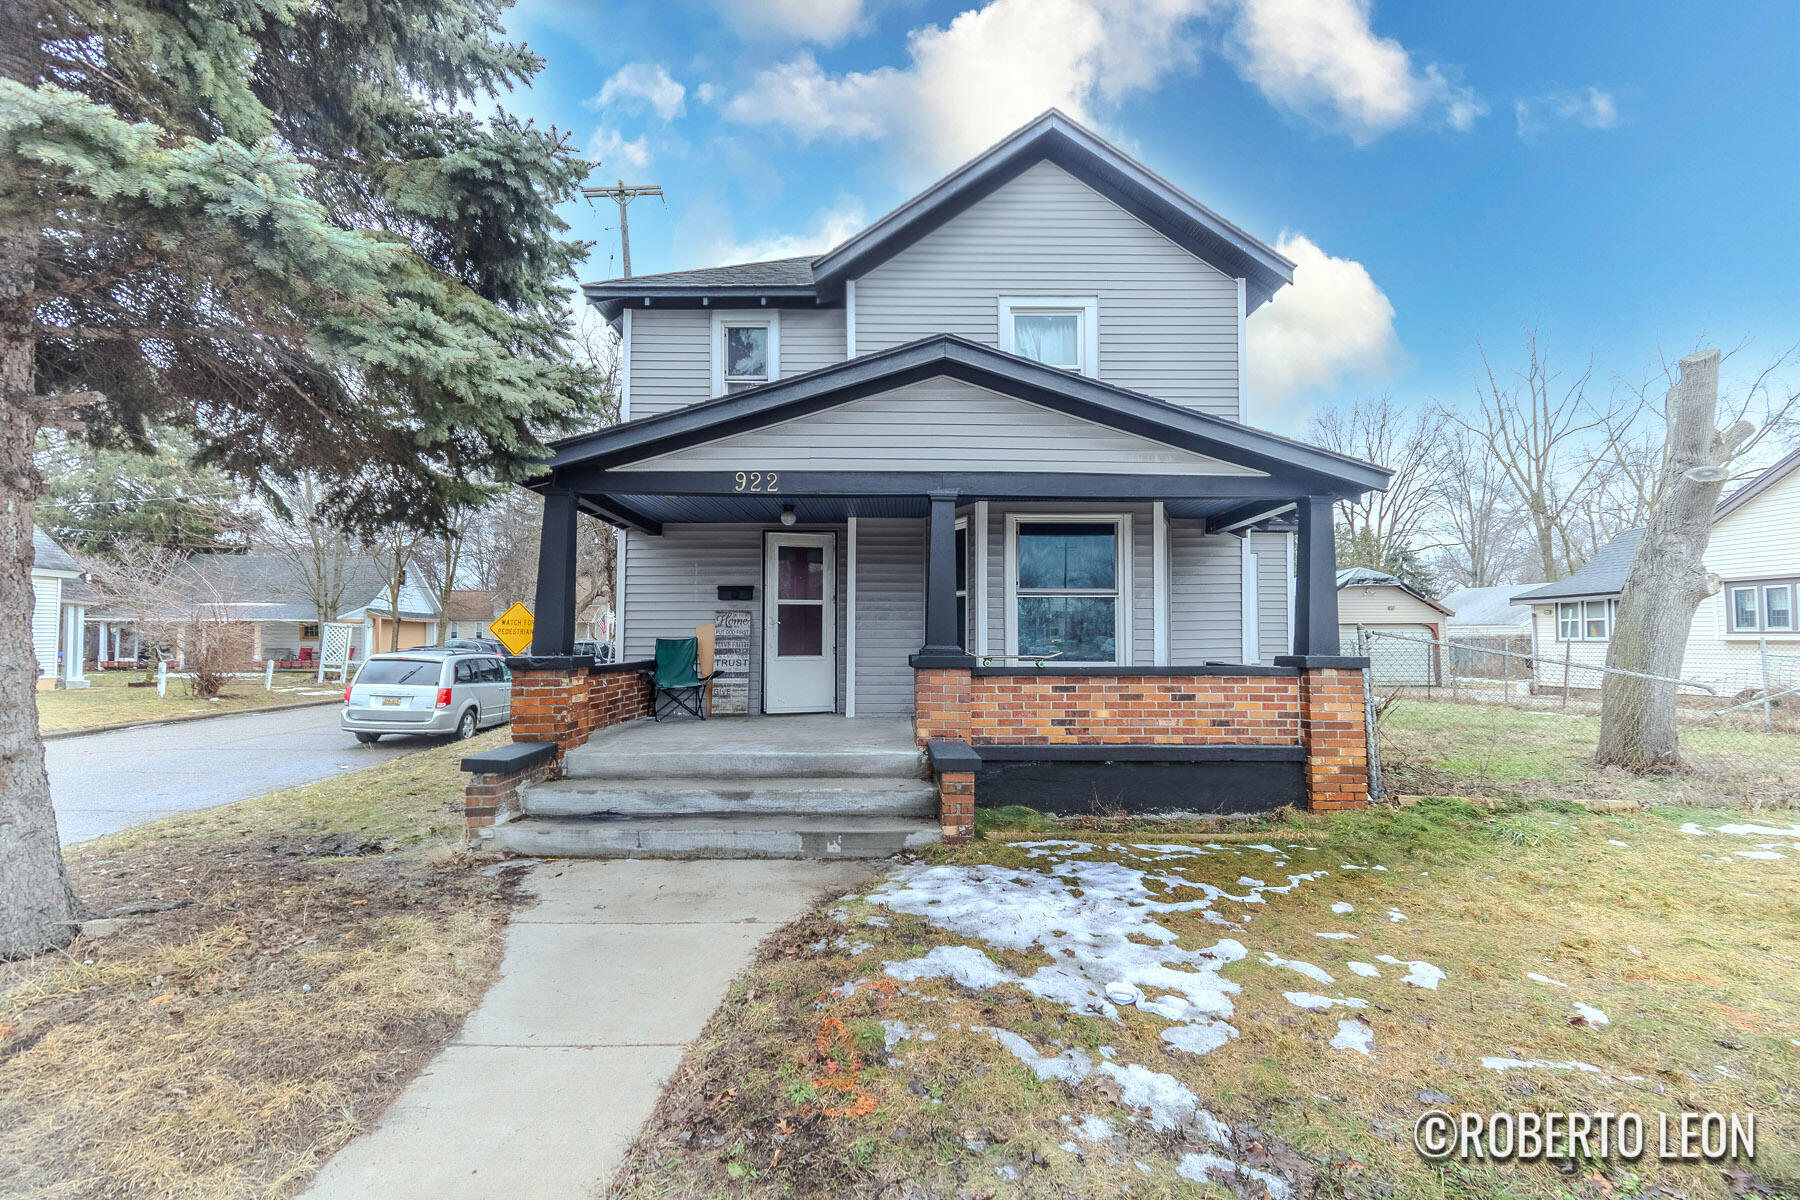
922 Burton St SW, Wyoming, MI 49509
$-643
Cash flow
-12.6%
Cash-on-Cash Return
3.2%
Cap rate
0.7%
Rent to Value Ratio
Active
$1,280,000
3
bds
|
2
ba
|
2,596
sqft
|
built
2007
335 Bridge St NW, Grand Rapids, MI 49504
$-5,991
Cash flow
-24.4%
Cash-on-Cash Return
0.5%
Cap rate
0.4%
Rent to Value Ratio

Active
$1,790,000
4
bds
|
5
ba
|
5,218
sqft
|
built
1998
6862 Maplecrest Dr SE, Grand Rapids, MI 49546
$-7,447
Cash flow
-21.7%
Cash-on-Cash Return
1.2%
Cap rate
0.3%
Rent to Value Ratio
Active
$249,900
1
bds
|
1
ba
|
750
sqft
|
built
1900
600 Broadway Ave NW, Grand Rapids, MI 49504
$-635
Cash flow
-13.3%
Cash-on-Cash Return
3.1%
Cap rate
0.8%
Rent to Value Ratio
Active
$210,000
4
bds
|
1
ba
|
1,289
sqft
|
built
1930
1217 Seneca St SW, Wyoming, MI 49509
$-48
Cash flow
-1.2%
Cash-on-Cash Return
5.9%
Cap rate
0.9%
Rent to Value Ratio
Active
$344,900
4
bds
|
3
ba
|
2,017
sqft
|
built
1958
5480 Cheryl Ave SE, Kentwood, MI 49508
$-485
Cash flow
-7.3%
Cash-on-Cash Return
4.5%
Cap rate
0.6%
Rent to Value Ratio
Active
$1,500,000
5
bds
|
5
ba
|
8,732
sqft
|
built
1994
7507 Red Osier Dr SW, Byron Center, MI 49315
$-5,717
Cash flow
-19.9%
Cash-on-Cash Return
1.6%
Cap rate
0.3%
Rent to Value Ratio
Active
$260,000
2
bds
|
1
ba
|
929
sqft
|
built
1965
253 Prospect Ave NE, Grand Rapids, MI 49503
$-828
Cash flow
-16.6%
Cash-on-Cash Return
2.3%
Cap rate
0.8%
Rent to Value Ratio
Active
$479,900
3
bds
|
3
ba
|
1,709
sqft
|
built
1900
600 Broadway Ave NW, Grand Rapids, MI 49504
$-1,445
Cash flow
-15.7%
Cash-on-Cash Return
2.5%
Cap rate
0.7%
Rent to Value Ratio
Active
$259,000
bds
|
0
ba
|
0
sqft
|
built
1900
2033 Darwin Ave SW, Grand Rapids, MI 49507
$-26
Cash flow
-0.5%
Cash-on-Cash Return
6.0%
Cap rate
0.8%
Rent to Value Ratio
Active
$434,000
2
bds
|
2
ba
|
1,401
sqft
|
built
2008
335 Bridge St NW, Grand Rapids, MI 49504
$-1,755
Cash flow
-21.1%
Cash-on-Cash Return
1.3%
Cap rate
0.7%
Rent to Value Ratio
Active
$292,900
bds
|
0
ba
|
0
sqft
|
built
1922
46 Dickinson St SW, Grand Rapids, MI 49507
$-421
Cash flow
-7.5%
Cash-on-Cash Return
4.4%
Cap rate
0.6%
Rent to Value Ratio
Active
$749,900
3
bds
|
3
ba
|
2,171
sqft
|
built
2021
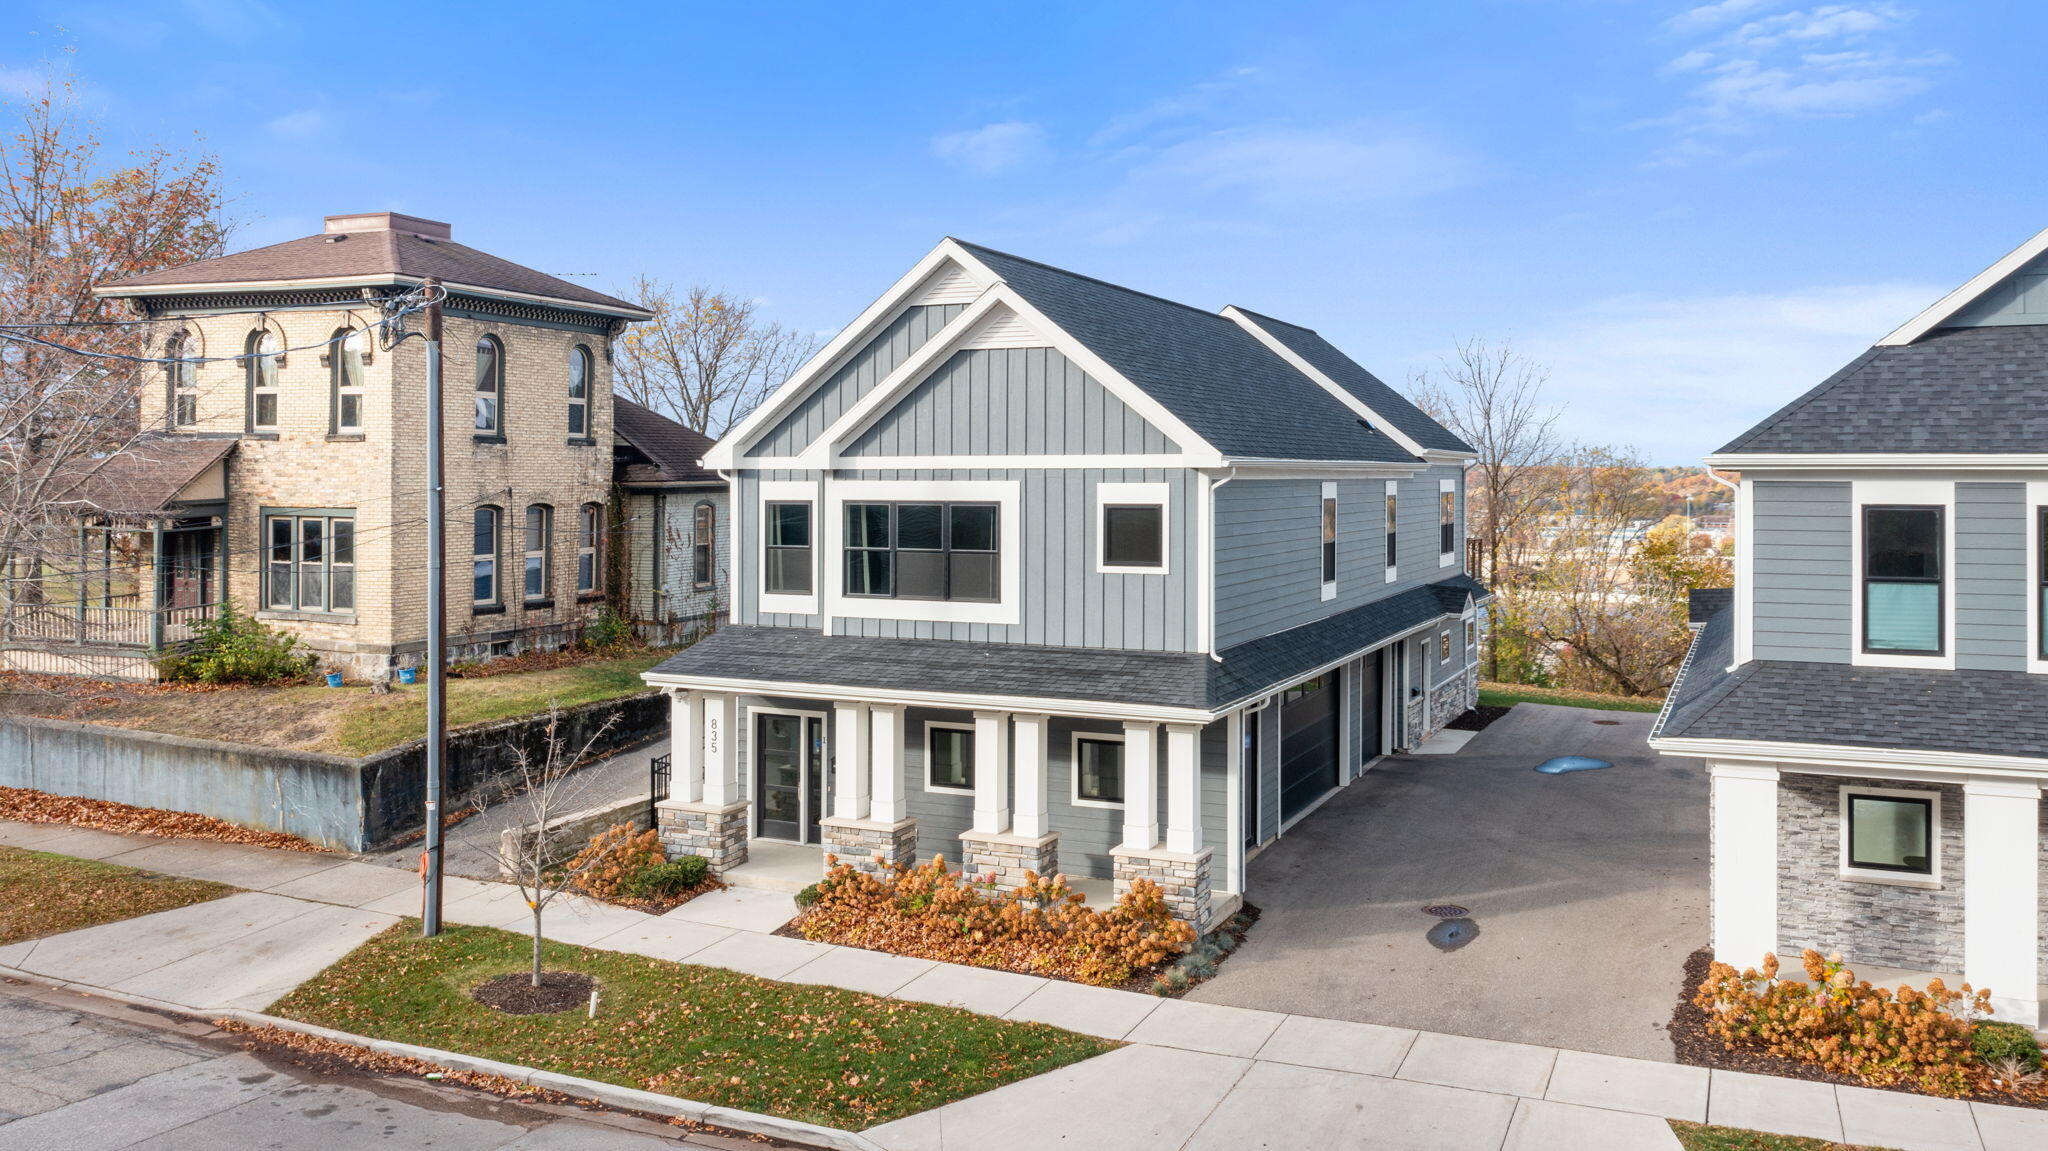
835 Fairview Ave NE, Grand Rapids, MI 49503
$-1,901
Cash flow
-13.2%
Cash-on-Cash Return
3.1%
Cap rate
0.6%
Rent to Value Ratio
Active
$309,900
2
bds
|
2
ba
|
1,215
sqft
|
built
2020
2384 Watertown Way, Grand Rapids, MI 49505
$-559
Cash flow
-9.4%
Cash-on-Cash Return
4.0%
Cap rate
0.8%
Rent to Value Ratio
Active
$460,000
2
bds
|
2
ba
|
1,495
sqft
|
built
2007
335 Bridge St NW, Grand Rapids, MI 49504
$-1,317
Cash flow
-14.9%
Cash-on-Cash Return
2.7%
Cap rate
0.7%
Rent to Value Ratio
Active
$159,999
4
bds
|
3
ba
|
2,744
sqft
|
built
1925
1114 Hall St SE, Grand Rapids, MI 49507
$333
Cash flow
10.9%
Cash-on-Cash Return
8.6%
Cap rate
1.1%
Rent to Value Ratio
Active
$999,000
3
bds
|
3
ba
|
3,200
sqft
|
built
1880
101 Carl Dr NE, Ada, MI 49301
$-1,826
Cash flow
-9.5%
Cash-on-Cash Return
4.0%
Cap rate
0.6%
Rent to Value Ratio
Active
$450,000
2
bds
|
2
ba
|
1,211
sqft
|
built
1921
201 Michigan St NW, Grand Rapids, MI 49503
$-1,378
Cash flow
-16.0%
Cash-on-Cash Return
2.5%
Cap rate
0.8%
Rent to Value Ratio
Active
$1,500,000
4
bds
|
5
ba
|
3,850
sqft
|
built
2011
7217 Davies Dr NE, Rockford, MI 49341
$-4,245
Cash flow
-14.8%
Cash-on-Cash Return
2.8%
Cap rate
0.4%
Rent to Value Ratio
Active
$485,000
2
bds
|
2
ba
|
1,306
sqft
|
built
1915
27 Library St NE, Grand Rapids, MI 49503
$-1,645
Cash flow
-17.7%
Cash-on-Cash Return
2.1%
Cap rate
0.7%
Rent to Value Ratio

Active
$400,000
2
bds
|
2
ba
|
1,492
sqft
|
built
1915
60 Monroe Center St NW, Grand Rapids, MI 49503
$-897
Cash flow
-11.7%
Cash-on-Cash Return
3.5%
Cap rate
0.8%
Rent to Value Ratio
Active
$467,900
2
bds
|
3
ba
|
1,246
sqft
|
built
2019
631 Fairview Ave NE, Grand Rapids, MI 49503
$-1,226
Cash flow
-13.7%
Cash-on-Cash Return
3.0%
Cap rate
0.7%
Rent to Value Ratio
Active
$384,900
1
bds
|
2
ba
|
1,031
sqft
|
built
2008
335 Bridge St NW, Grand Rapids, MI 49504
$-1,295
Cash flow
-17.6%
Cash-on-Cash Return
2.1%
Cap rate
0.7%
Rent to Value Ratio
Active
$340,000
3
bds
|
2
ba
|
2,048
sqft
|
built
1961
4481 Marshall Ave SE, Kentwood, MI 49508
$-642
Cash flow
-9.9%
Cash-on-Cash Return
3.9%
Cap rate
0.6%
Rent to Value Ratio

Active
$600,000
bds
|
0
ba
|
0
sqft
|
built
1878
125 Eastern Ave SE, Grand Rapids, MI 49503
$-1,275
Cash flow
-11.1%
Cash-on-Cash Return
3.6%
Cap rate
0.6%
Rent to Value Ratio

Active
$1,200,000
bds
|
0
ba
|
0
sqft
|
built
1915
800 Douglas St NW, Grand Rapids, MI 49504
$-3,655
Cash flow
-15.9%
Cash-on-Cash Return
2.5%
Cap rate
0.3%
Rent to Value Ratio

Active
$375,000
bds
|
0
ba
|
0
sqft
|
built
1930
57 Leonard St NE, Grand Rapids, MI 49503
$-355
Cash flow
-4.9%
Cash-on-Cash Return
5.0%
Cap rate
0.7%
Rent to Value Ratio
Active
$295,000
bds
|
0
ba
|
0
sqft
|
built
1893
330 Page St NE, Grand Rapids, MI 49505
$-342
Cash flow
-6.0%
Cash-on-Cash Return
4.8%
Cap rate
0.7%
Rent to Value Ratio
Active
$998,000
3
bds
|
3
ba
|
3,218
sqft
|
built
1985
610 Cascade Hills Holw SE, Grand Rapids, MI 49546
$-3,178
Cash flow
-16.6%
Cash-on-Cash Return
2.3%
Cap rate
0.5%
Rent to Value Ratio

Active
$399,900
2
bds
|
2
ba
|
1,400
sqft
|
built
2009
335 Bridge St NW, Grand Rapids, MI 49504
$-1,178
Cash flow
-15.4%
Cash-on-Cash Return
2.6%
Cap rate
0.8%
Rent to Value Ratio

Active
$395,000
3
bds
|
3
ba
|
3,502
sqft
|
built
1921
922 Calvin Ave SE, Grand Rapids, MI 49506
$-270
Cash flow
-3.6%
Cash-on-Cash Return
5.3%
Cap rate
0.7%
Rent to Value Ratio
Active
$275,000
bds
|
0
ba
|
0
sqft
|
built
1905
318 Diamond Ave SE, Grand Rapids, MI 49506
$-376
Cash flow
-7.1%
Cash-on-Cash Return
4.5%
Cap rate
0.8%
Rent to Value Ratio
Active
$399,000
5
bds
|
3
ba
|
3,742
sqft
|
built
1950
13664 Wabasis Ave NE, Cedar Springs, MI 49319
$-400
Cash flow
-5.2%
Cash-on-Cash Return
4.9%
Cap rate
0.7%
Rent to Value Ratio
Active
$524,900
2
bds
|
2
ba
|
1,702
sqft
|
built
2009
335 Bridge St NW, Grand Rapids, MI 49504
$-1,839
Cash flow
-18.3%
Cash-on-Cash Return
1.9%
Cap rate
0.7%
Rent to Value Ratio
Active
$210,000
3
bds
|
1
ba
|
1,116
sqft
|
built
1925
1632 Kalamazoo Ave SE, Grand Rapids, MI 49507
$-2
Cash flow
0.0%
Cash-on-Cash Return
6.1%
Cap rate
1.0%
Rent to Value Ratio
Active
$399,999
bds
|
0
ba
|
0
sqft
|
built
1910
914 Courtney St NW, Grand Rapids, MI 49504
$-531
Cash flow
-6.9%
Cash-on-Cash Return
4.6%
Cap rate
0.6%
Rent to Value Ratio