Kent County Investment Properties for Sale
Browse homes for sale and investment properties in Kent County. Refine your search by price, property type, or more.
Best cash flowing properties in Kent County
Active
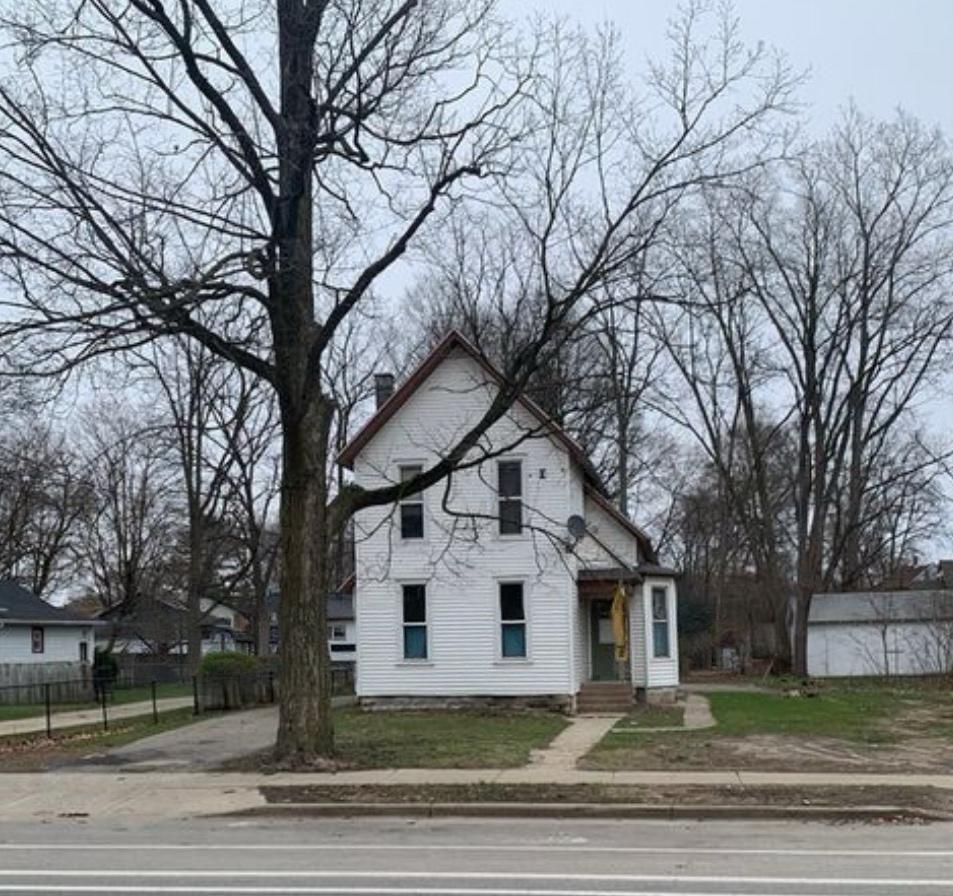
$199,900
bds
|
0
ba
|
0
sqft
|
built
1890
1030 Eastern Ave SE, Grand Rapids, MI 49507
$176
Cash flow
4.6%
Cash-on-Cash Return
7.3%
Cap rate
1.0%
Rent to Value Ratio
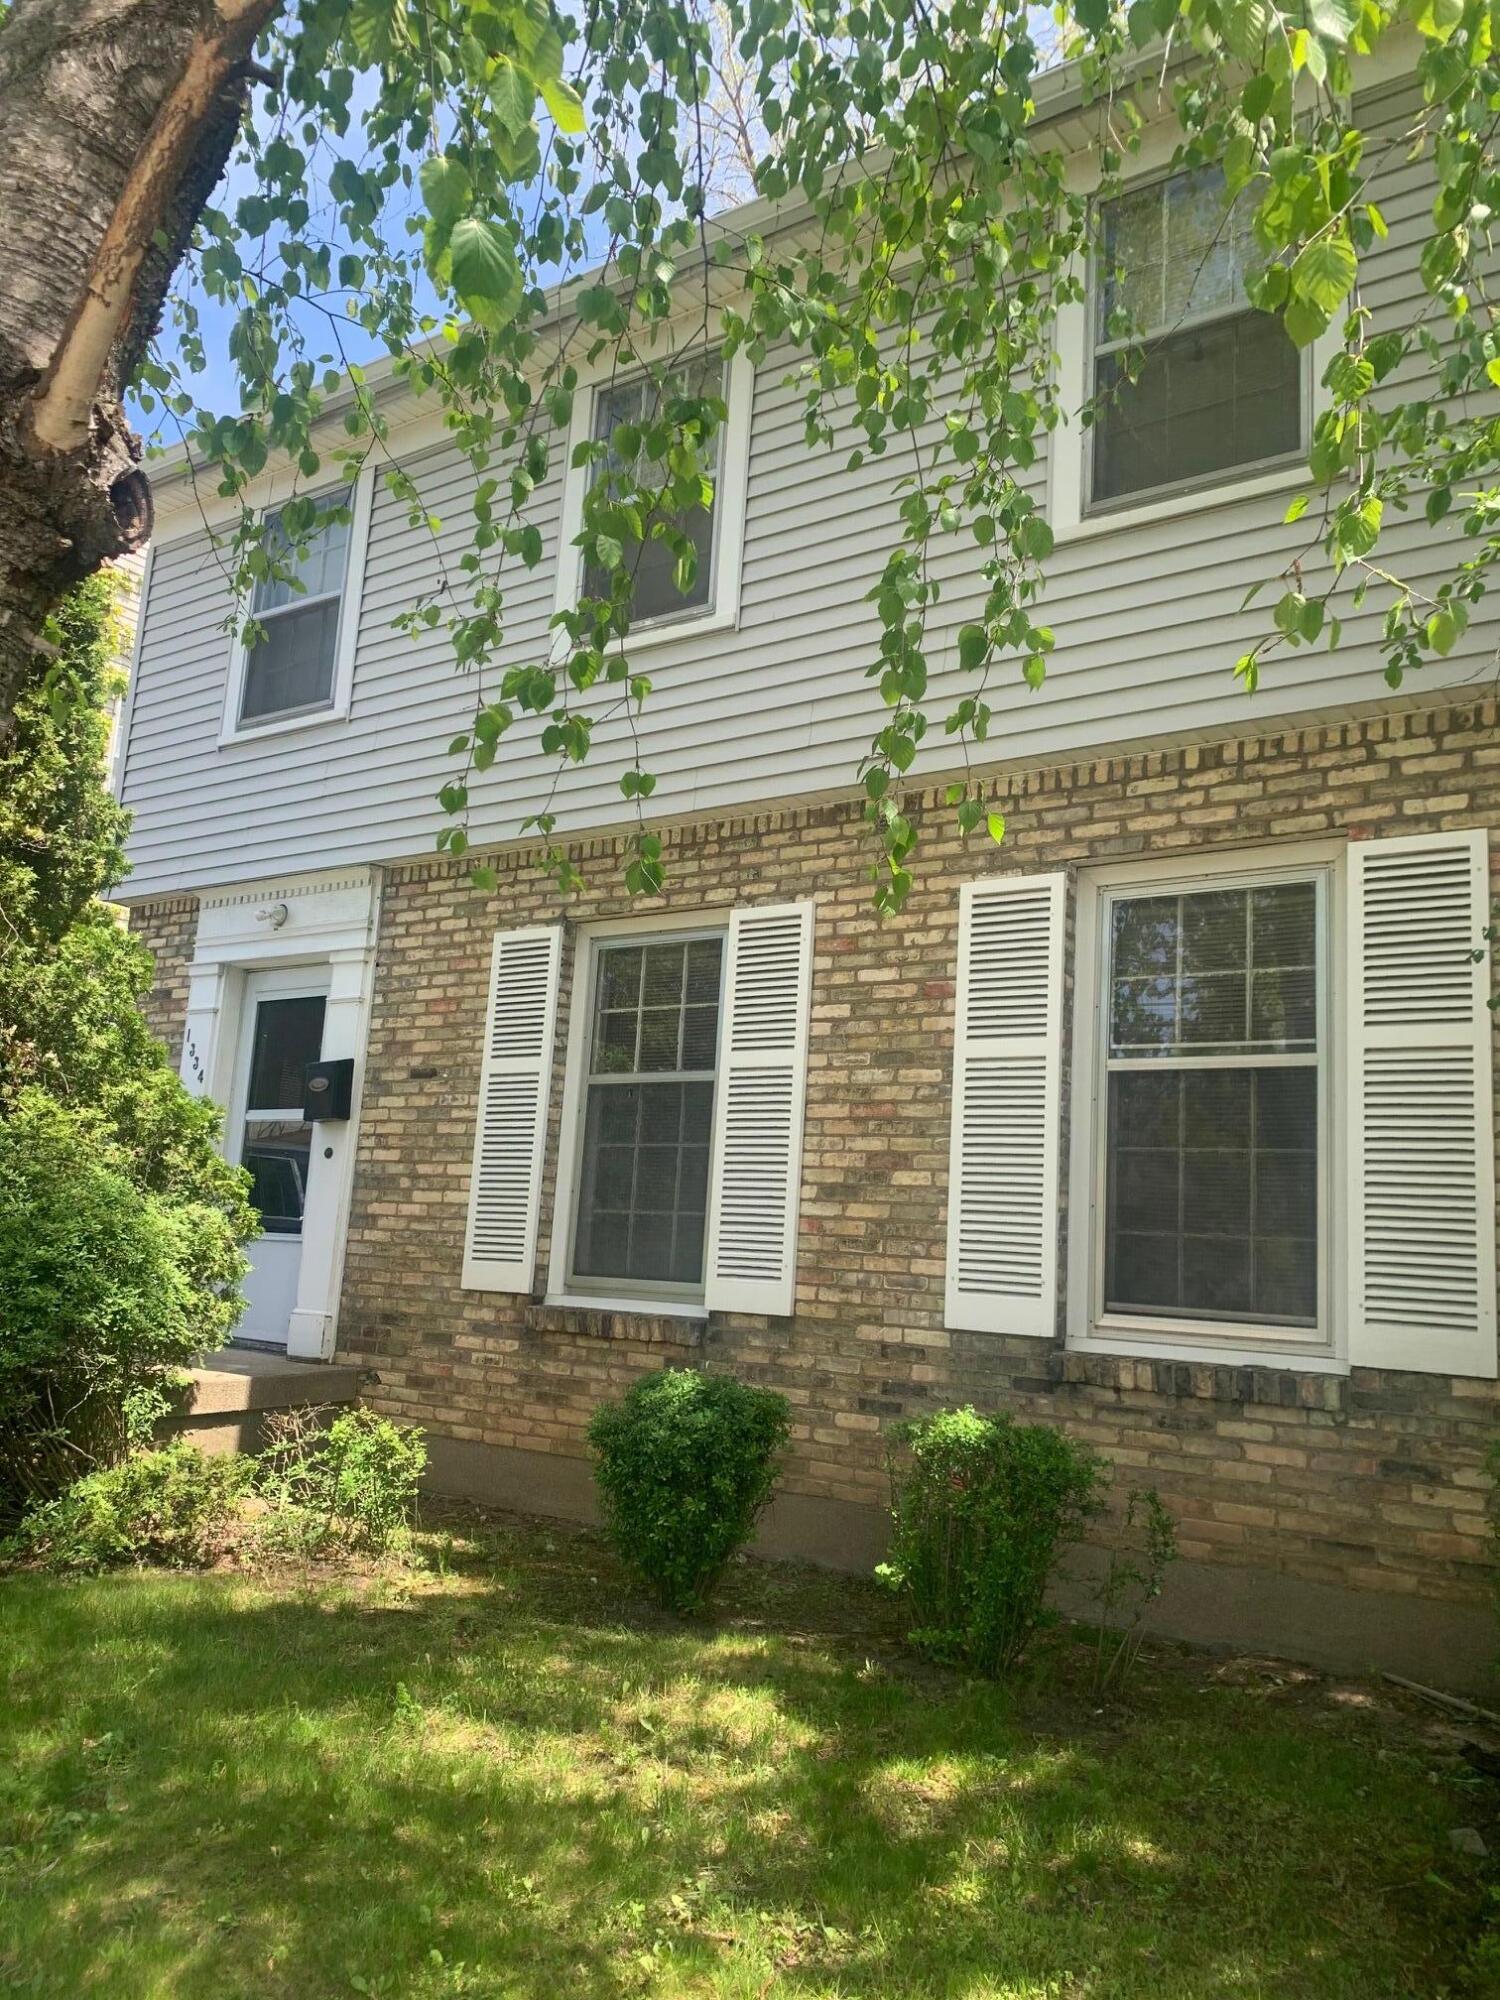
Active
$229,900
3
bds
|
2
ba
|
1,578
sqft
|
built
1937
1334 Fuller Ave SE, Grand Rapids, MI 49506
$76
Cash flow
1.7%
Cash-on-Cash Return
6.7%
Cap rate
0.9%
Rent to Value Ratio
479 out of 649 properties for sale in Kent County
Limited Results Shown
Create a free account, or log in to reveal all property listings and enjoy the complete experience.
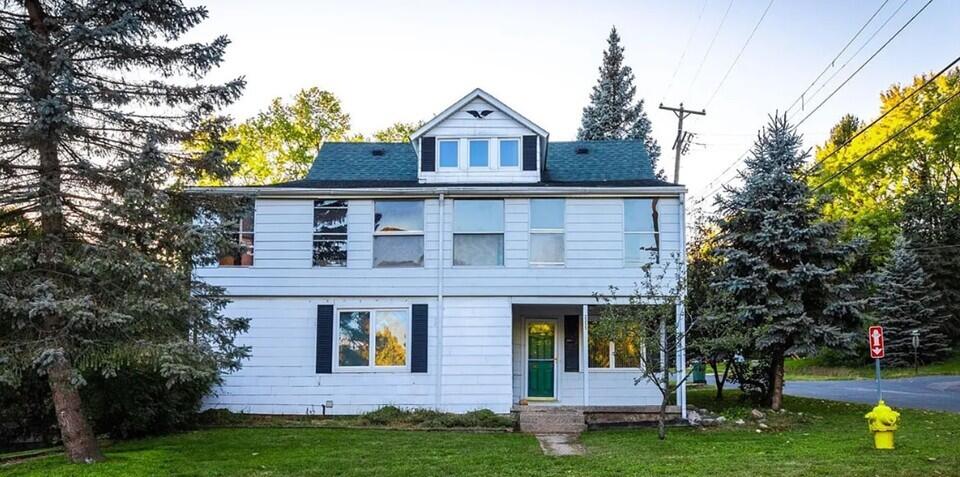
Active
$284,900
bds
|
0
ba
|
0
sqft
|
built
1925
2255 Gaynor Ave NW, Grand Rapids, MI 49544
$-191
Cash flow
-3.5%
Cash-on-Cash Return
5.5%
Cap rate
0.8%
Rent to Value Ratio
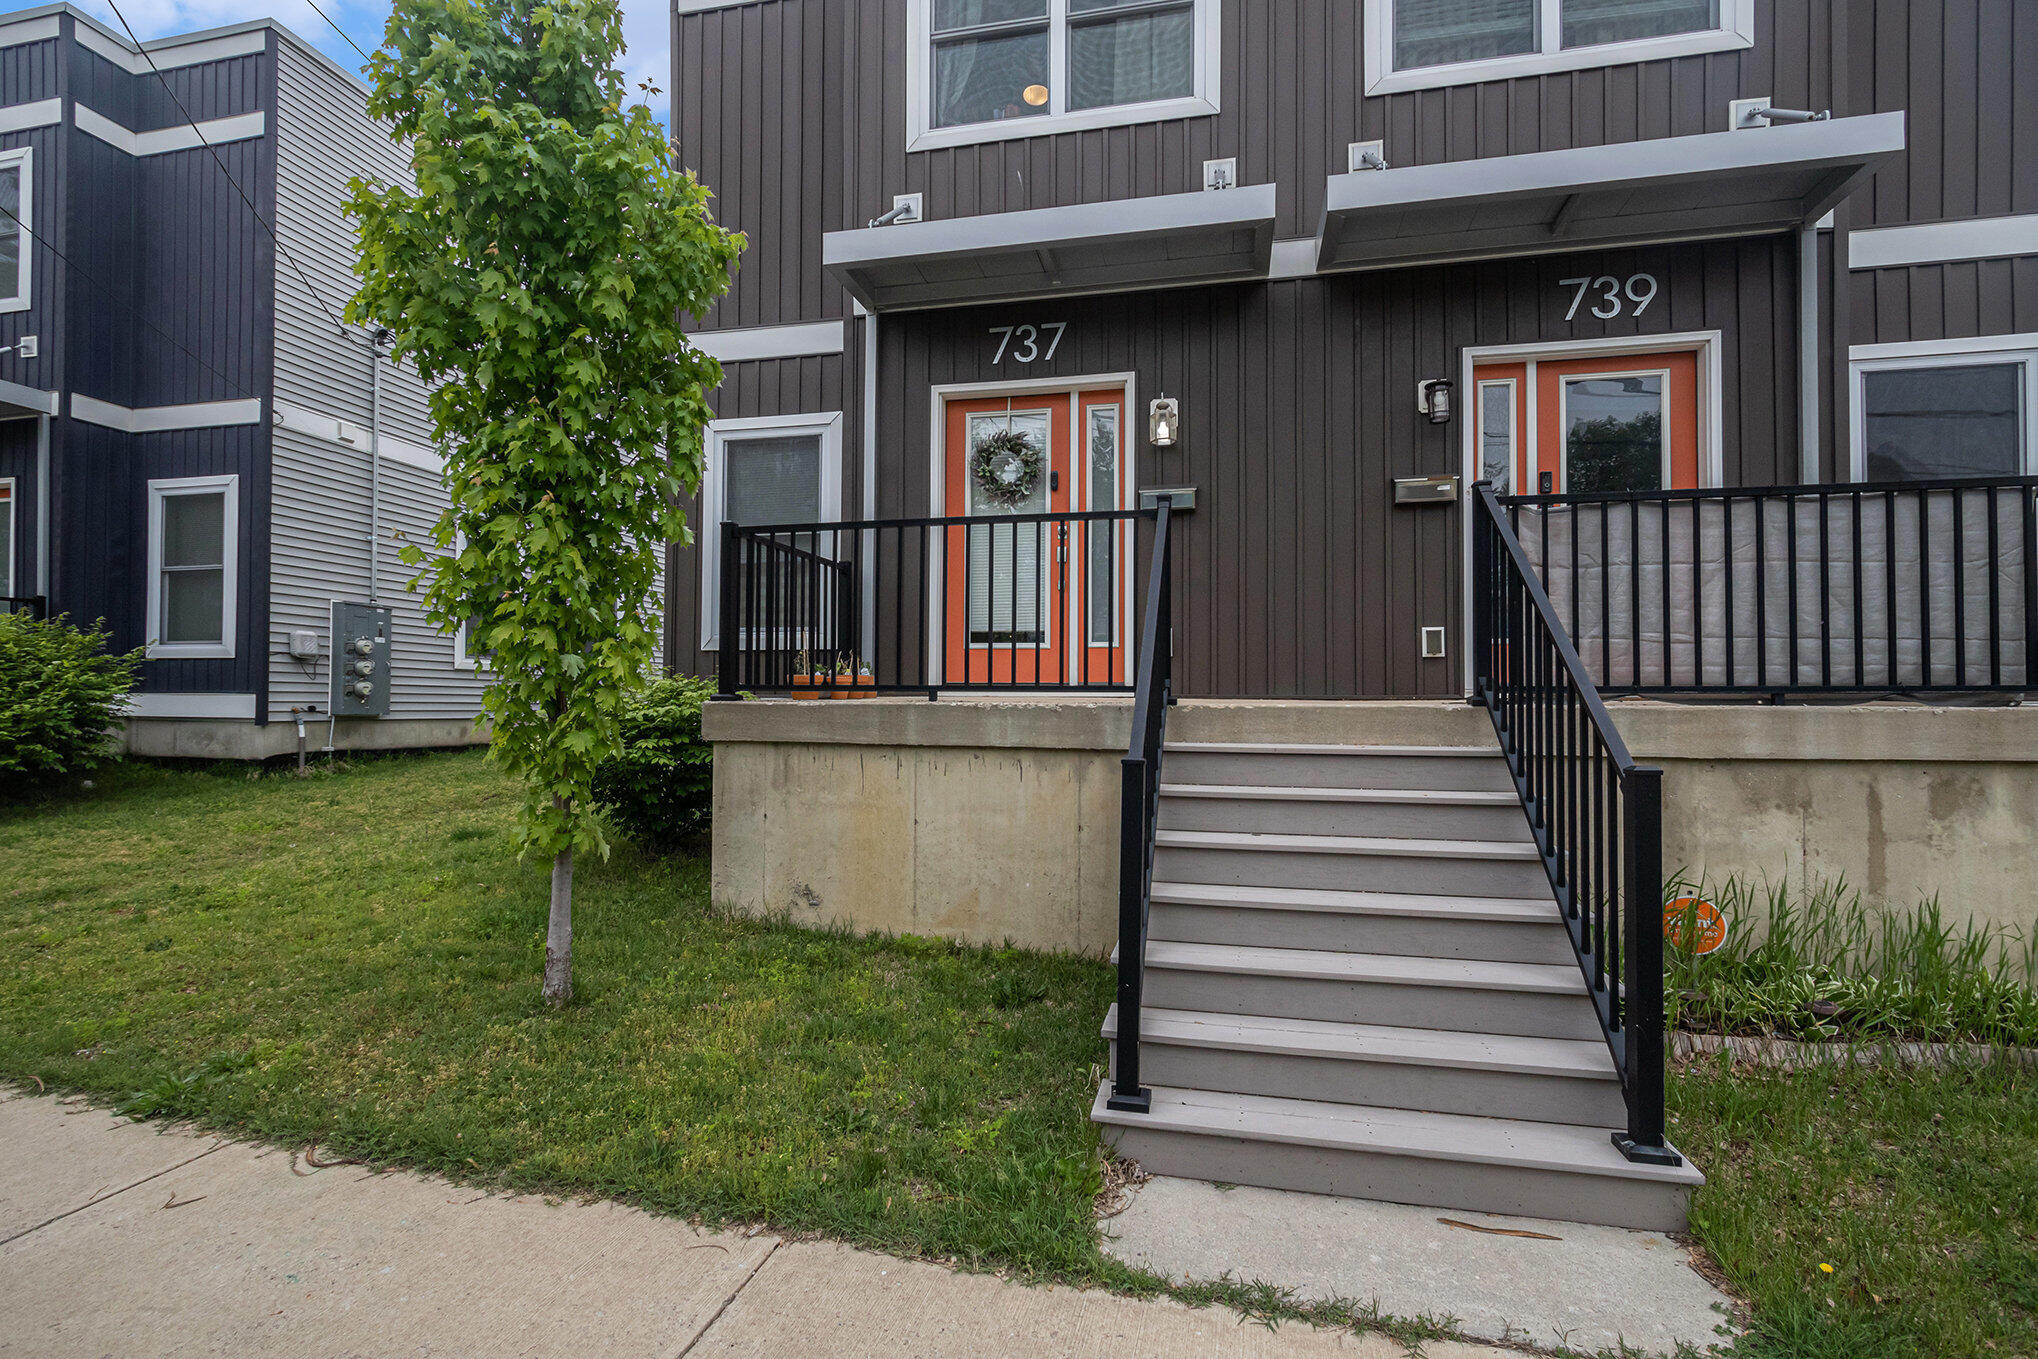
Active
$340,000
4
bds
|
4
ba
|
1,952
sqft
|
built
2019
737 Bates St SE, Grand Rapids, MI 49503
$-918
Cash flow
-14.1%
Cash-on-Cash Return
3.0%
Cap rate
0.6%
Rent to Value Ratio
Active
$330,000
2
bds
|
2
ba
|
1,363
sqft
|
built
1900
600 Broadway Ave NW, Grand Rapids, MI 49504
$-1,286
Cash flow
-20.3%
Cash-on-Cash Return
1.6%
Cap rate
0.8%
Rent to Value Ratio
Active
$375,000
3
bds
|
3
ba
|
2,018
sqft
|
built
2022
245 Liberty St NW, Sparta, MI 49345
$-511
Cash flow
-7.1%
Cash-on-Cash Return
4.6%
Cap rate
0.7%
Rent to Value Ratio
Pending
$319,900
3
bds
|
2
ba
|
1,423
sqft
|
built
1945
2480 32nd St SE, Kentwood, MI 49512
$-443
Cash flow
-7.2%
Cash-on-Cash Return
4.6%
Cap rate
0.7%
Rent to Value Ratio
Active
$385,000
2
bds
|
2
ba
|
1,440
sqft
|
built
2008
2137 New Town Dr NE, Grand Rapids, MI 49525
$-1,085
Cash flow
-14.7%
Cash-on-Cash Return
2.9%
Cap rate
0.6%
Rent to Value Ratio
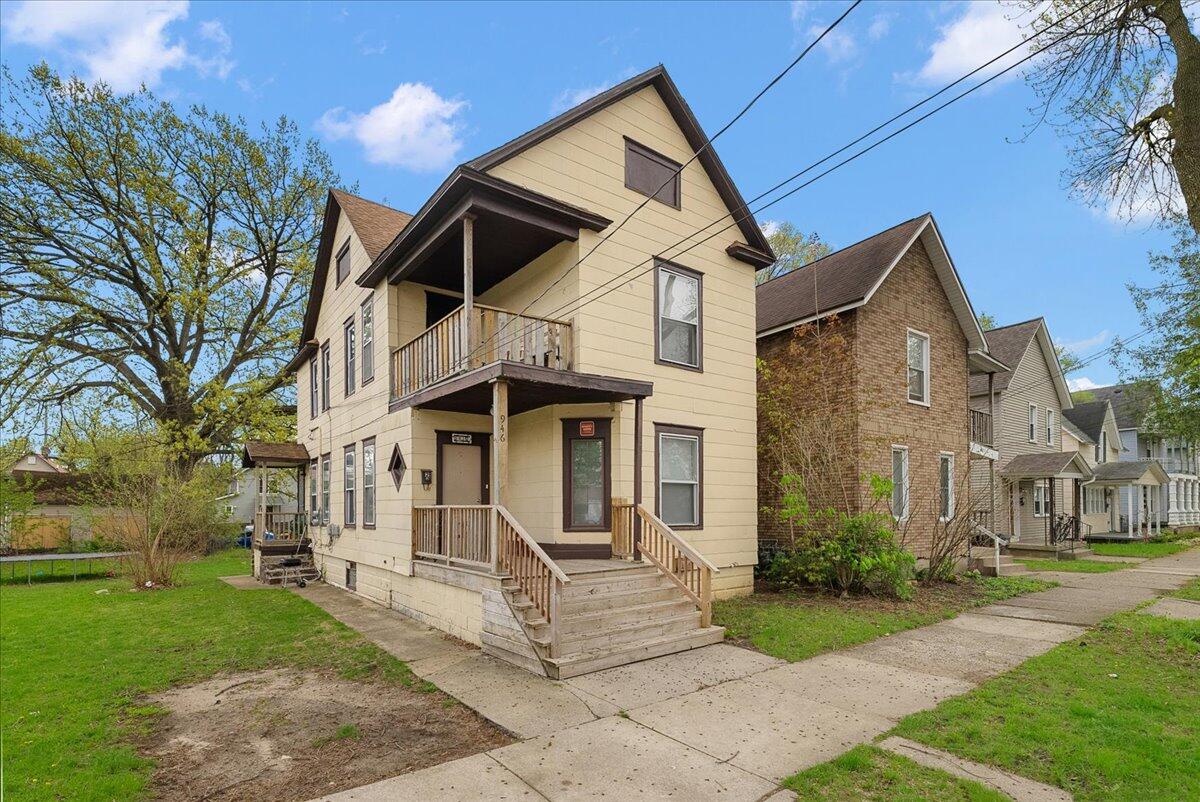
Active
$259,900
bds
|
0
ba
|
0
sqft
|
built
1907
946 Mc Reynolds Ave NW, Grand Rapids, MI 49504
$-501
Cash flow
-10.1%
Cash-on-Cash Return
4.0%
Cap rate
0.7%
Rent to Value Ratio

Active
$289,900
4
bds
|
3
ba
|
1,394
sqft
|
built
1920
964 Lincoln Ave NW, Grand Rapids, MI 49504
$-407
Cash flow
-7.3%
Cash-on-Cash Return
4.6%
Cap rate
0.6%
Rent to Value Ratio
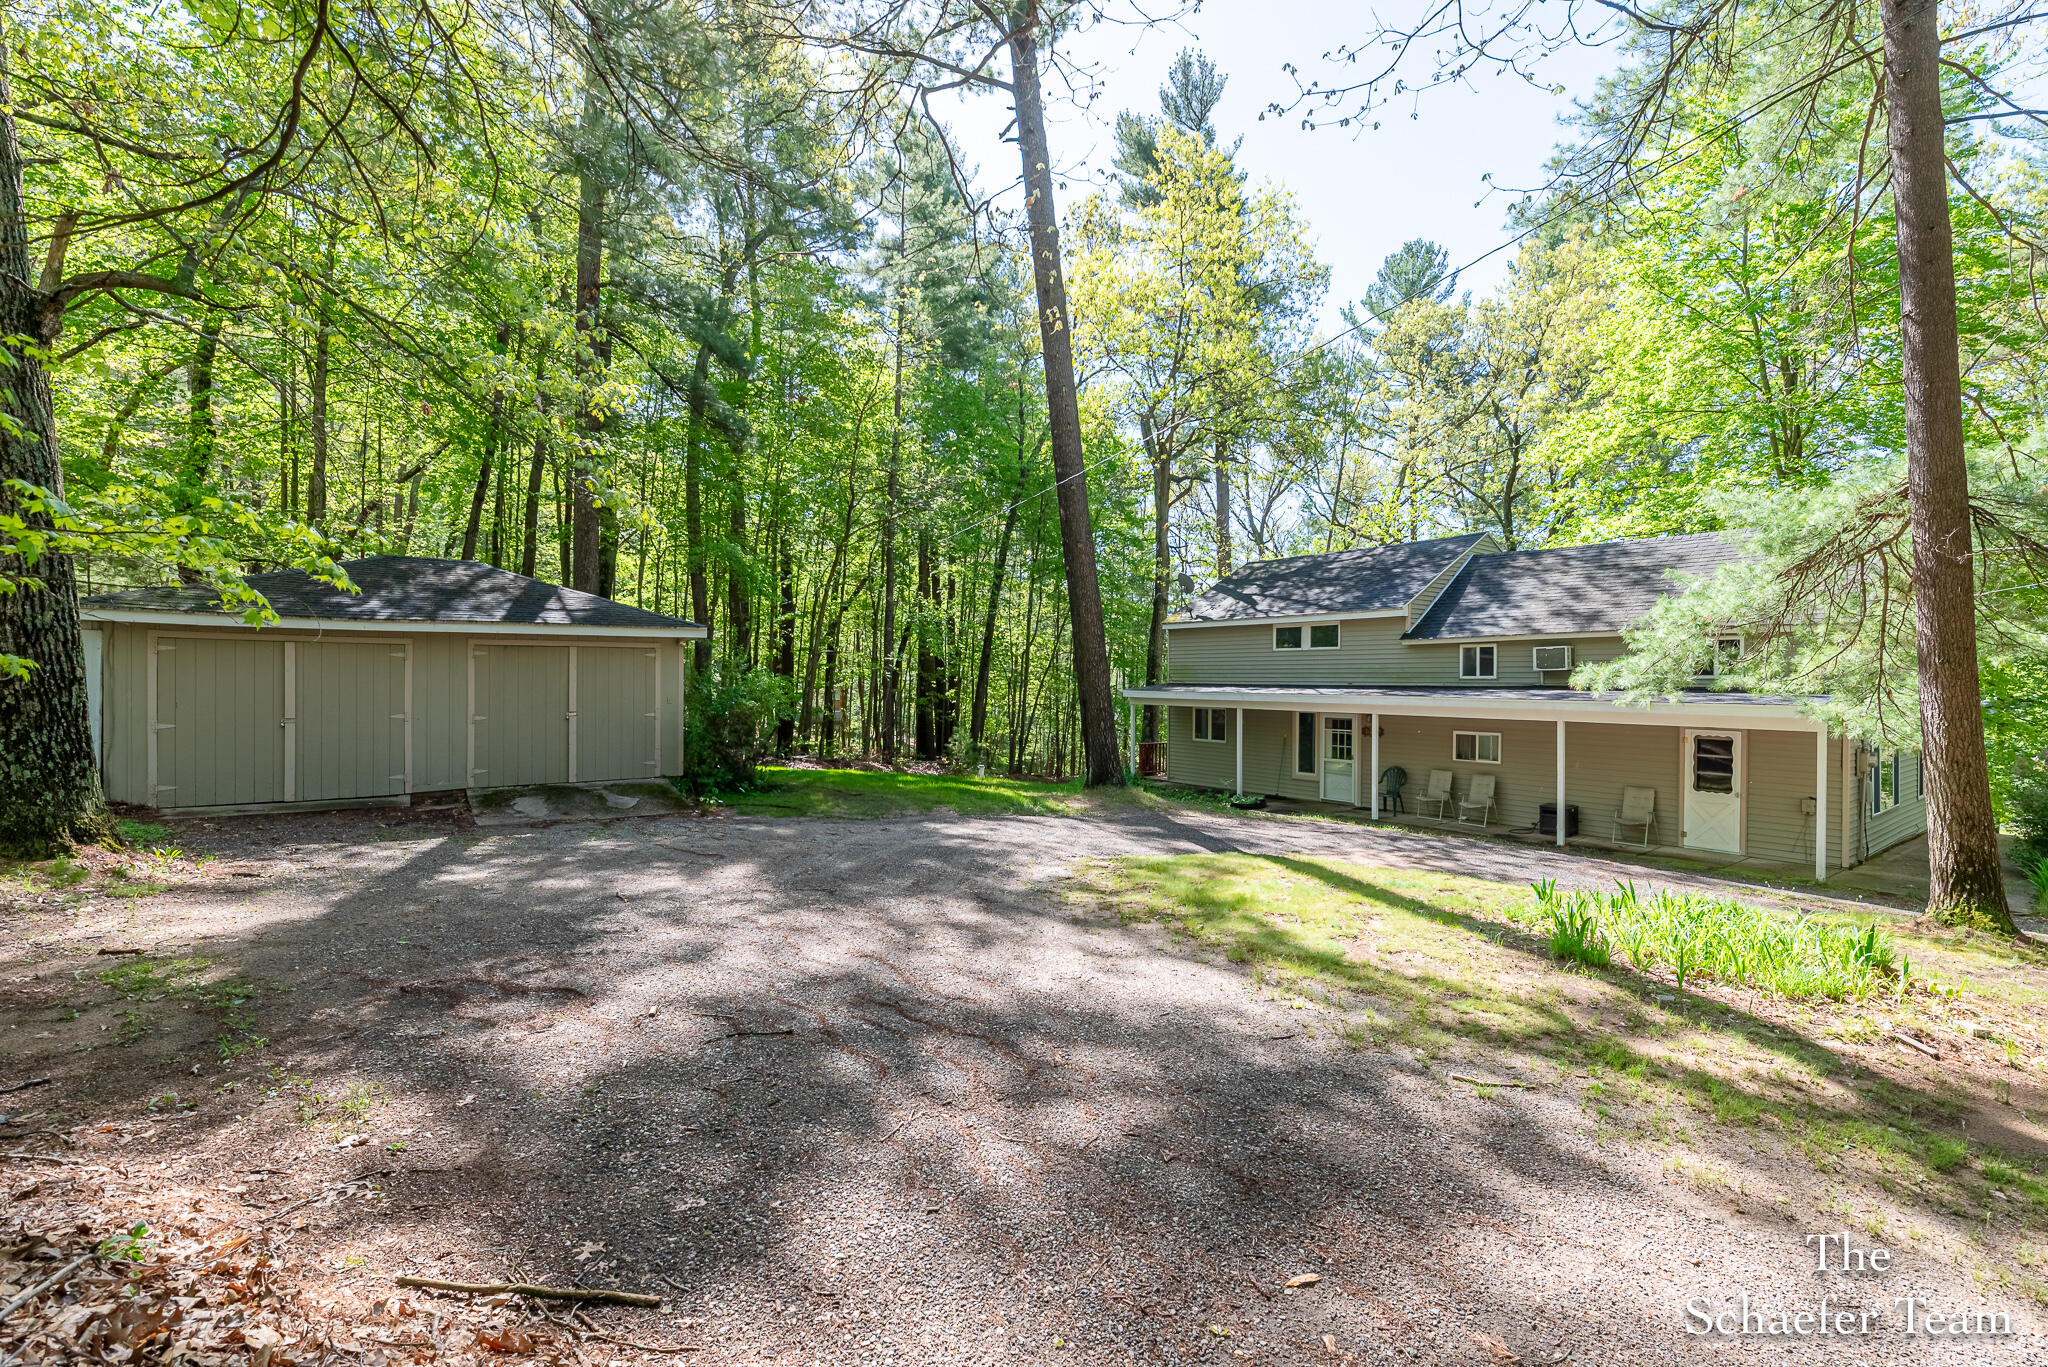
Active
$475,000
2
bds
|
2
ba
|
1,824
sqft
|
built
1972
10436 Morgan Mills Rd NE, Greenville, MI 48838
$-951
Cash flow
-10.4%
Cash-on-Cash Return
3.9%
Cap rate
0.5%
Rent to Value Ratio
Active
$339,900
6
bds
|
4
ba
|
4,425
sqft
|
built
1965
11391 Wellman Ave NE, Rockford, MI 49341
$-179
Cash flow
-2.7%
Cash-on-Cash Return
5.7%
Cap rate
0.7%
Rent to Value Ratio
Active
$229,900
bds
|
0
ba
|
0
sqft
|
built
1915
954 Adams St SE, Grand Rapids, MI 49507
$-4
Cash flow
-0.1%
Cash-on-Cash Return
6.3%
Cap rate
0.9%
Rent to Value Ratio
Active
$915,000
5
bds
|
4
ba
|
4,488
sqft
|
built
2014
8030 Lionel Dr SW, Byron Center, MI 49315
$-2,879
Cash flow
-16.4%
Cash-on-Cash Return
2.5%
Cap rate
0.4%
Rent to Value Ratio
Pending
$1,095,000
bds
|
0
ba
|
0
sqft
|
built
1962
2951 Vineland Ave SE, Grand Rapids, MI 49508
$-6,341
Cash flow
-30.2%
Cash-on-Cash Return
-0.7%
Cap rate
0.1%
Rent to Value Ratio

Active
$179,900
3
bds
|
1
ba
|
1,052
sqft
|
built
1900
1155 Cromwell Ave SE, Grand Rapids, MI 49507
$54
Cash flow
1.6%
Cash-on-Cash Return
6.6%
Cap rate
0.9%
Rent to Value Ratio

Active
$598,000
2
bds
|
1
ba
|
976
sqft
|
built
1925
2301 Schimperle Dr NE, Grand Rapids, MI 49525
$-2,088
Cash flow
-18.2%
Cash-on-Cash Return
2.1%
Cap rate
0.3%
Rent to Value Ratio
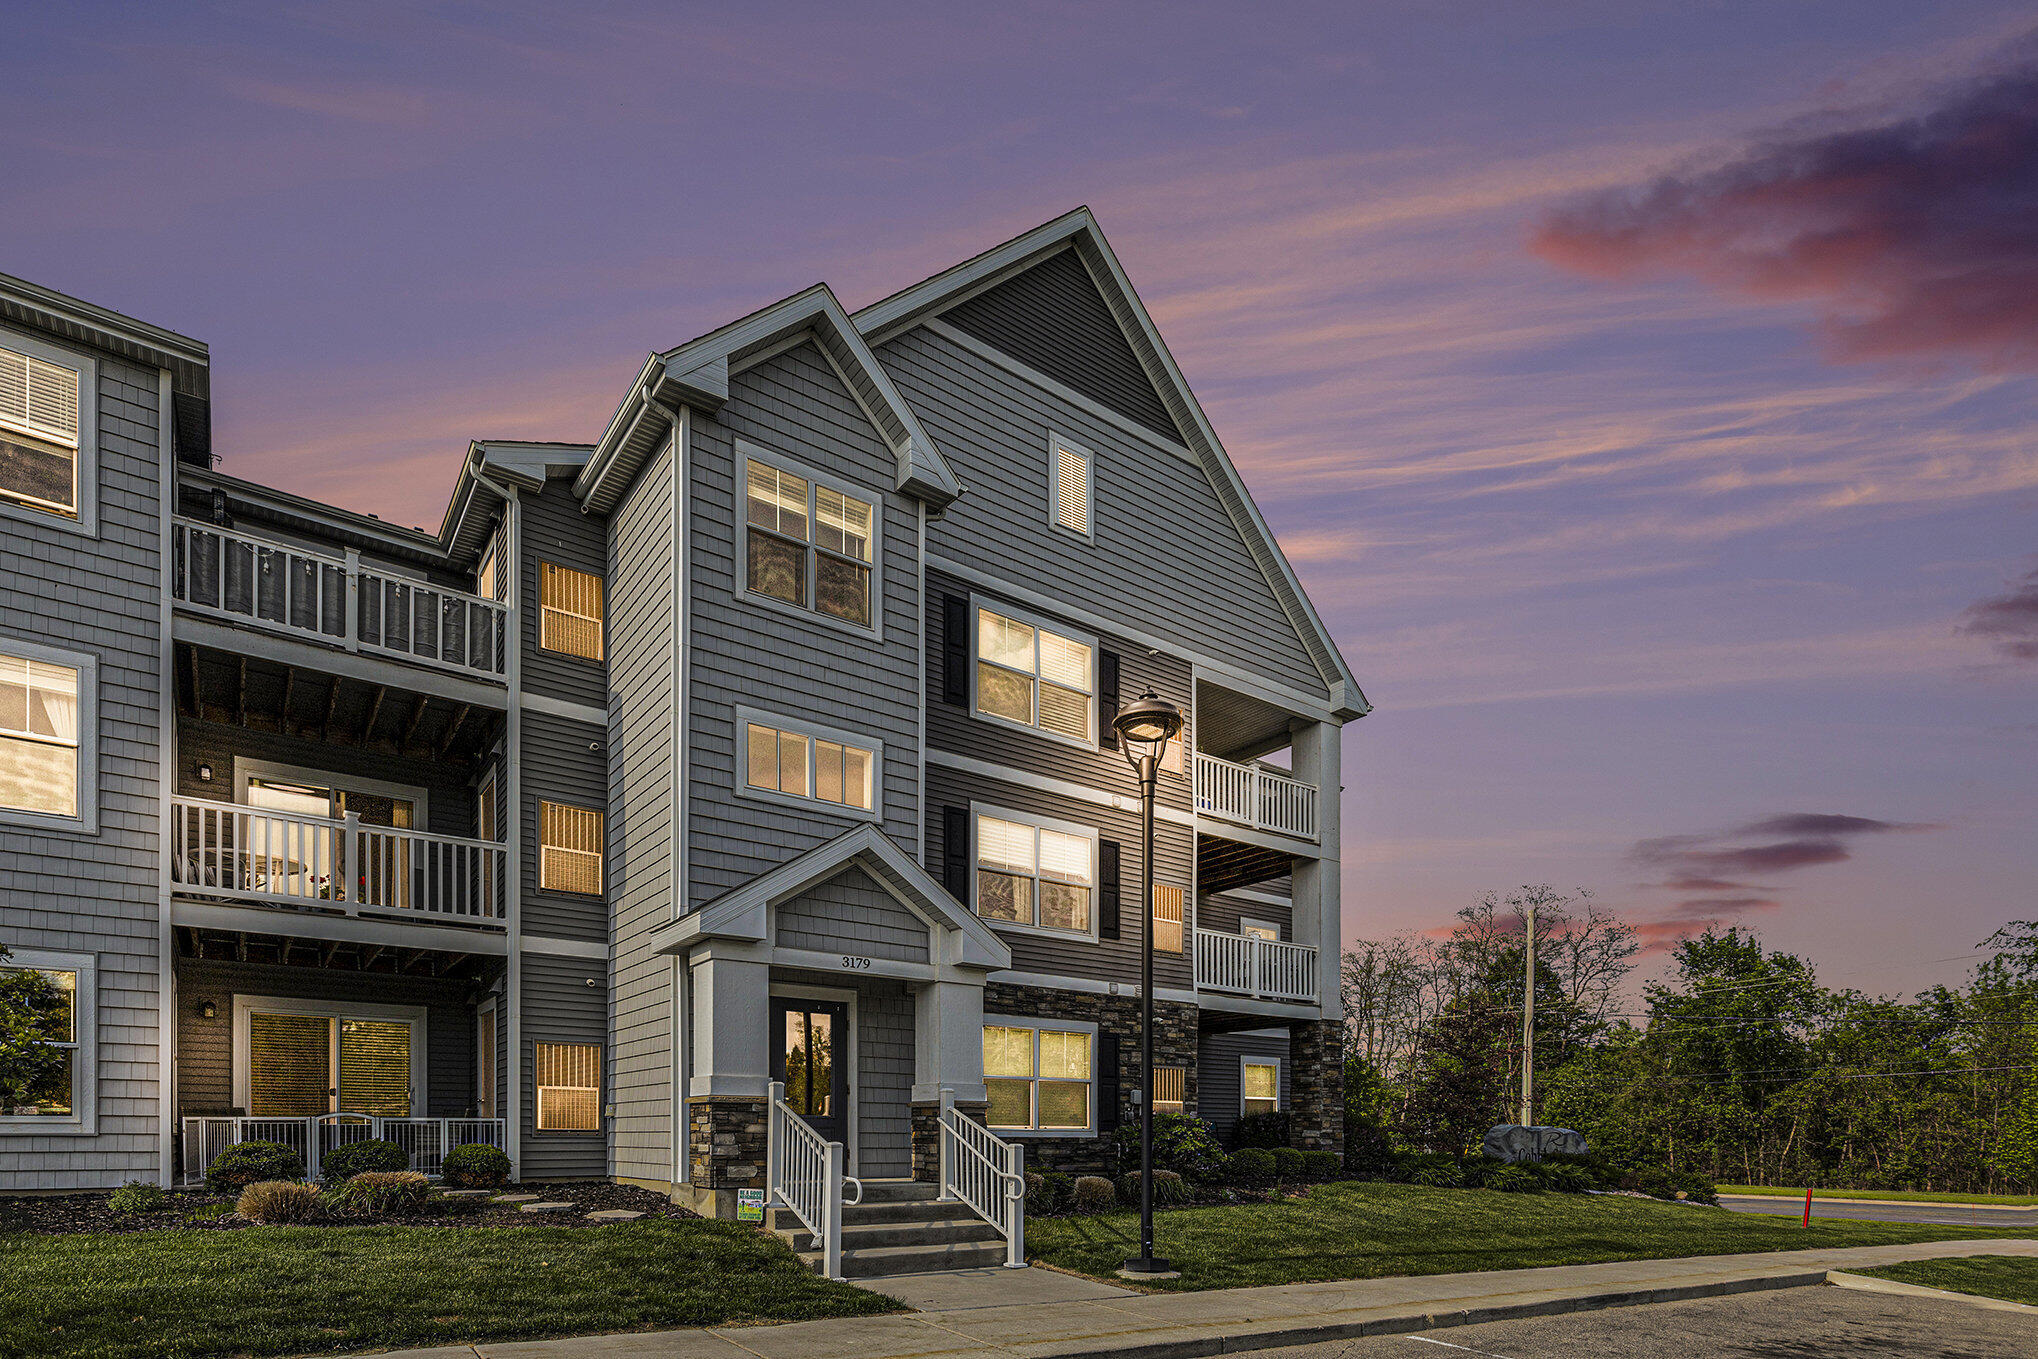
Active
$224,900
1
bds
|
1
ba
|
877
sqft
|
built
2020
3179 Blairview Pkwy SE, Kentwood, MI 49512
$-682
Cash flow
-15.8%
Cash-on-Cash Return
2.6%
Cap rate
0.8%
Rent to Value Ratio
Active
$199,900
bds
|
0
ba
|
0
sqft
|
built
1890
1030 Eastern Ave SE, Grand Rapids, MI 49507
$176
Cash flow
4.6%
Cash-on-Cash Return
7.3%
Cap rate
1.0%
Rent to Value Ratio
Pending
$449,900
3
bds
|
4
ba
|
2,666
sqft
|
built
2014
5922 Sable Ridge Dr SE, Kentwood, MI 49508
$-1,033
Cash flow
-12.0%
Cash-on-Cash Return
3.5%
Cap rate
0.6%
Rent to Value Ratio
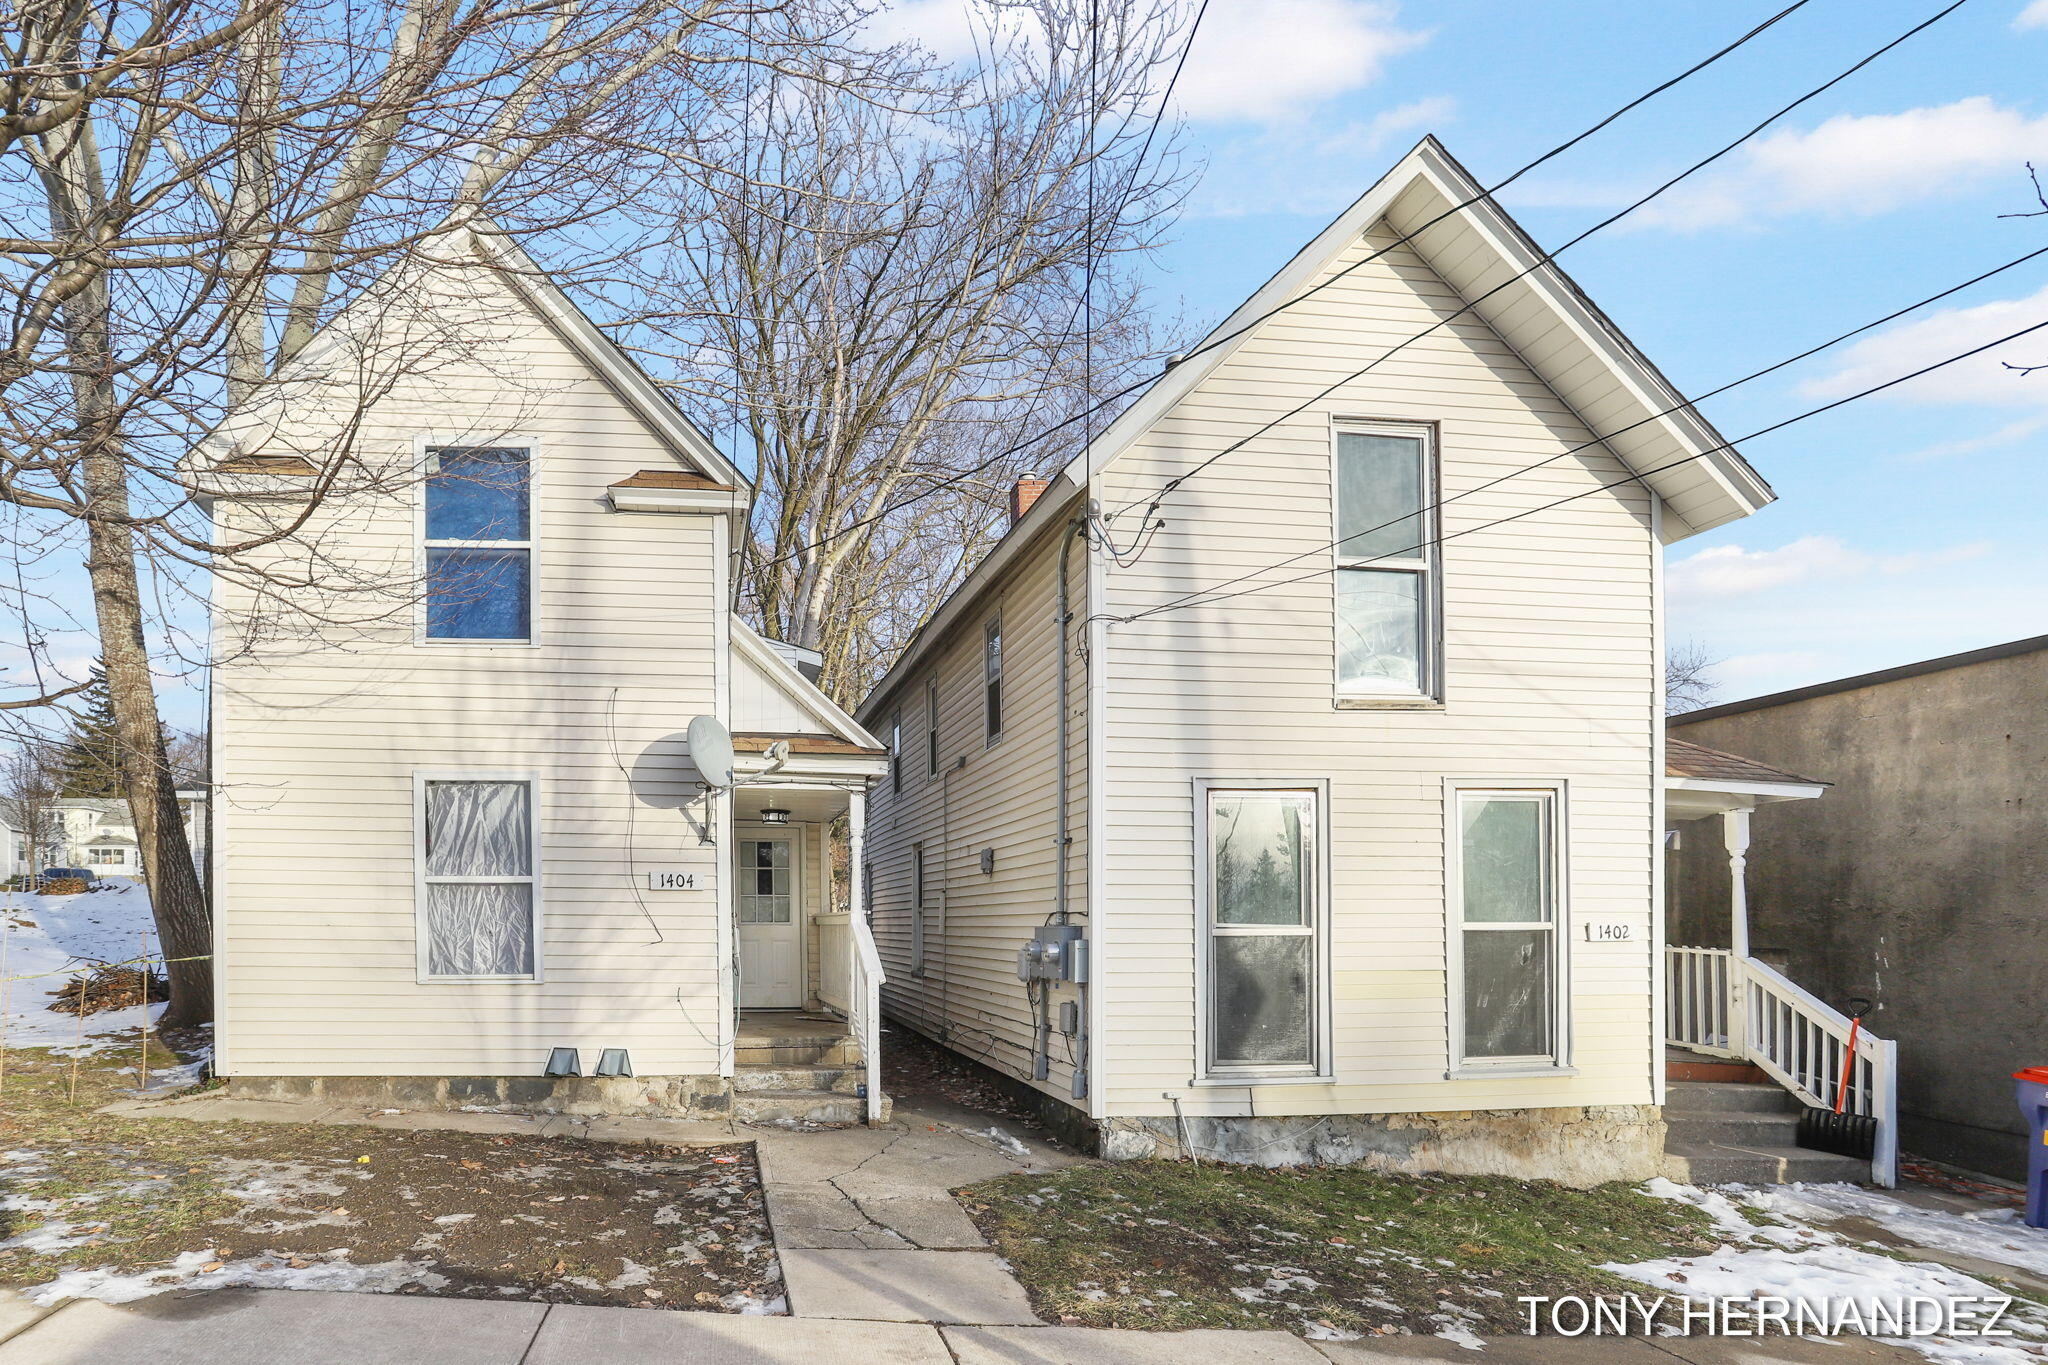
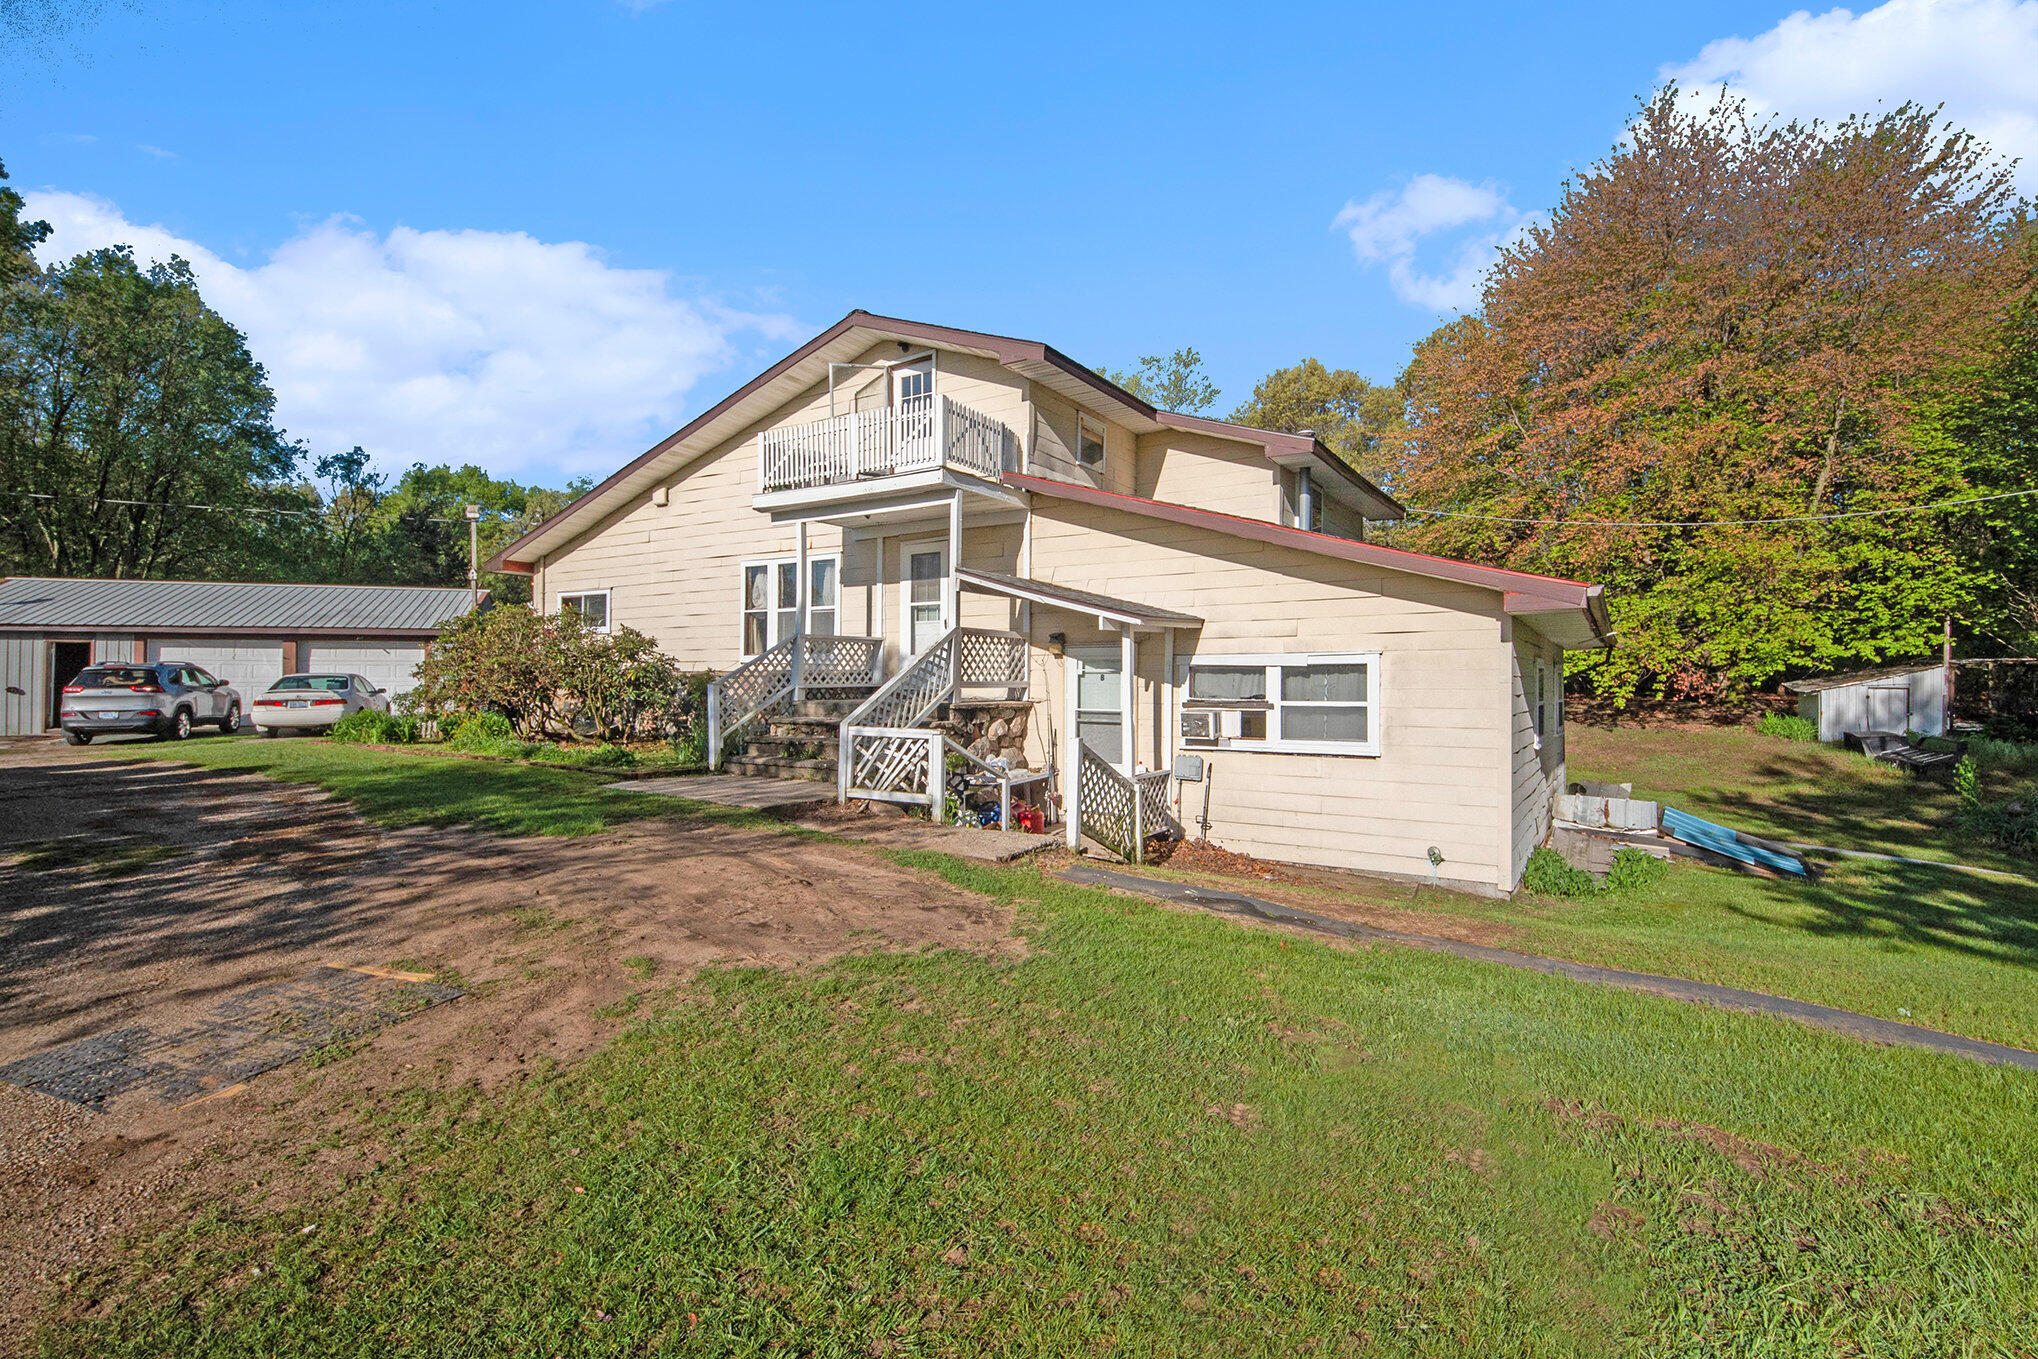
Active
$360,000
4
bds
|
0
ba
|
0
sqft
|
built
1890
1402 North Ave NE, Grand Rapids, MI 49505
$-920
Cash flow
-13.3%
Cash-on-Cash Return
3.2%
Cap rate
0.6%
Rent to Value Ratio
Active
$684,900
4
bds
|
3
ba
|
2,680
sqft
|
built
1978
7044 Cascade Rd SE, Grand Rapids, MI 49546
$-2,368
Cash flow
-18.0%
Cash-on-Cash Return
2.1%
Cap rate
0.4%
Rent to Value Ratio
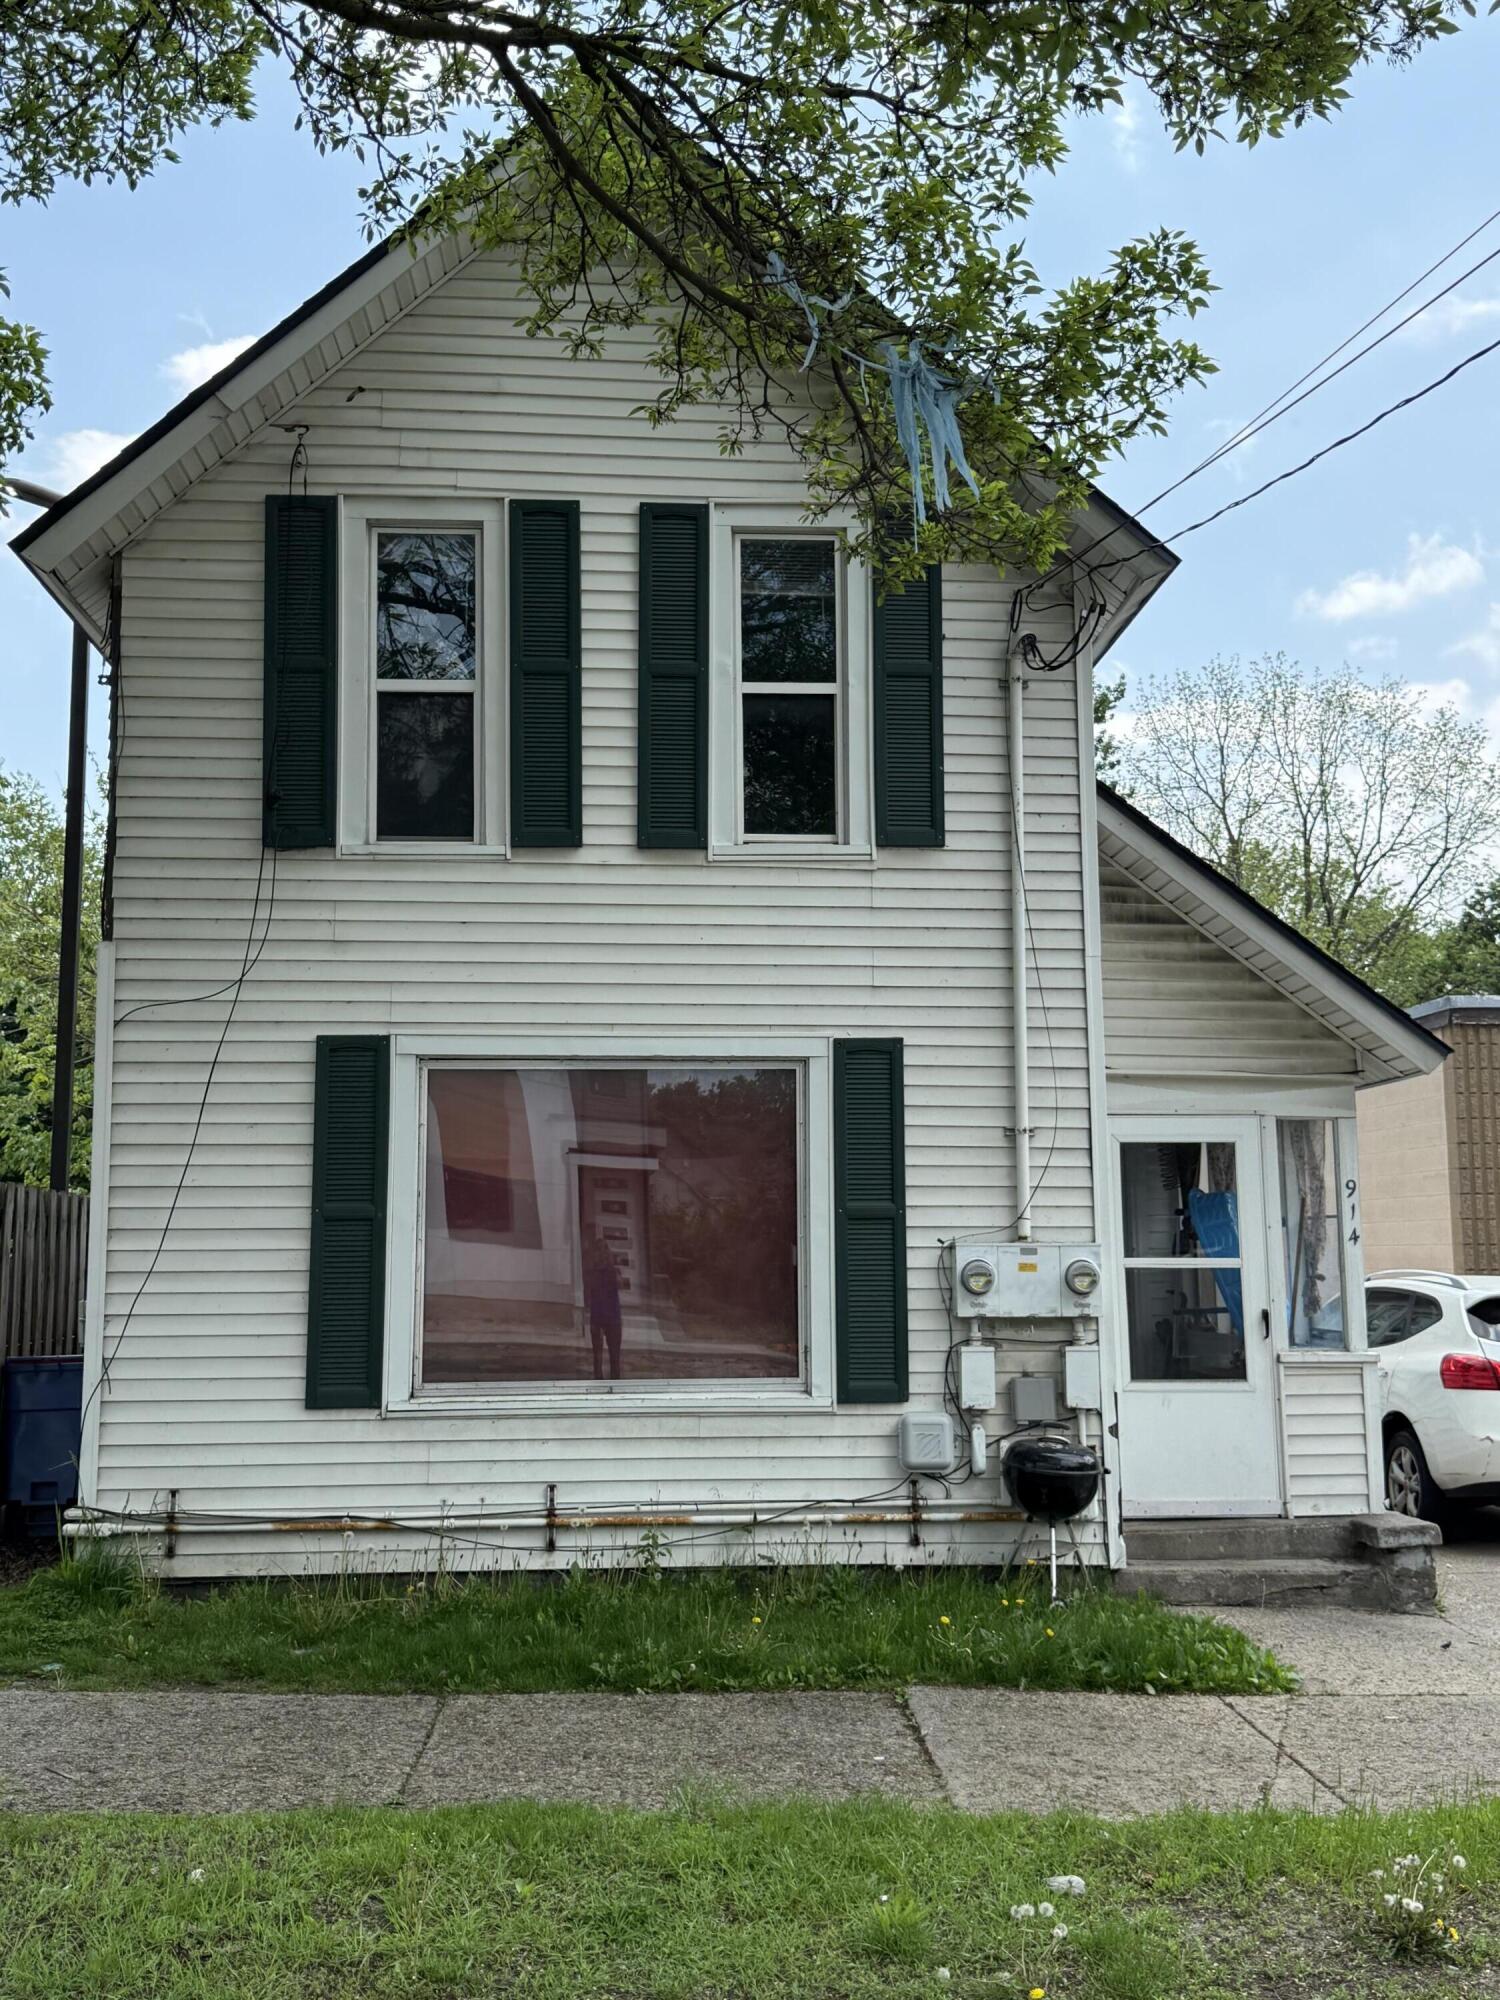
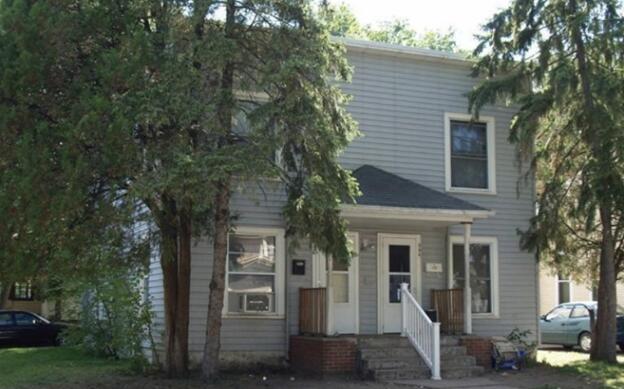
Active
$239,900
bds
|
0
ba
|
0
sqft
|
built
1910
914 Fulton St W, Grand Rapids, MI 49504
$-446
Cash flow
-9.7%
Cash-on-Cash Return
4.1%
Cap rate
0.7%
Rent to Value Ratio
Active
$189,900
3
bds
|
1
ba
|
1,135
sqft
|
built
1924
412 Breens Ct SW, Grand Rapids, MI 49503
$-92
Cash flow
-2.5%
Cash-on-Cash Return
5.7%
Cap rate
0.8%
Rent to Value Ratio
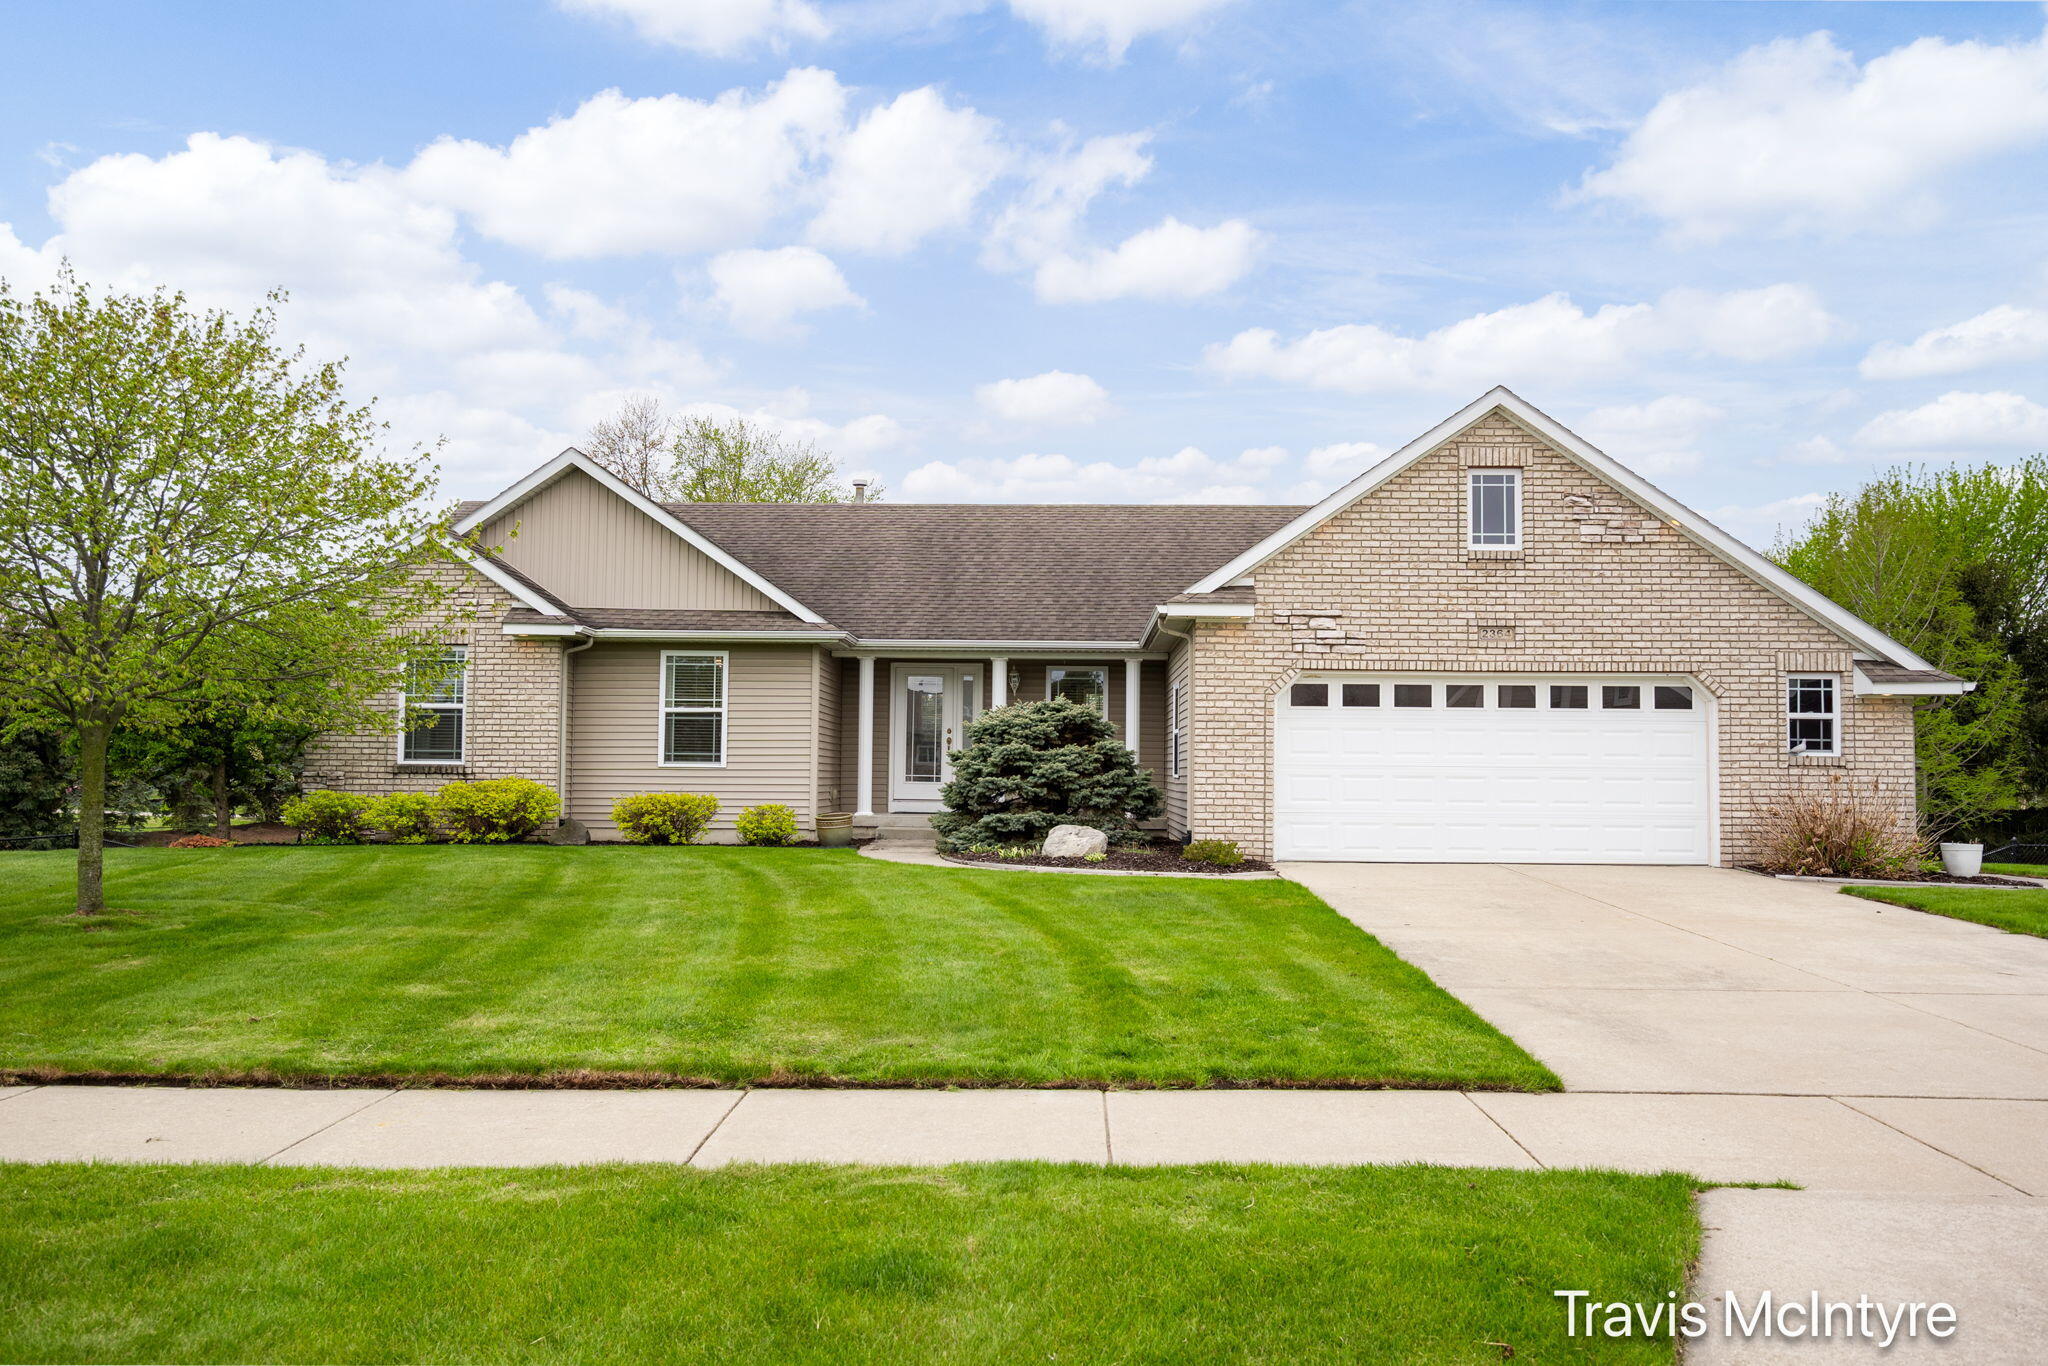
Pending
$514,900
4
bds
|
4
ba
|
2,775
sqft
|
built
2004
2364 Byron Shores Dr SW, Byron Center, MI 49315
$-1,125
Cash flow
-11.4%
Cash-on-Cash Return
3.7%
Cap rate
0.5%
Rent to Value Ratio
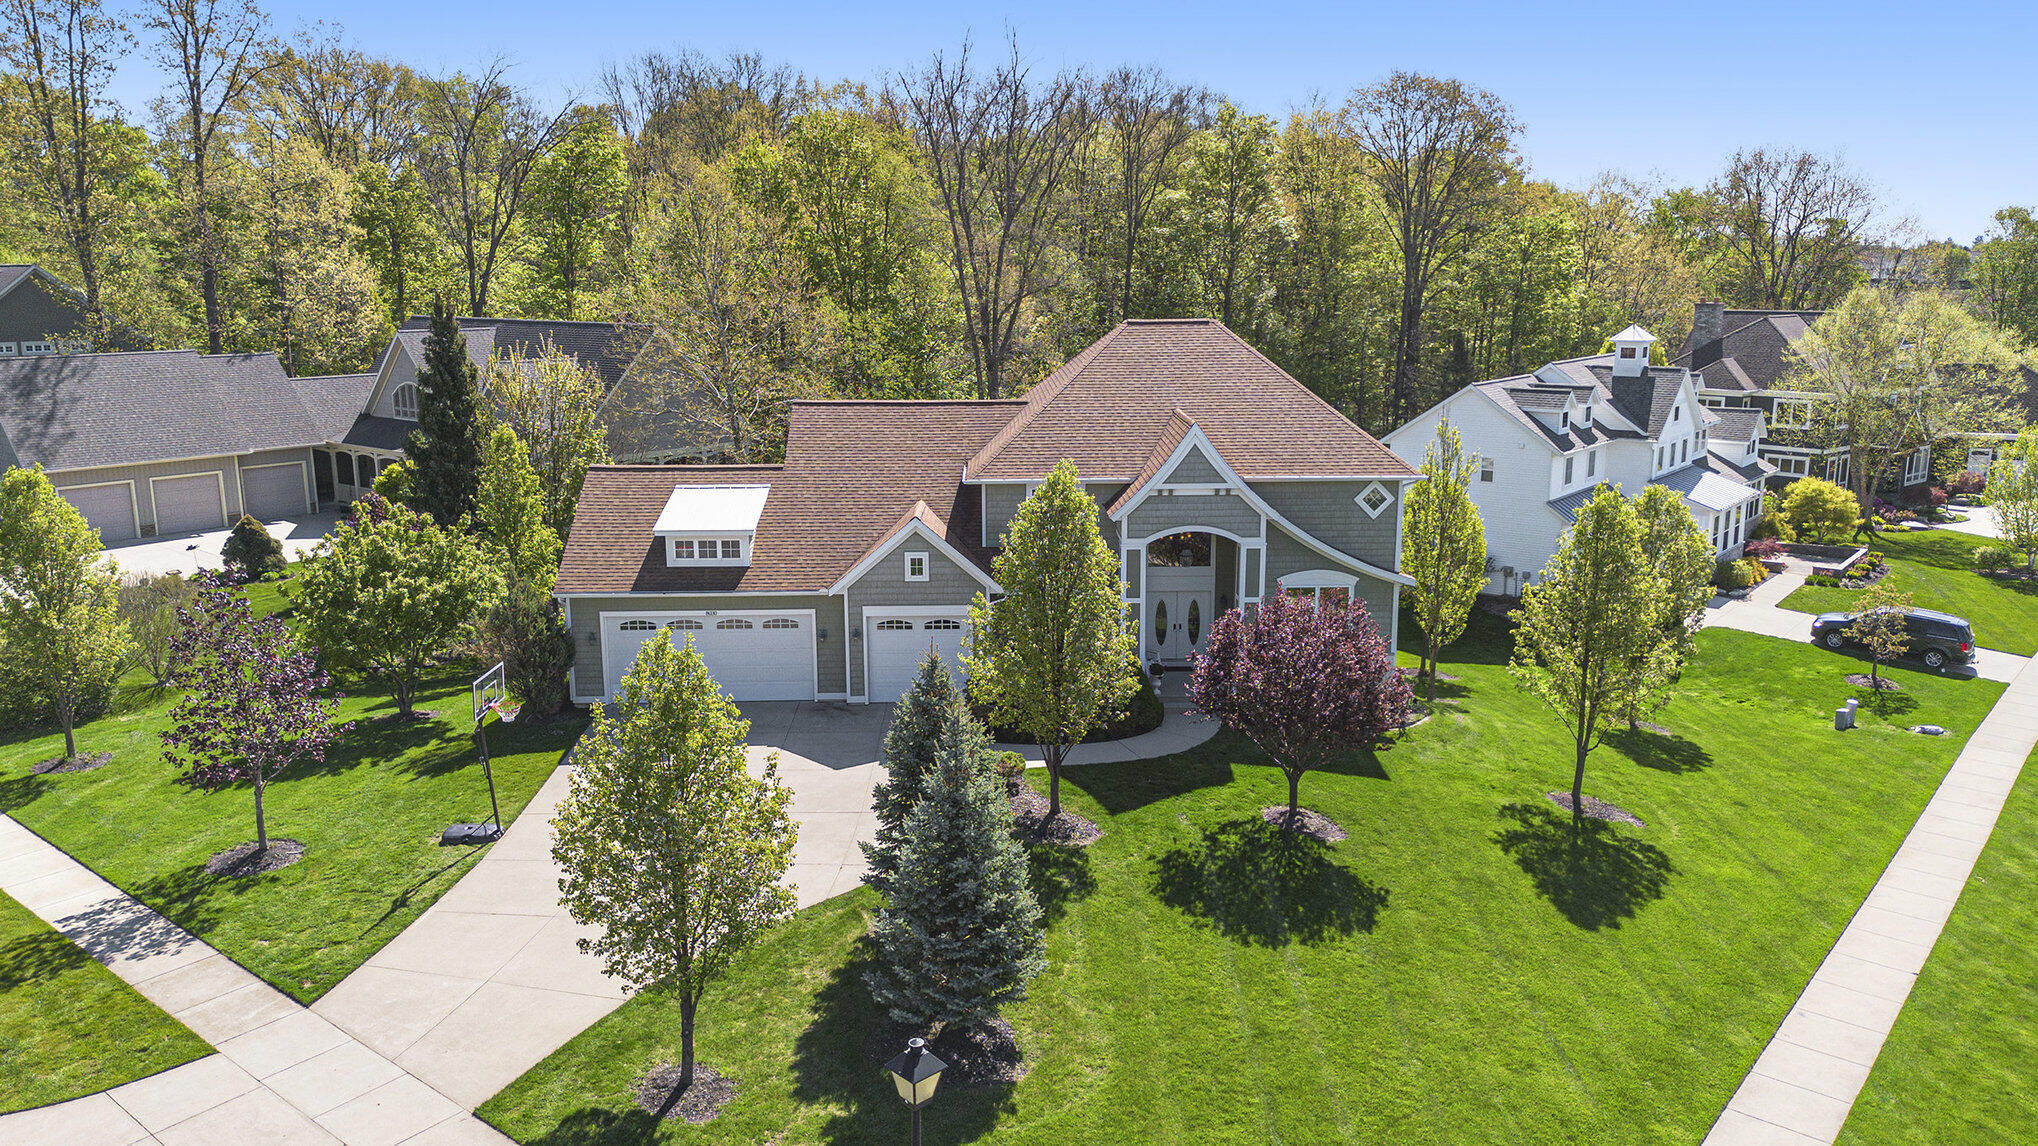
Active
$704,900
3
bds
|
3
ba
|
2,144
sqft
|
built
2018
631 Greenslate Dr SE, Ada, MI 49301
$-2,813
Cash flow
-20.8%
Cash-on-Cash Return
1.5%
Cap rate
0.4%
Rent to Value Ratio
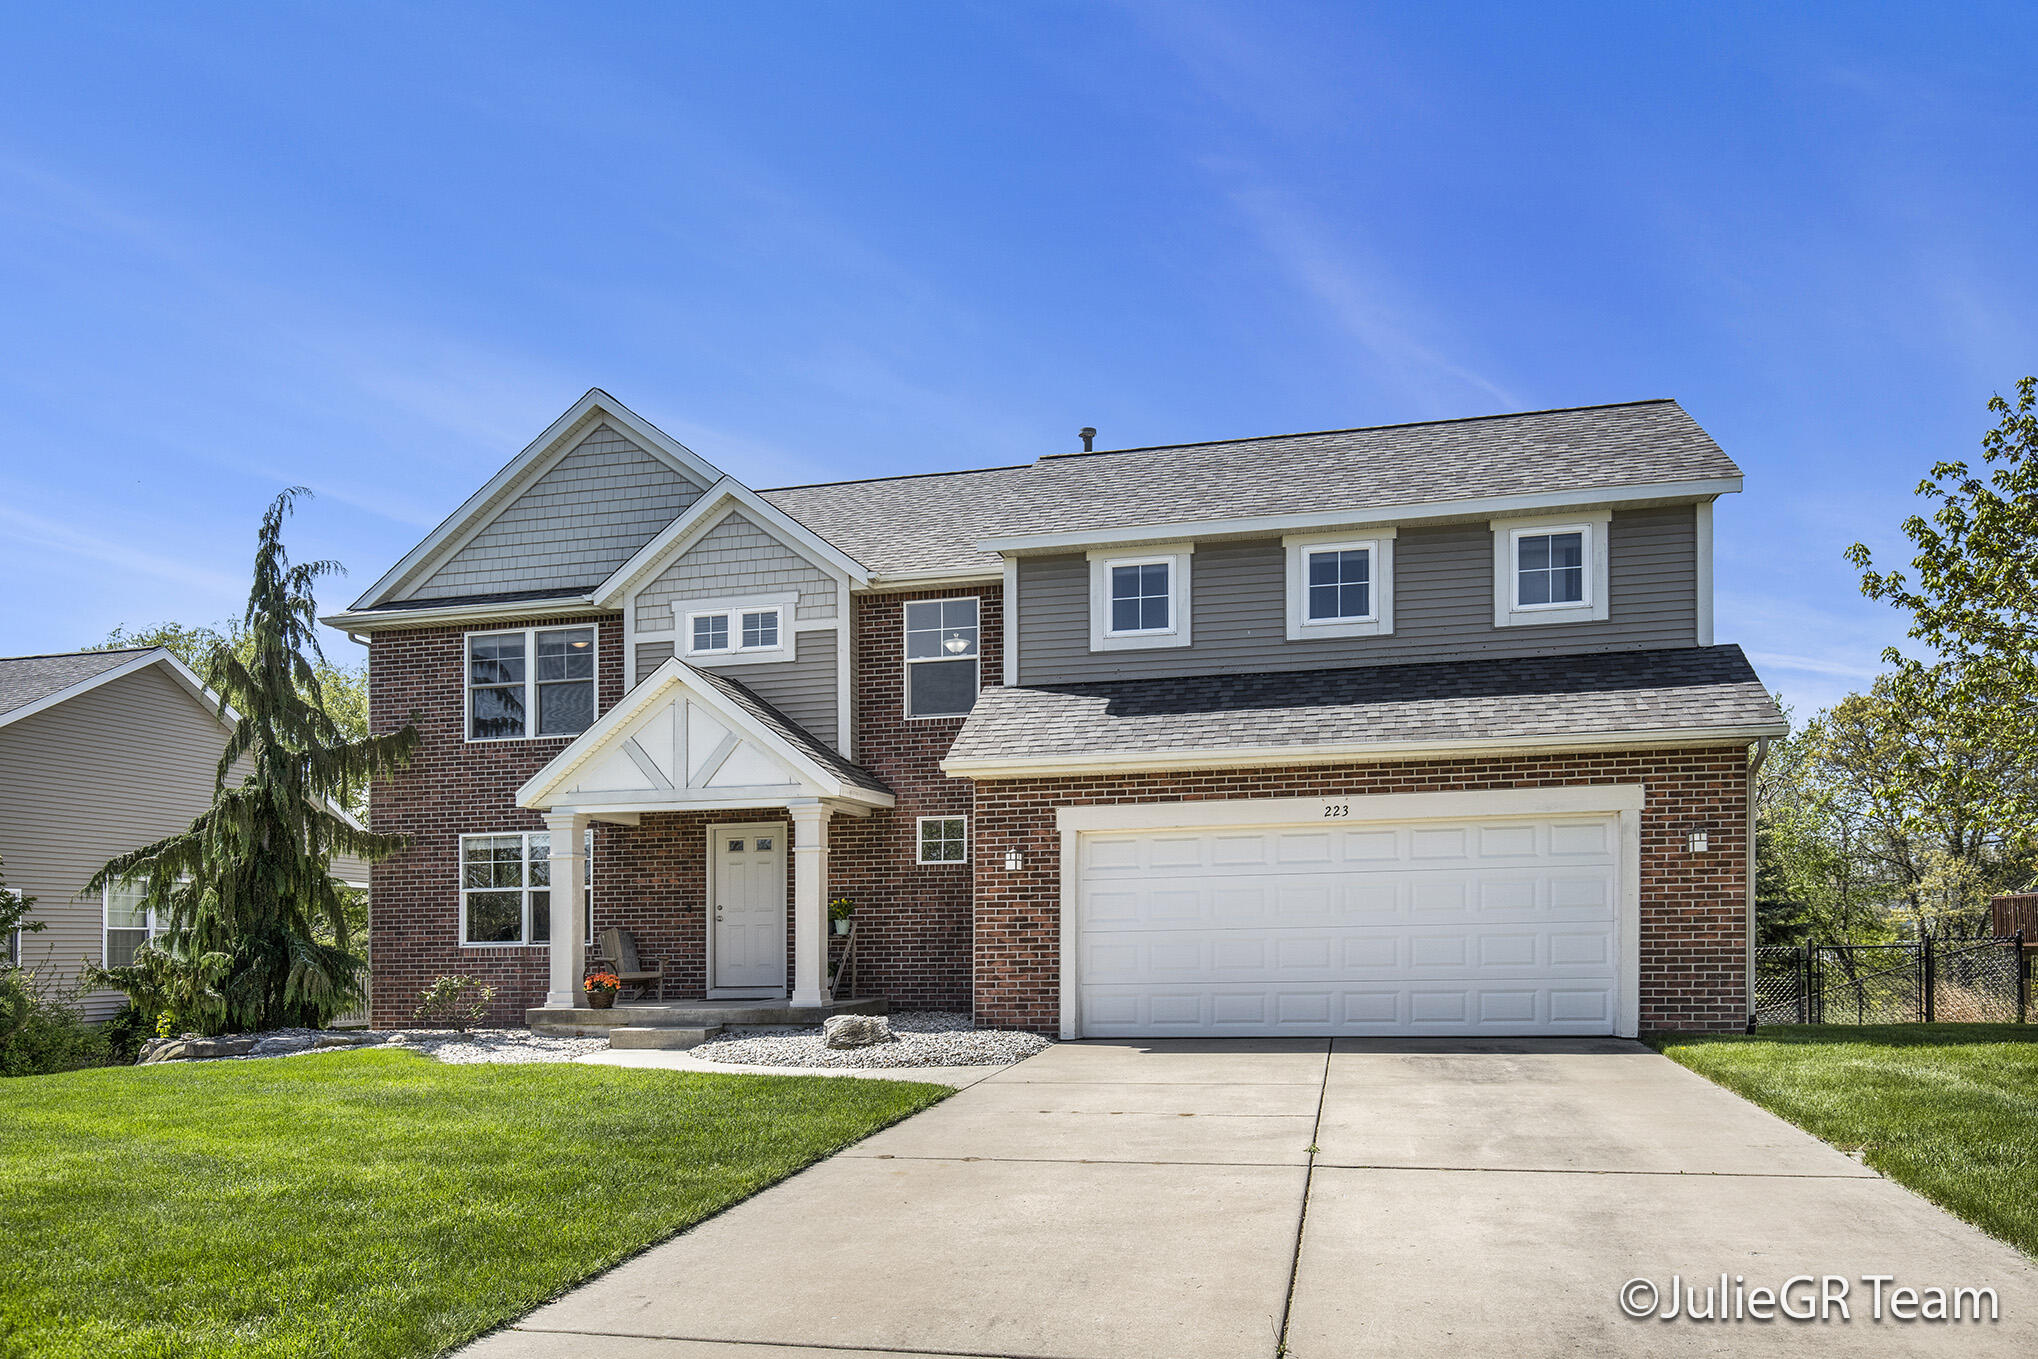
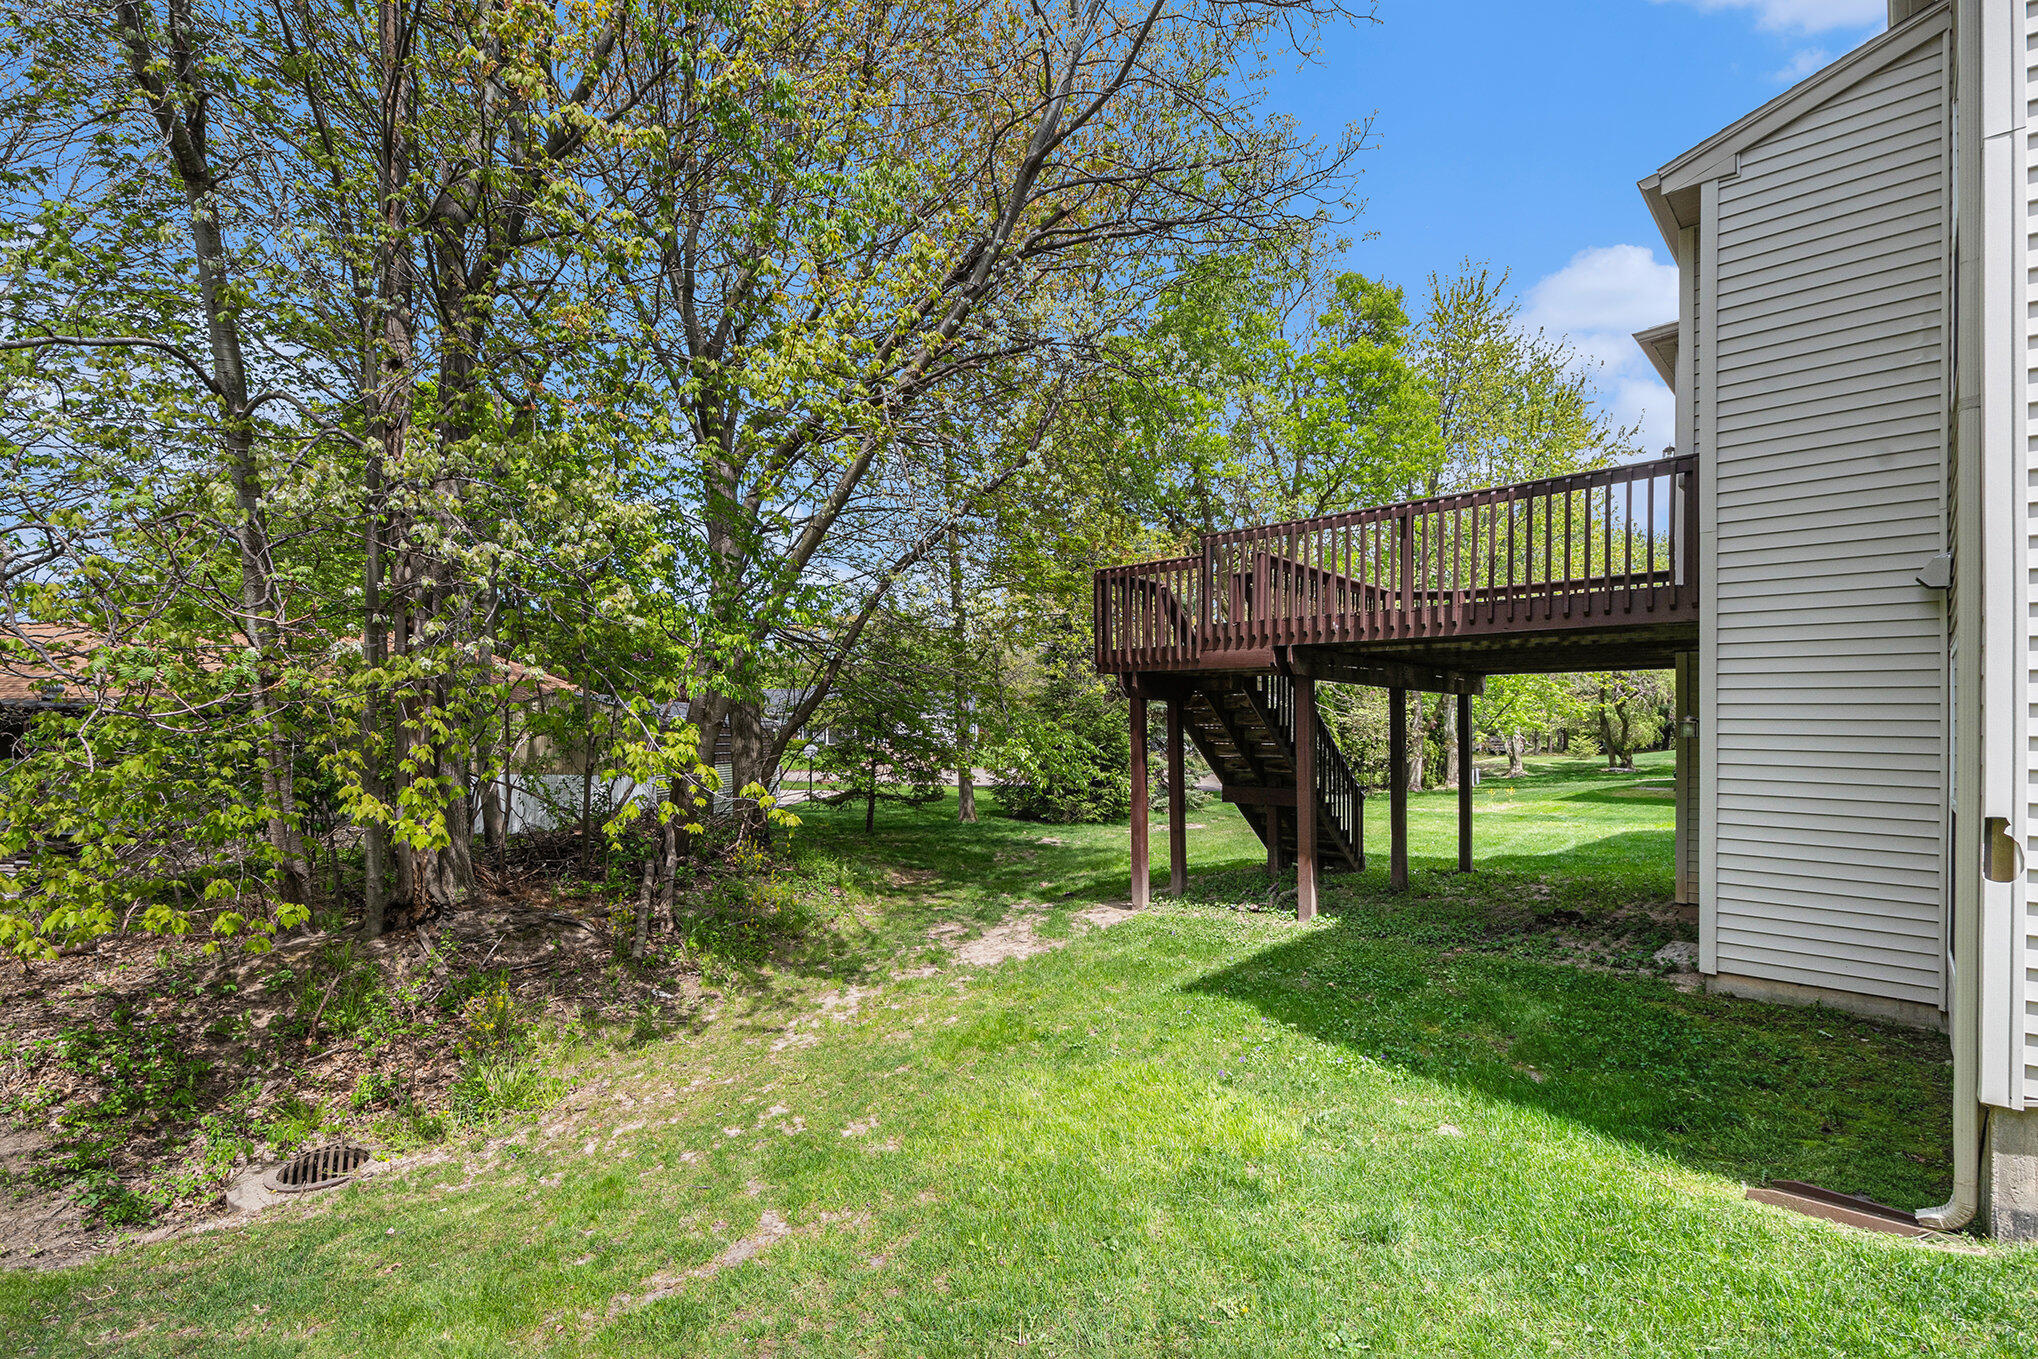
Active
$499,900
4
bds
|
4
ba
|
3,056
sqft
|
built
2005
223 Highlander Dr NE, Rockford, MI 49341
$-1,152
Cash flow
-12.0%
Cash-on-Cash Return
3.5%
Cap rate
0.6%
Rent to Value Ratio
Active
$609,000
4
bds
|
3
ba
|
2,555
sqft
|
built
2005
2570 Black Horse Ct NE, Grand Rapids, MI 49505
$-1,461
Cash flow
-12.5%
Cash-on-Cash Return
3.4%
Cap rate
0.5%
Rent to Value Ratio
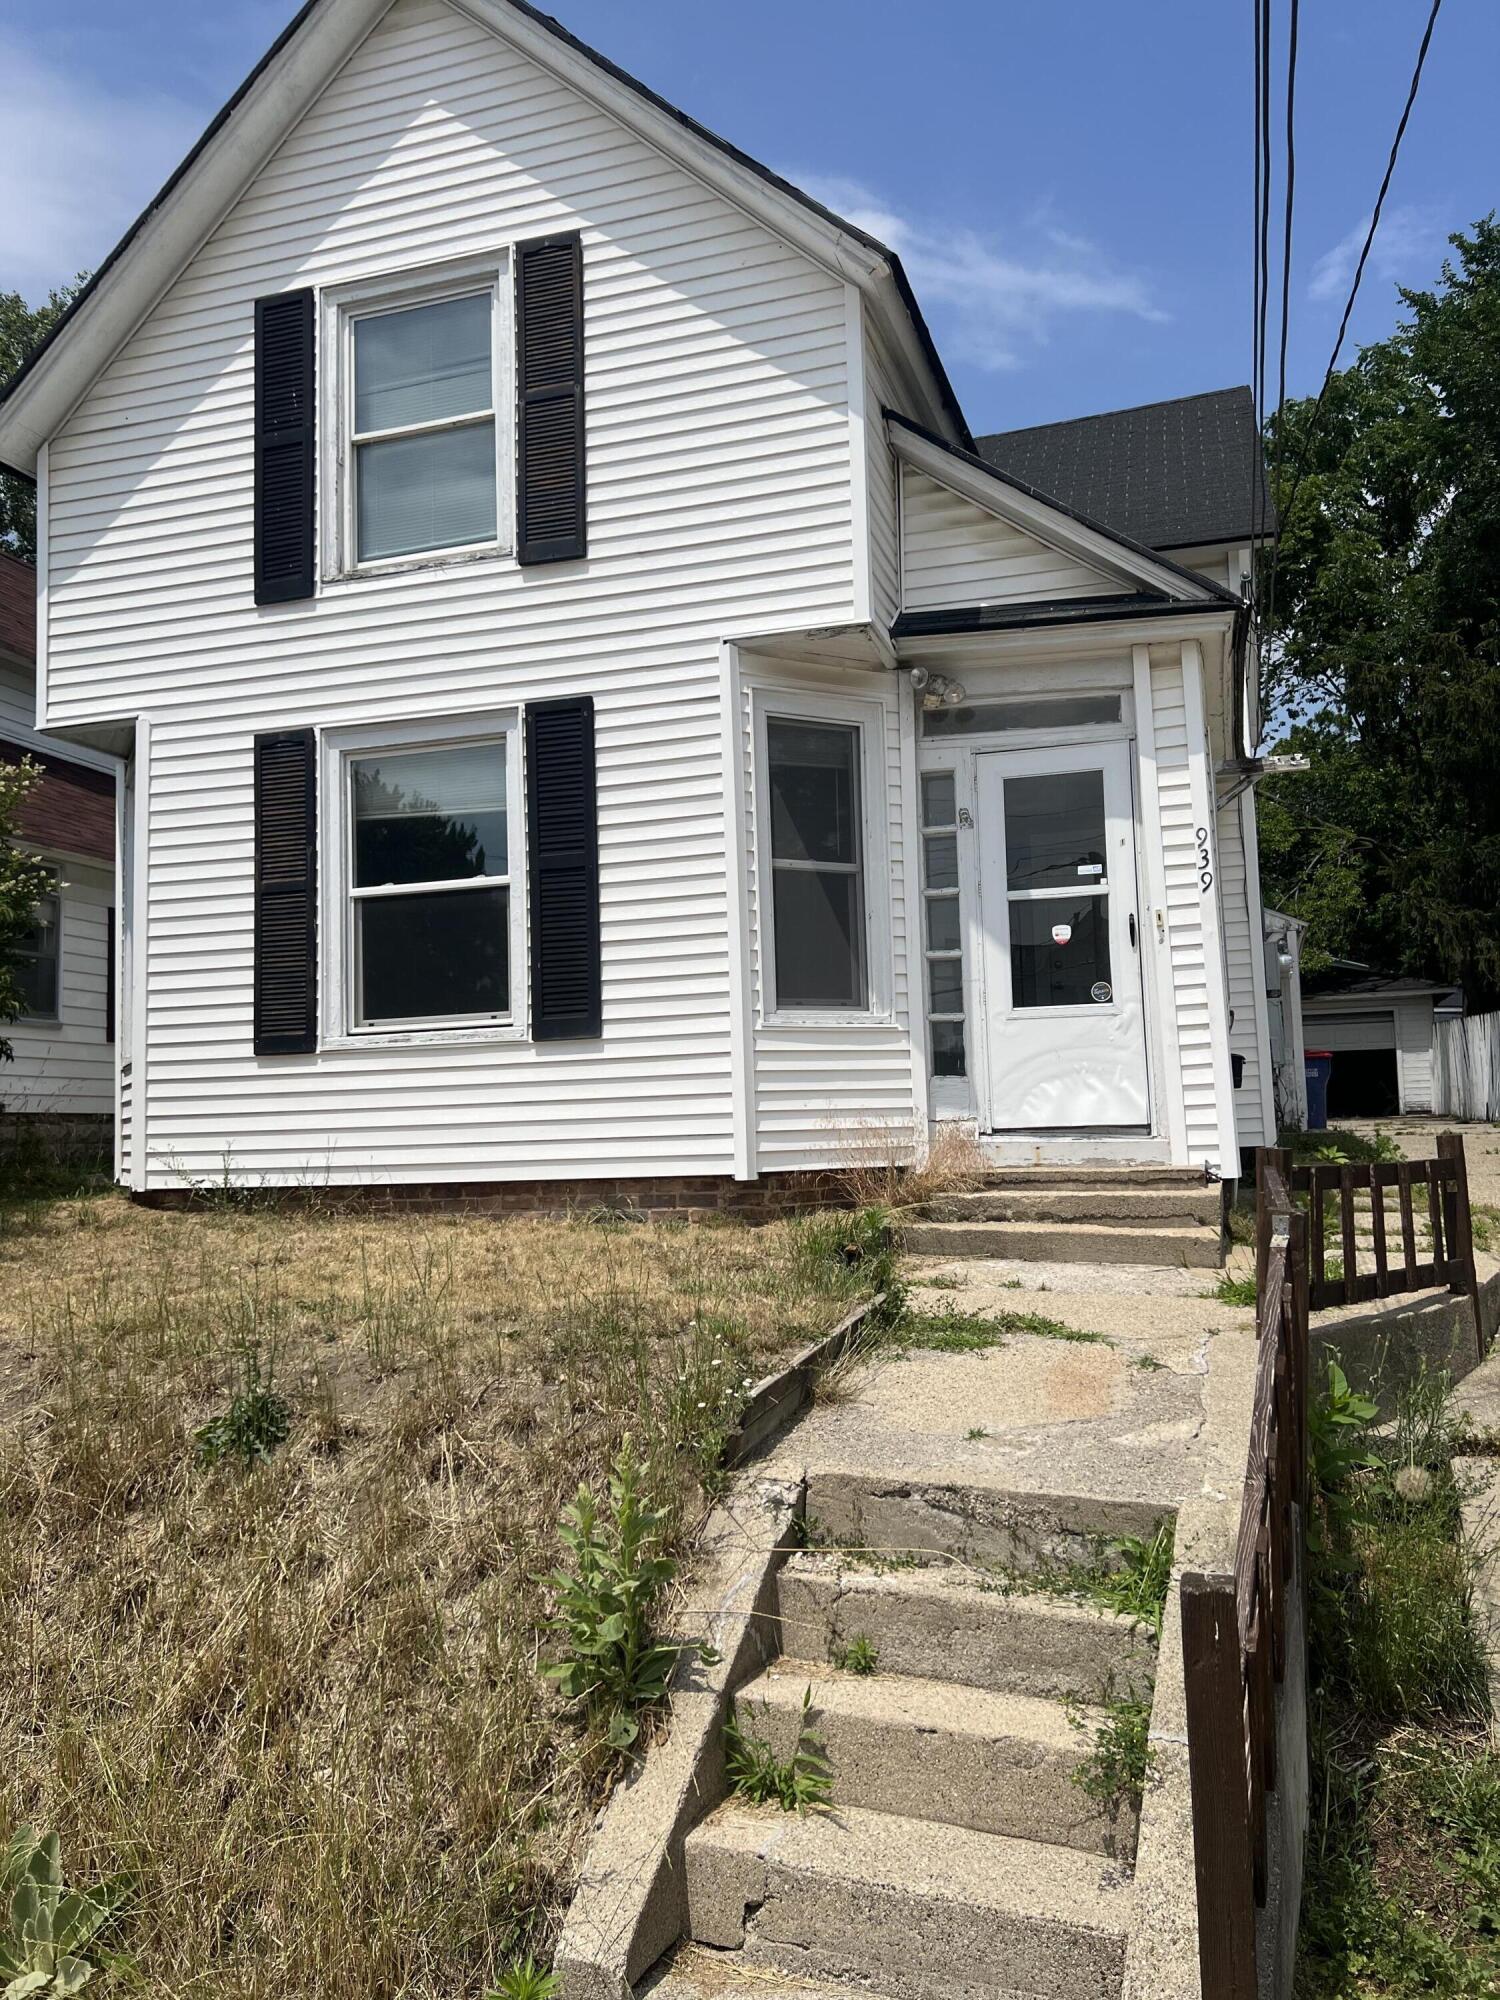
Active
$279,000
bds
|
0
ba
|
0
sqft
|
built
1890
939 Baraga St NE, Grand Rapids, MI 49503
$-576
Cash flow
-10.8%
Cash-on-Cash Return
3.8%
Cap rate
0.6%
Rent to Value Ratio
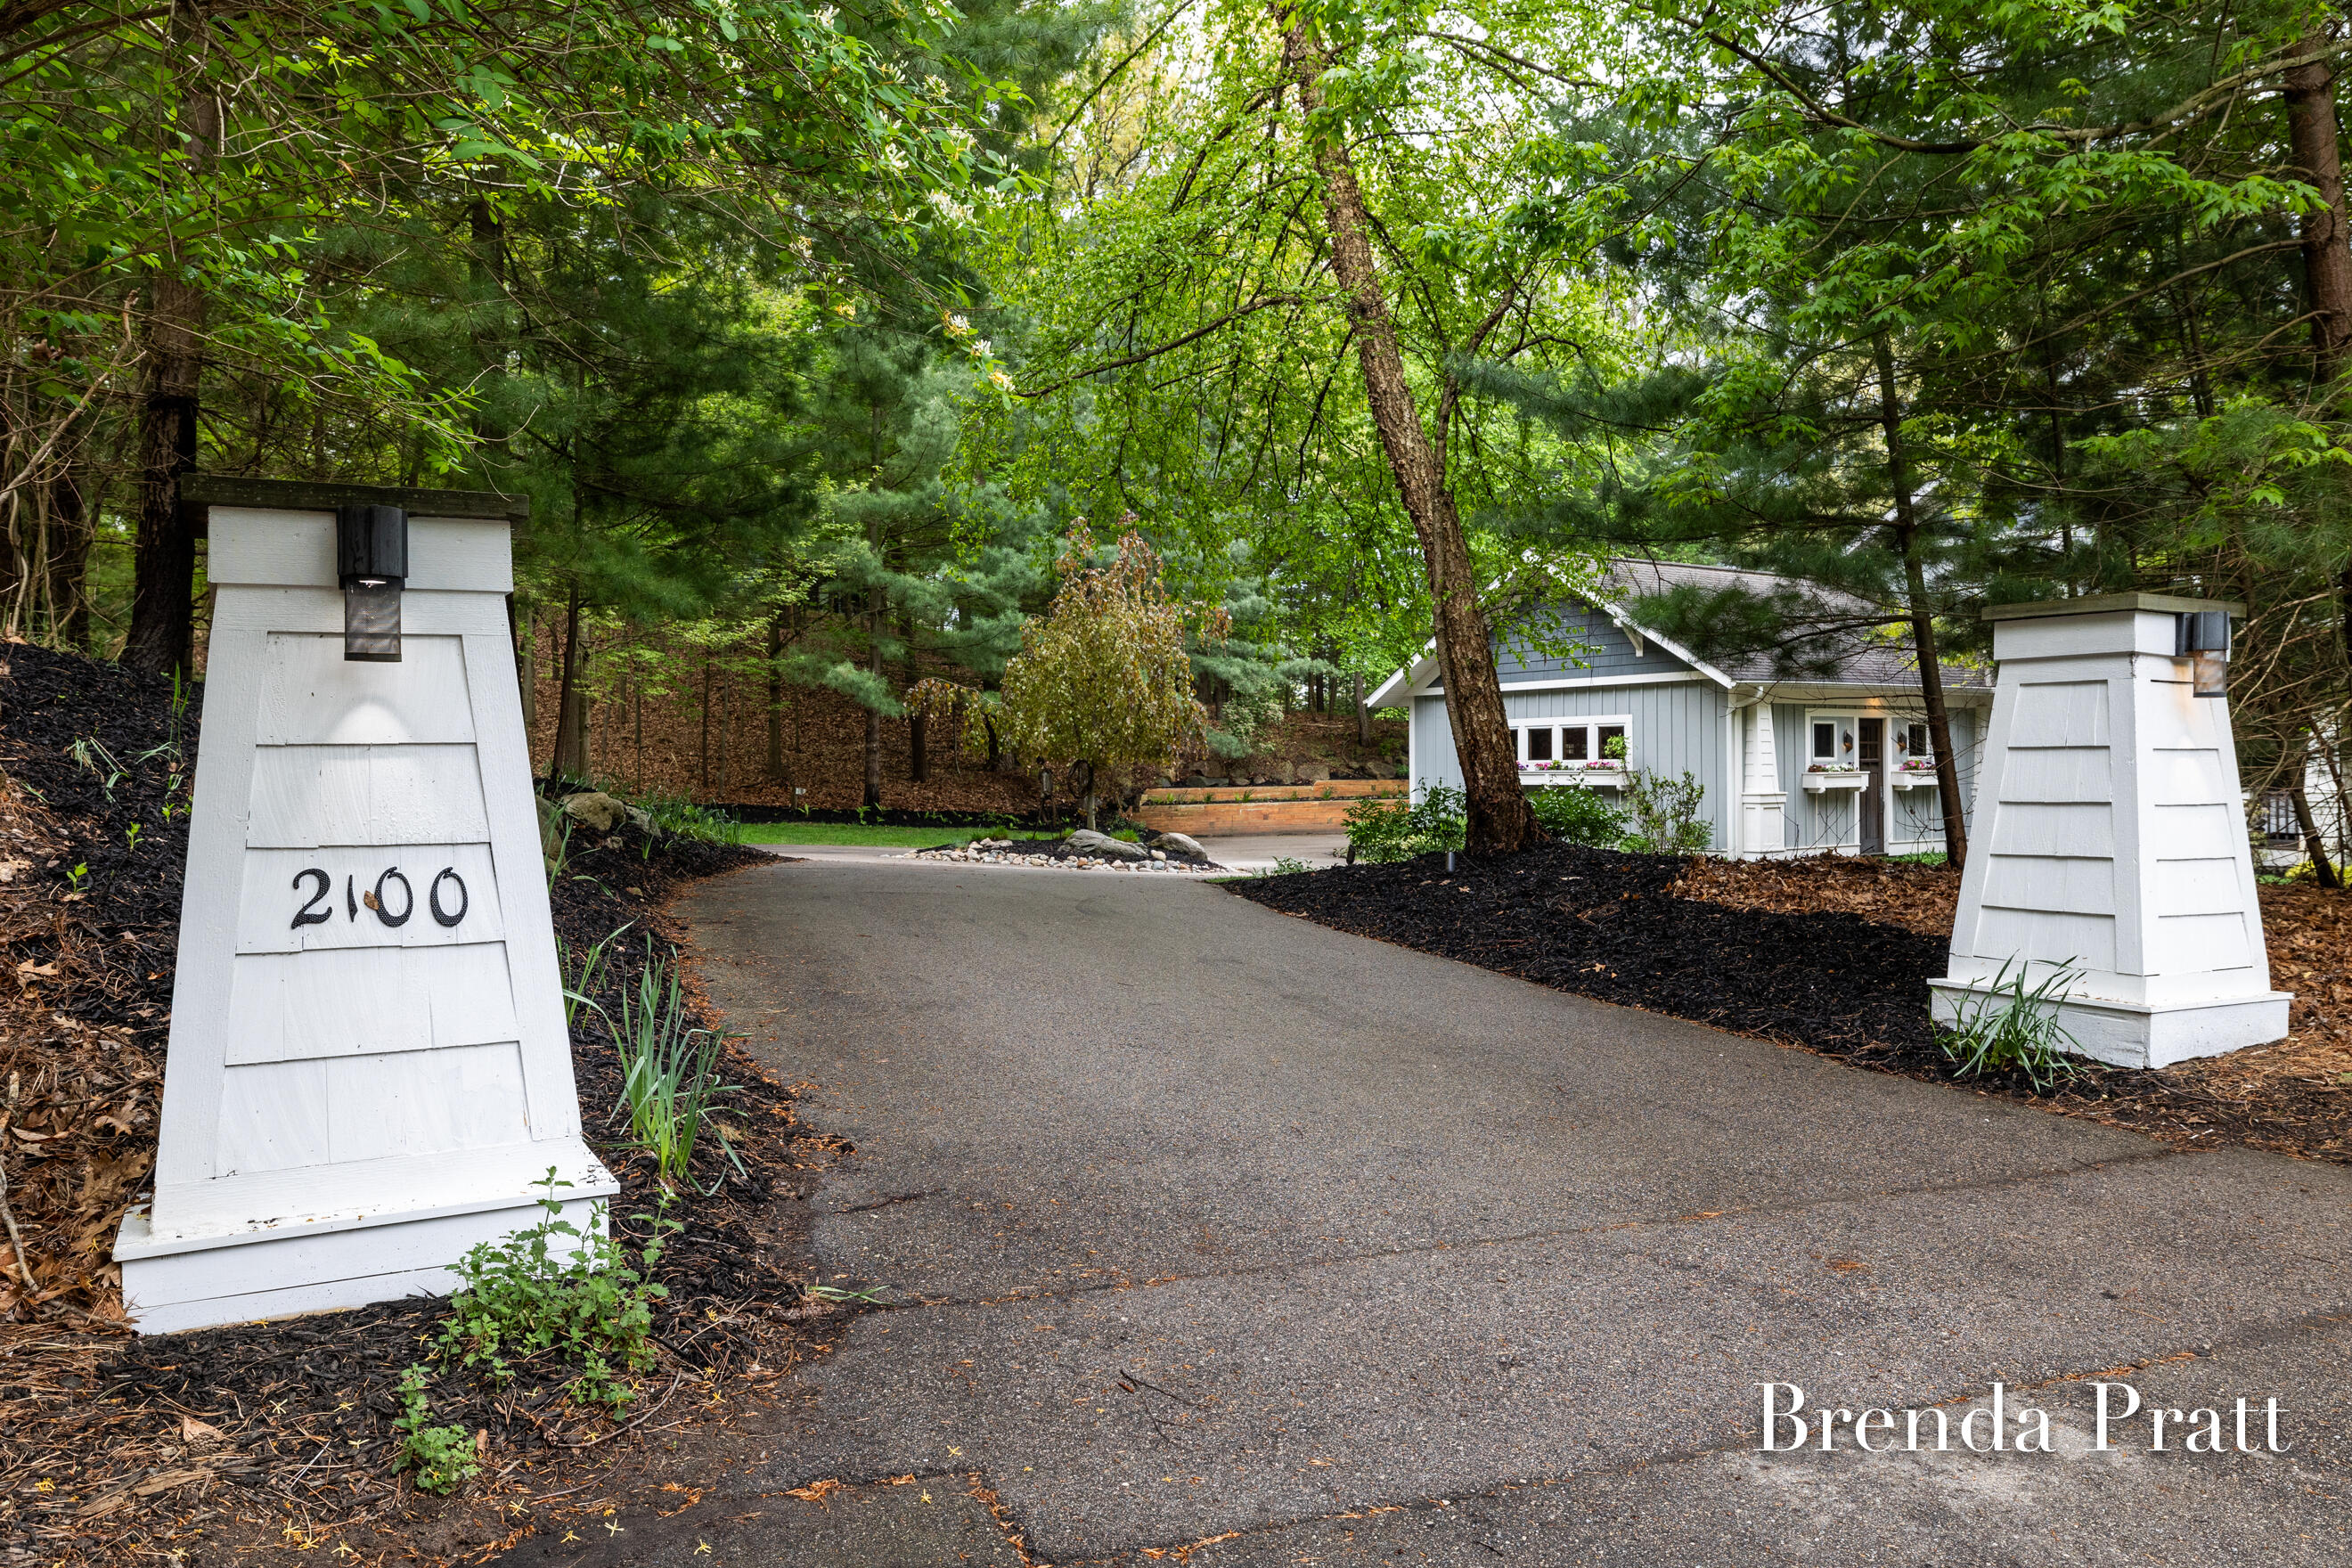
Active
$1,398,000
5
bds
|
4
ba
|
3,626
sqft
|
built
2002
2100 Timber Point Dr SE, Ada, MI 49301
$-5,314
Cash flow
-19.8%
Cash-on-Cash Return
1.7%
Cap rate
0.3%
Rent to Value Ratio
Active
$229,900
3
bds
|
2
ba
|
1,578
sqft
|
built
1937
1334 Fuller Ave SE, Grand Rapids, MI 49506
$76
Cash flow
1.7%
Cash-on-Cash Return
6.7%
Cap rate
0.9%
Rent to Value Ratio
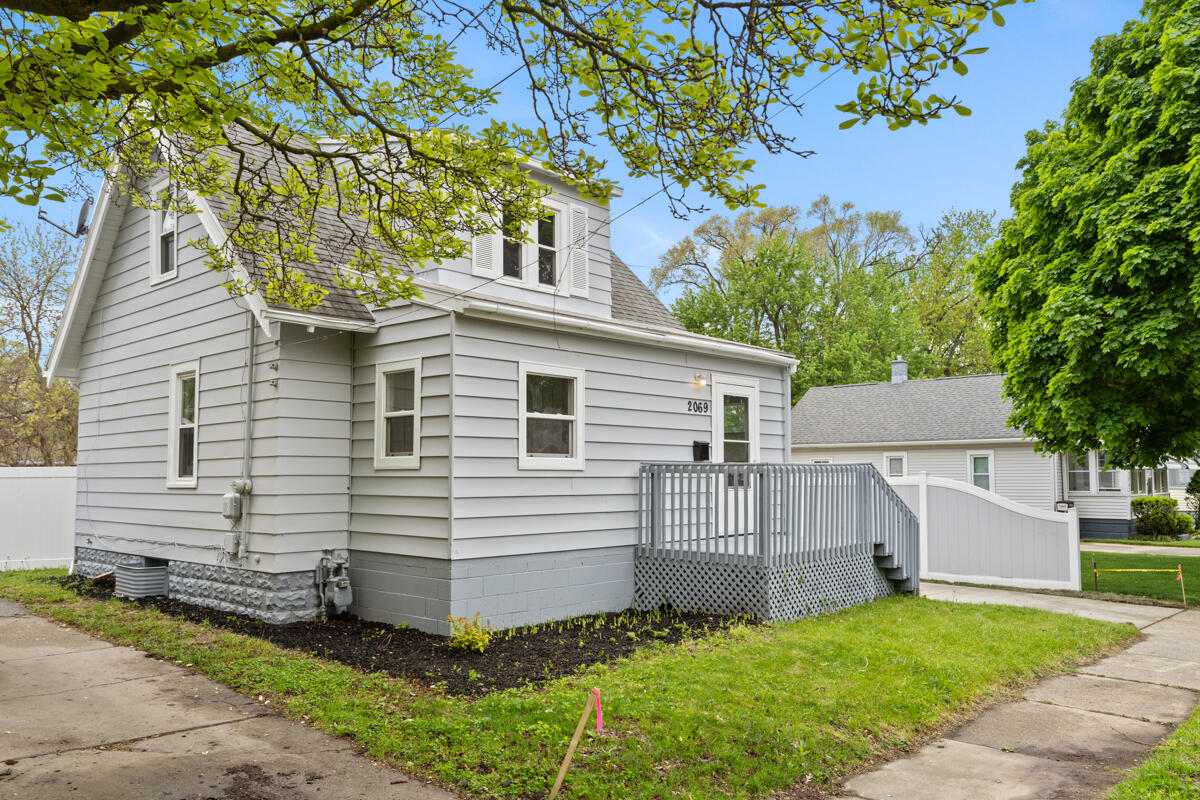
Active
$225,000
2
bds
|
1
ba
|
992
sqft
|
built
1930
2069 Michael Ave SW, Wyoming, MI 49509
$-265
Cash flow
-6.1%
Cash-on-Cash Return
4.9%
Cap rate
0.7%
Rent to Value Ratio
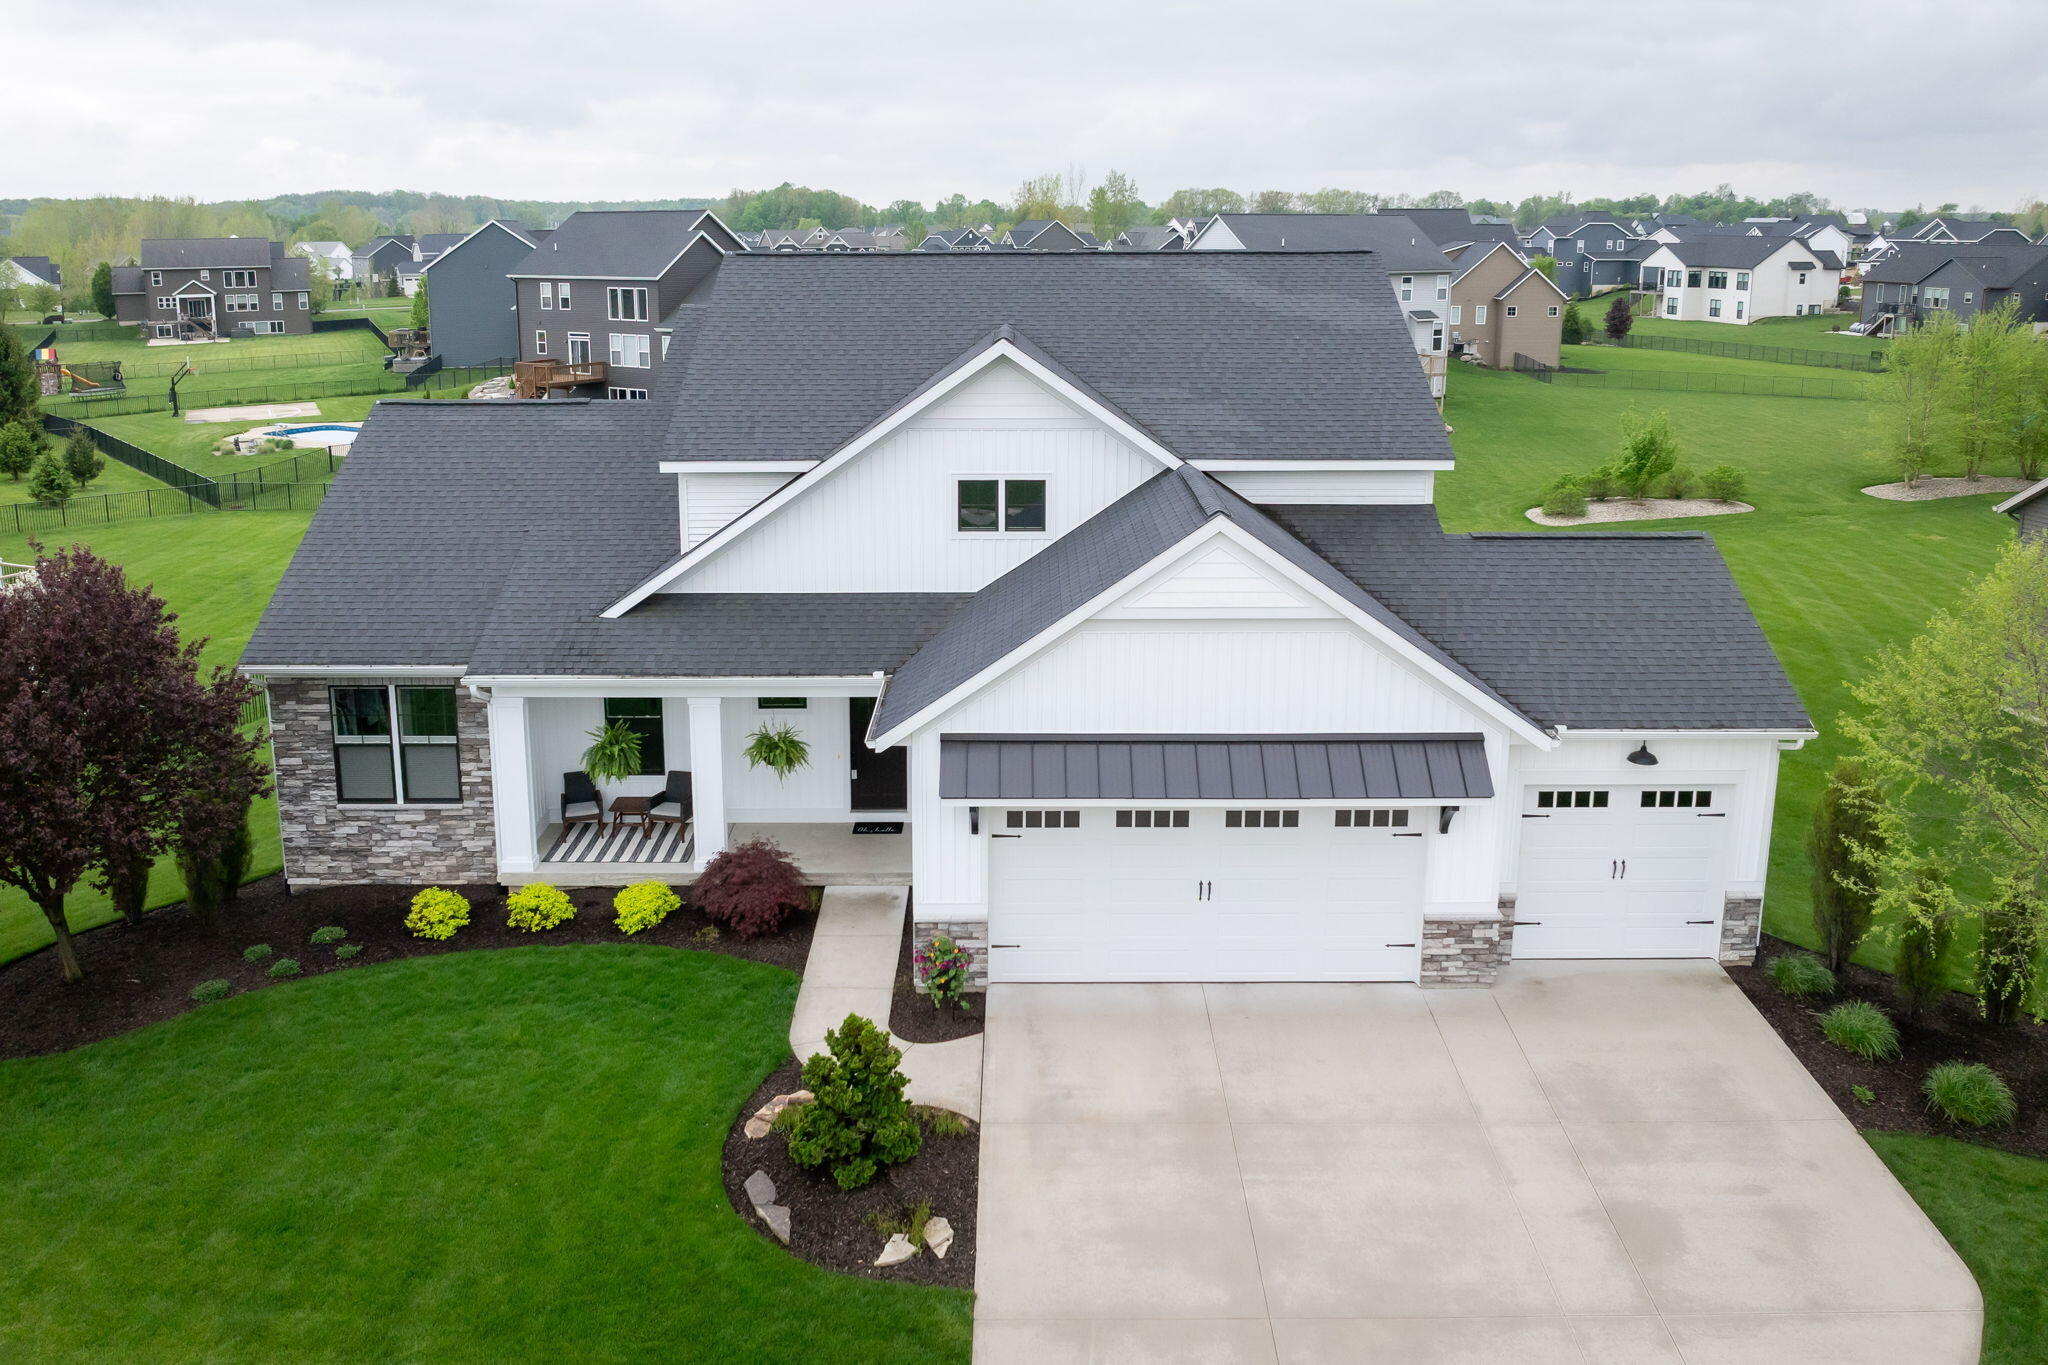
Active
$774,900
5
bds
|
4
ba
|
3,731
sqft
|
built
2016
3280 Amtrak Dr SW, Byron Center, MI 49315
$-2,404
Cash flow
-16.2%
Cash-on-Cash Return
2.6%
Cap rate
0.5%
Rent to Value Ratio
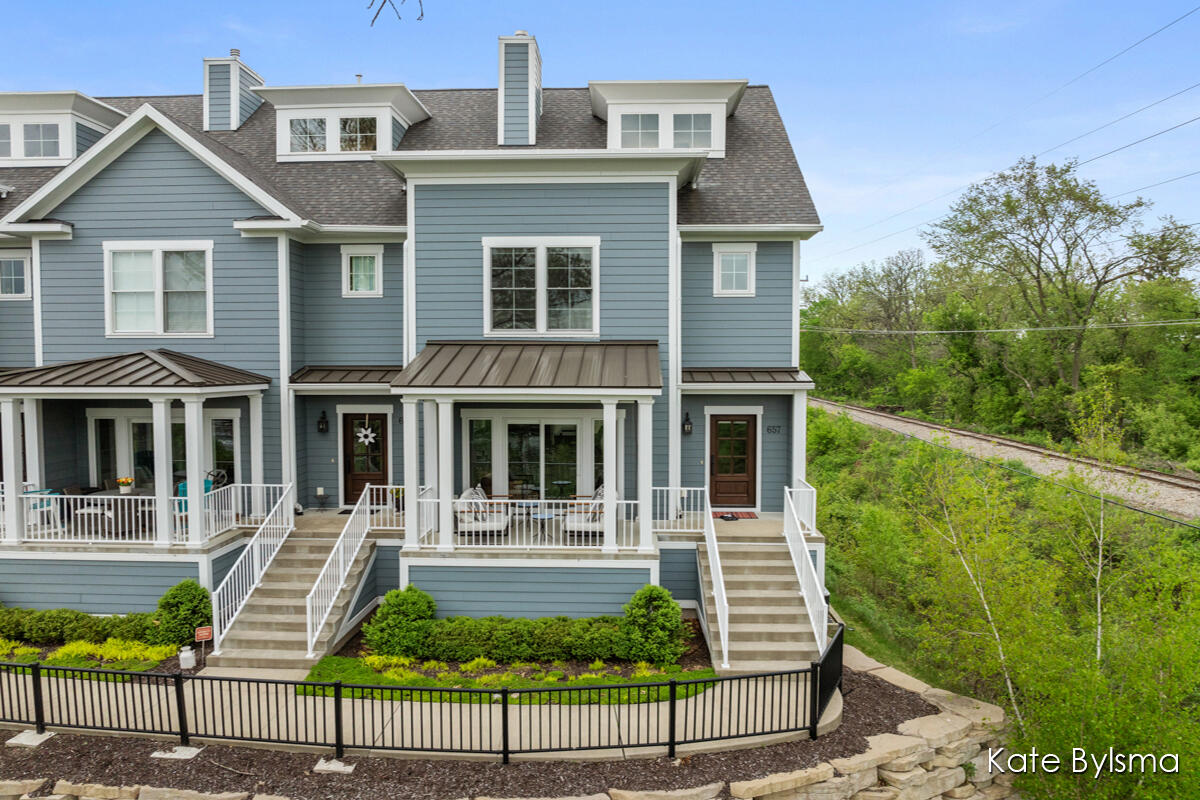
Active
$825,000
3
bds
|
3
ba
|
2,054
sqft
|
built
2017
657 Greenslate Dr SE, Ada, MI 49301
$-2,577
Cash flow
-16.3%
Cash-on-Cash Return
2.5%
Cap rate
0.5%
Rent to Value Ratio

Active
$949,900
5
bds
|
5
ba
|
3,405
sqft
|
built
2007
2429 Shears Crossing Ct NE, Grand Rapids, MI 49525
$-3,286
Cash flow
-18.0%
Cash-on-Cash Return
2.1%
Cap rate
0.4%
Rent to Value Ratio
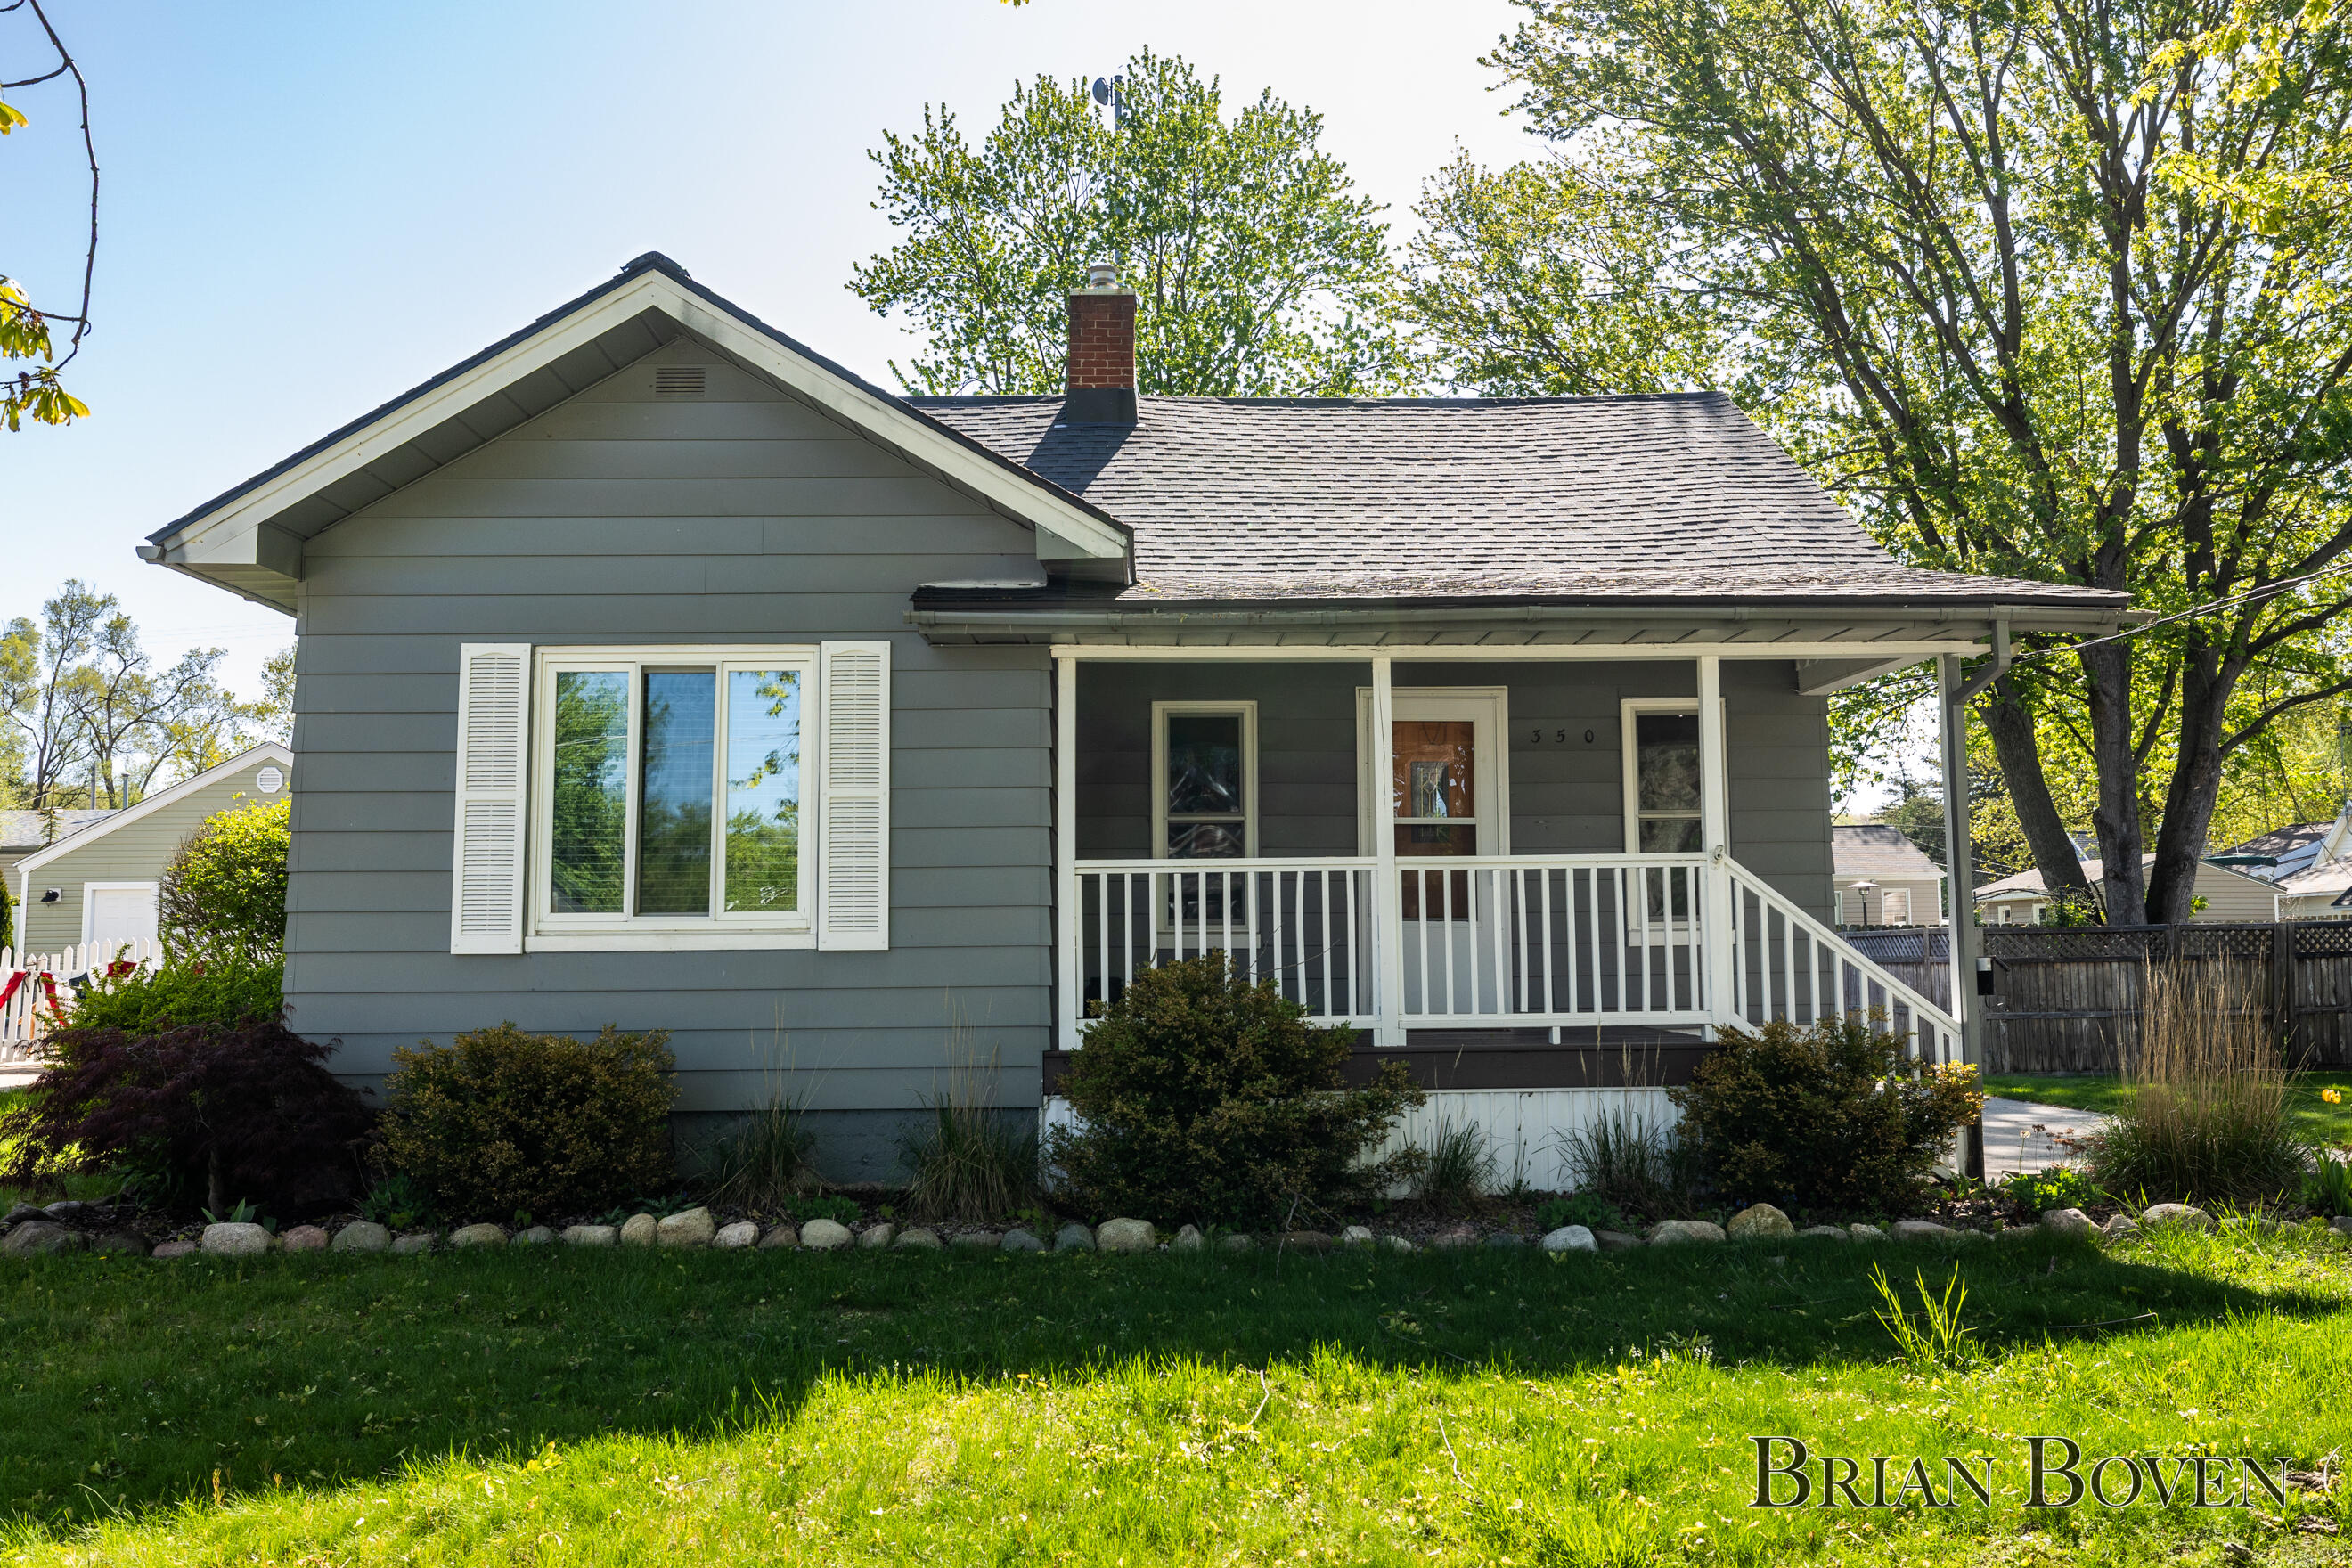
Active
$335,000
3
bds
|
2
ba
|
1,104
sqft
|
built
1927
350 Adolph St, Rockford, MI 49341
$-654
Cash flow
-10.2%
Cash-on-Cash Return
3.9%
Cap rate
0.7%
Rent to Value Ratio
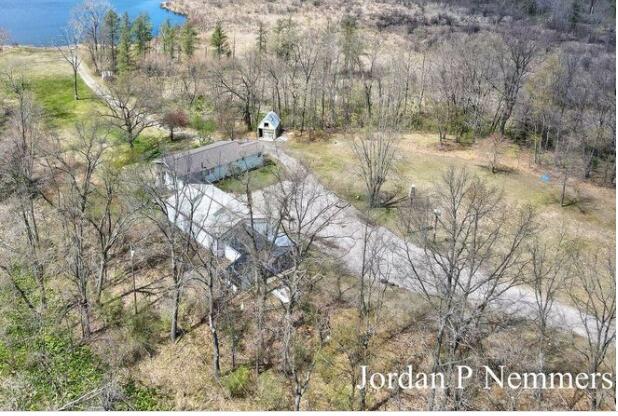
Active
$2,200,000
4
bds
|
2
ba
|
2,116
sqft
|
built
1970
12375 Overlook Dr NE, Greenville, MI 48838
$-10,304
Cash flow
-24.4%
Cash-on-Cash Return
0.7%
Cap rate
0.1%
Rent to Value Ratio
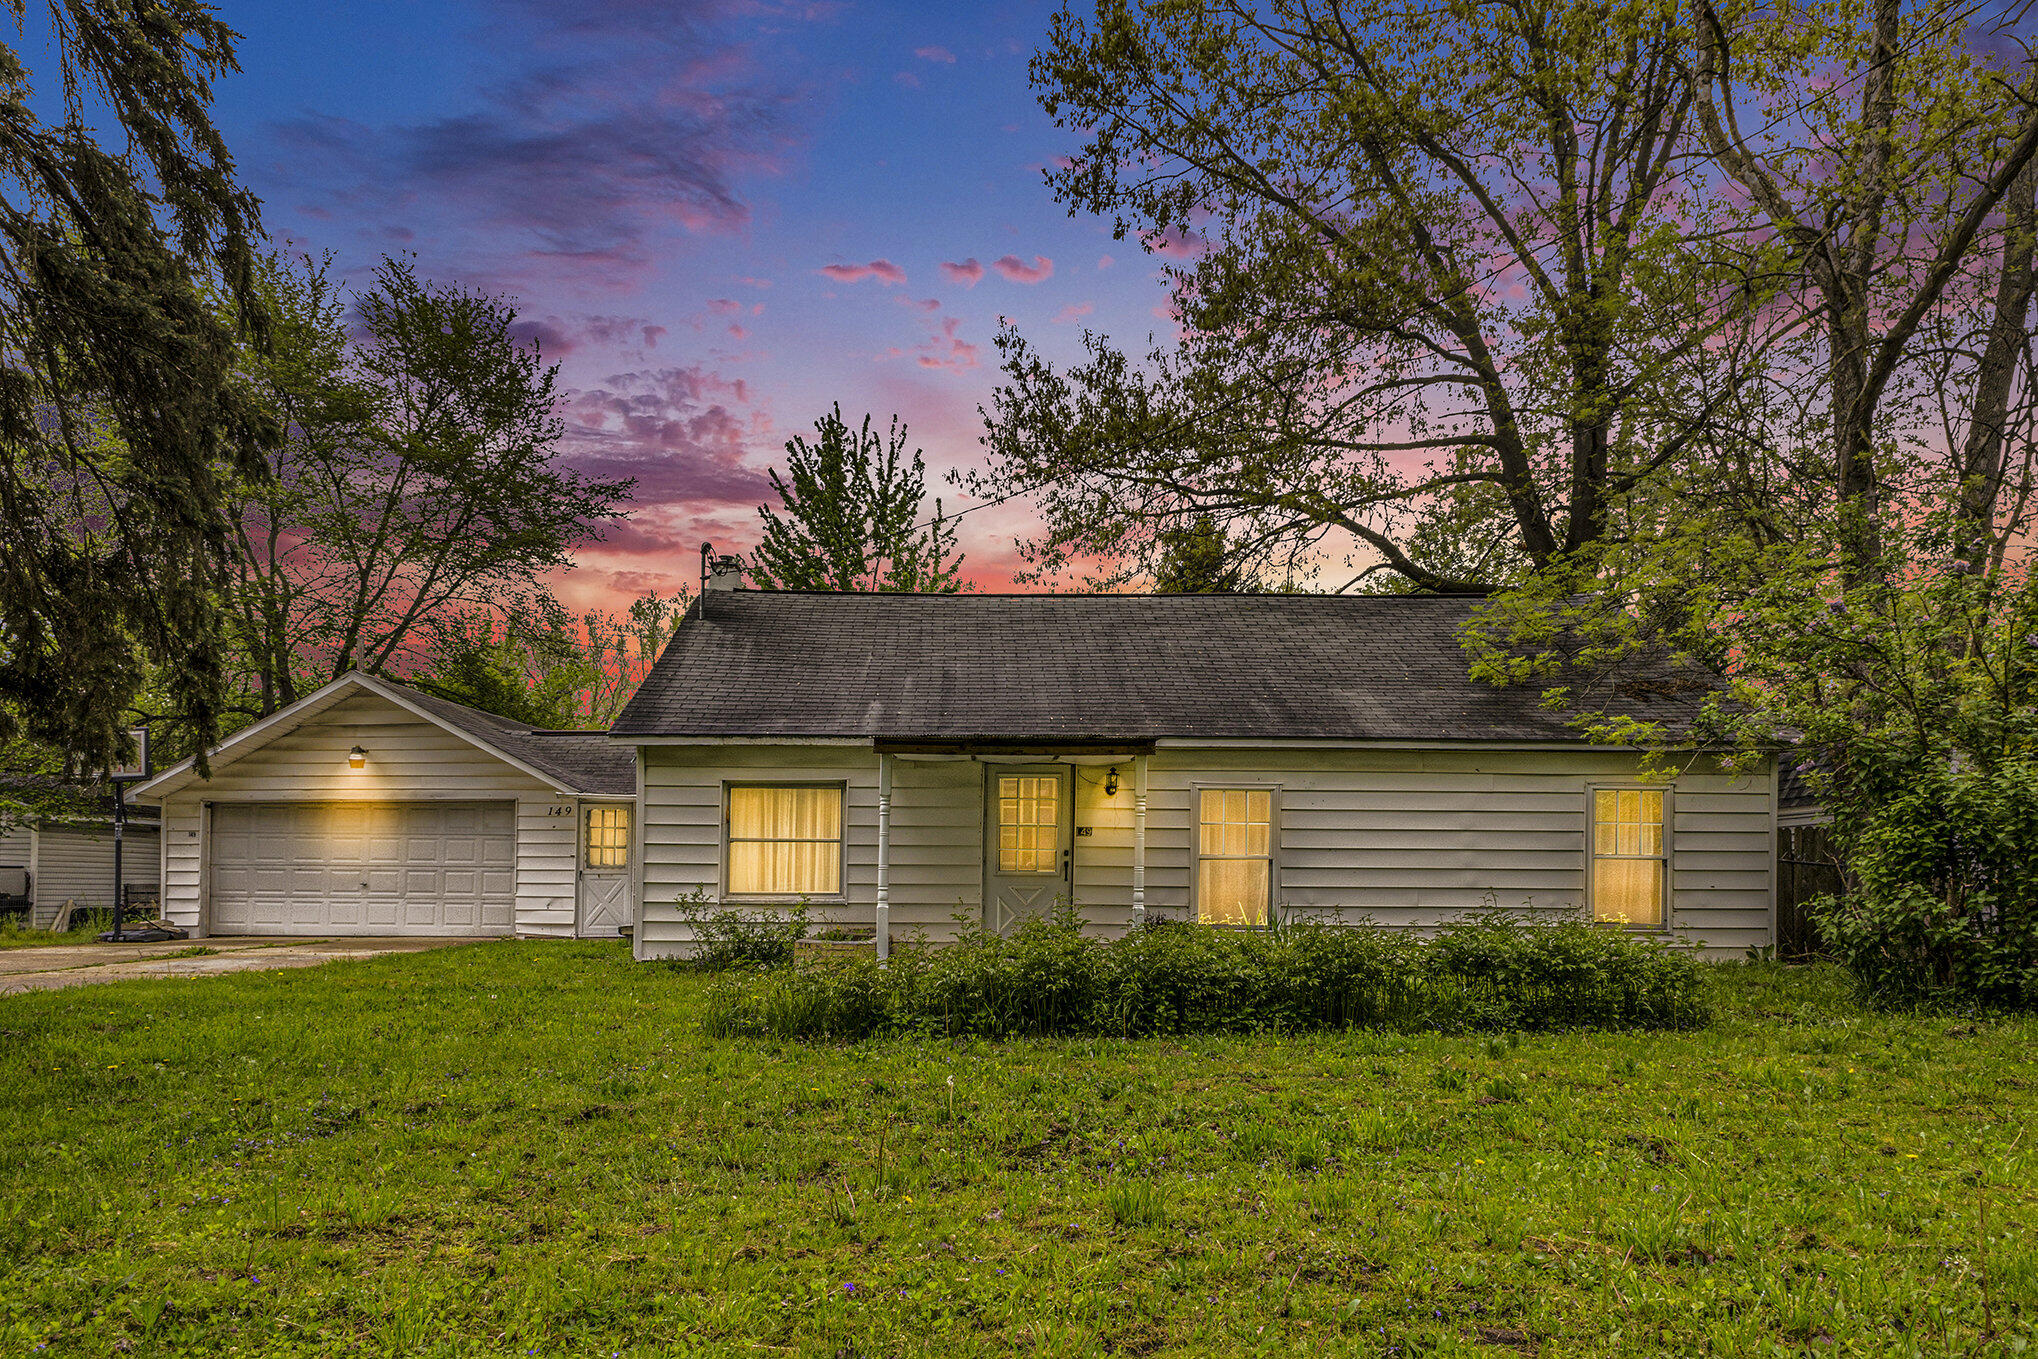
Active
$234,000
3
bds
|
1
ba
|
1,400
sqft
|
built
1936
149 Coleman St SE, Grand Rapids, MI 49548
$-317
Cash flow
-7.1%
Cash-on-Cash Return
4.7%
Cap rate
0.7%
Rent to Value Ratio
Active
$718,000
4
bds
|
3
ba
|
3,064
sqft
|
built
2023
4515 Harbor View Dr, Grand Rapids, MI 49512
$-1,708
Cash flow
-12.4%
Cash-on-Cash Return
3.4%
Cap rate
0.6%
Rent to Value Ratio
Active
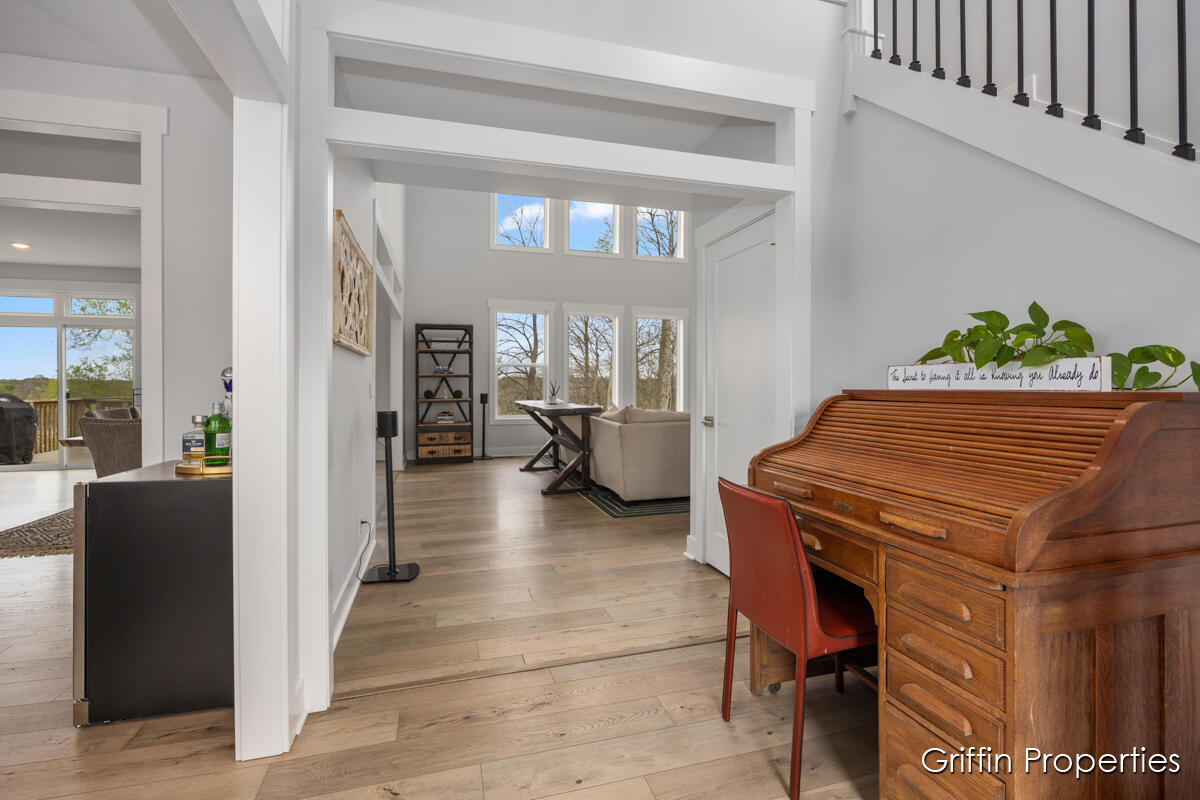
$295,000
bds
|
0
ba
|
0
sqft
|
built
1923
418 Griggs St SE, Grand Rapids, MI 49507
$-942
Cash flow
-16.7%
Cash-on-Cash Return
2.5%
Cap rate
0.5%
Rent to Value Ratio

Active
$340,000
2
bds
|
2
ba
|
1,848
sqft
|
built
1993
4289 Millpond Dr NE, Rockford, MI 49341
$-938
Cash flow
-14.4%
Cash-on-Cash Return
3.0%
Cap rate
0.6%
Rent to Value Ratio
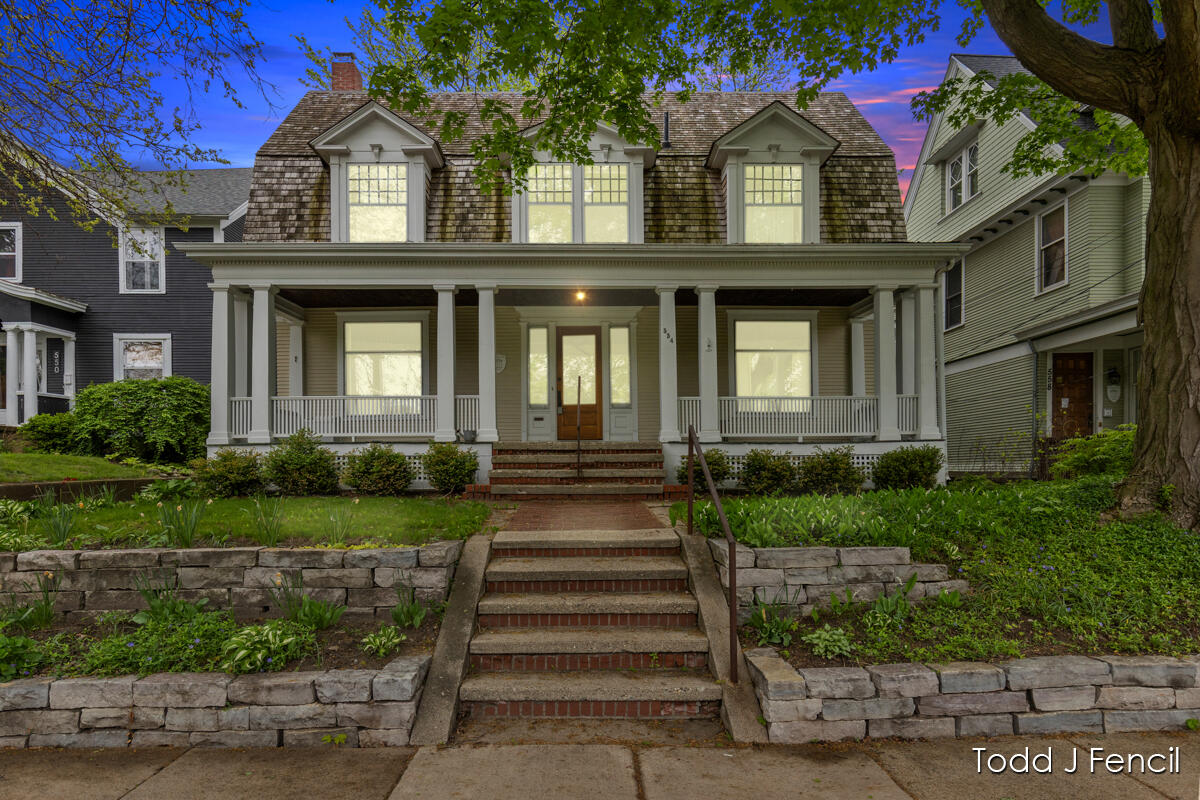
Active
$624,900
4
bds
|
3
ba
|
3,386
sqft
|
built
1905
554 Madison Ave SE, Grand Rapids, MI 49503
$-958
Cash flow
-8.0%
Cash-on-Cash Return
4.4%
Cap rate
0.7%
Rent to Value Ratio