Kent County Investment Properties for Sale
Browse homes for sale and investment properties in Kent County. Refine your search by price, property type, or more.
Best cash flowing properties in Kent County
Active
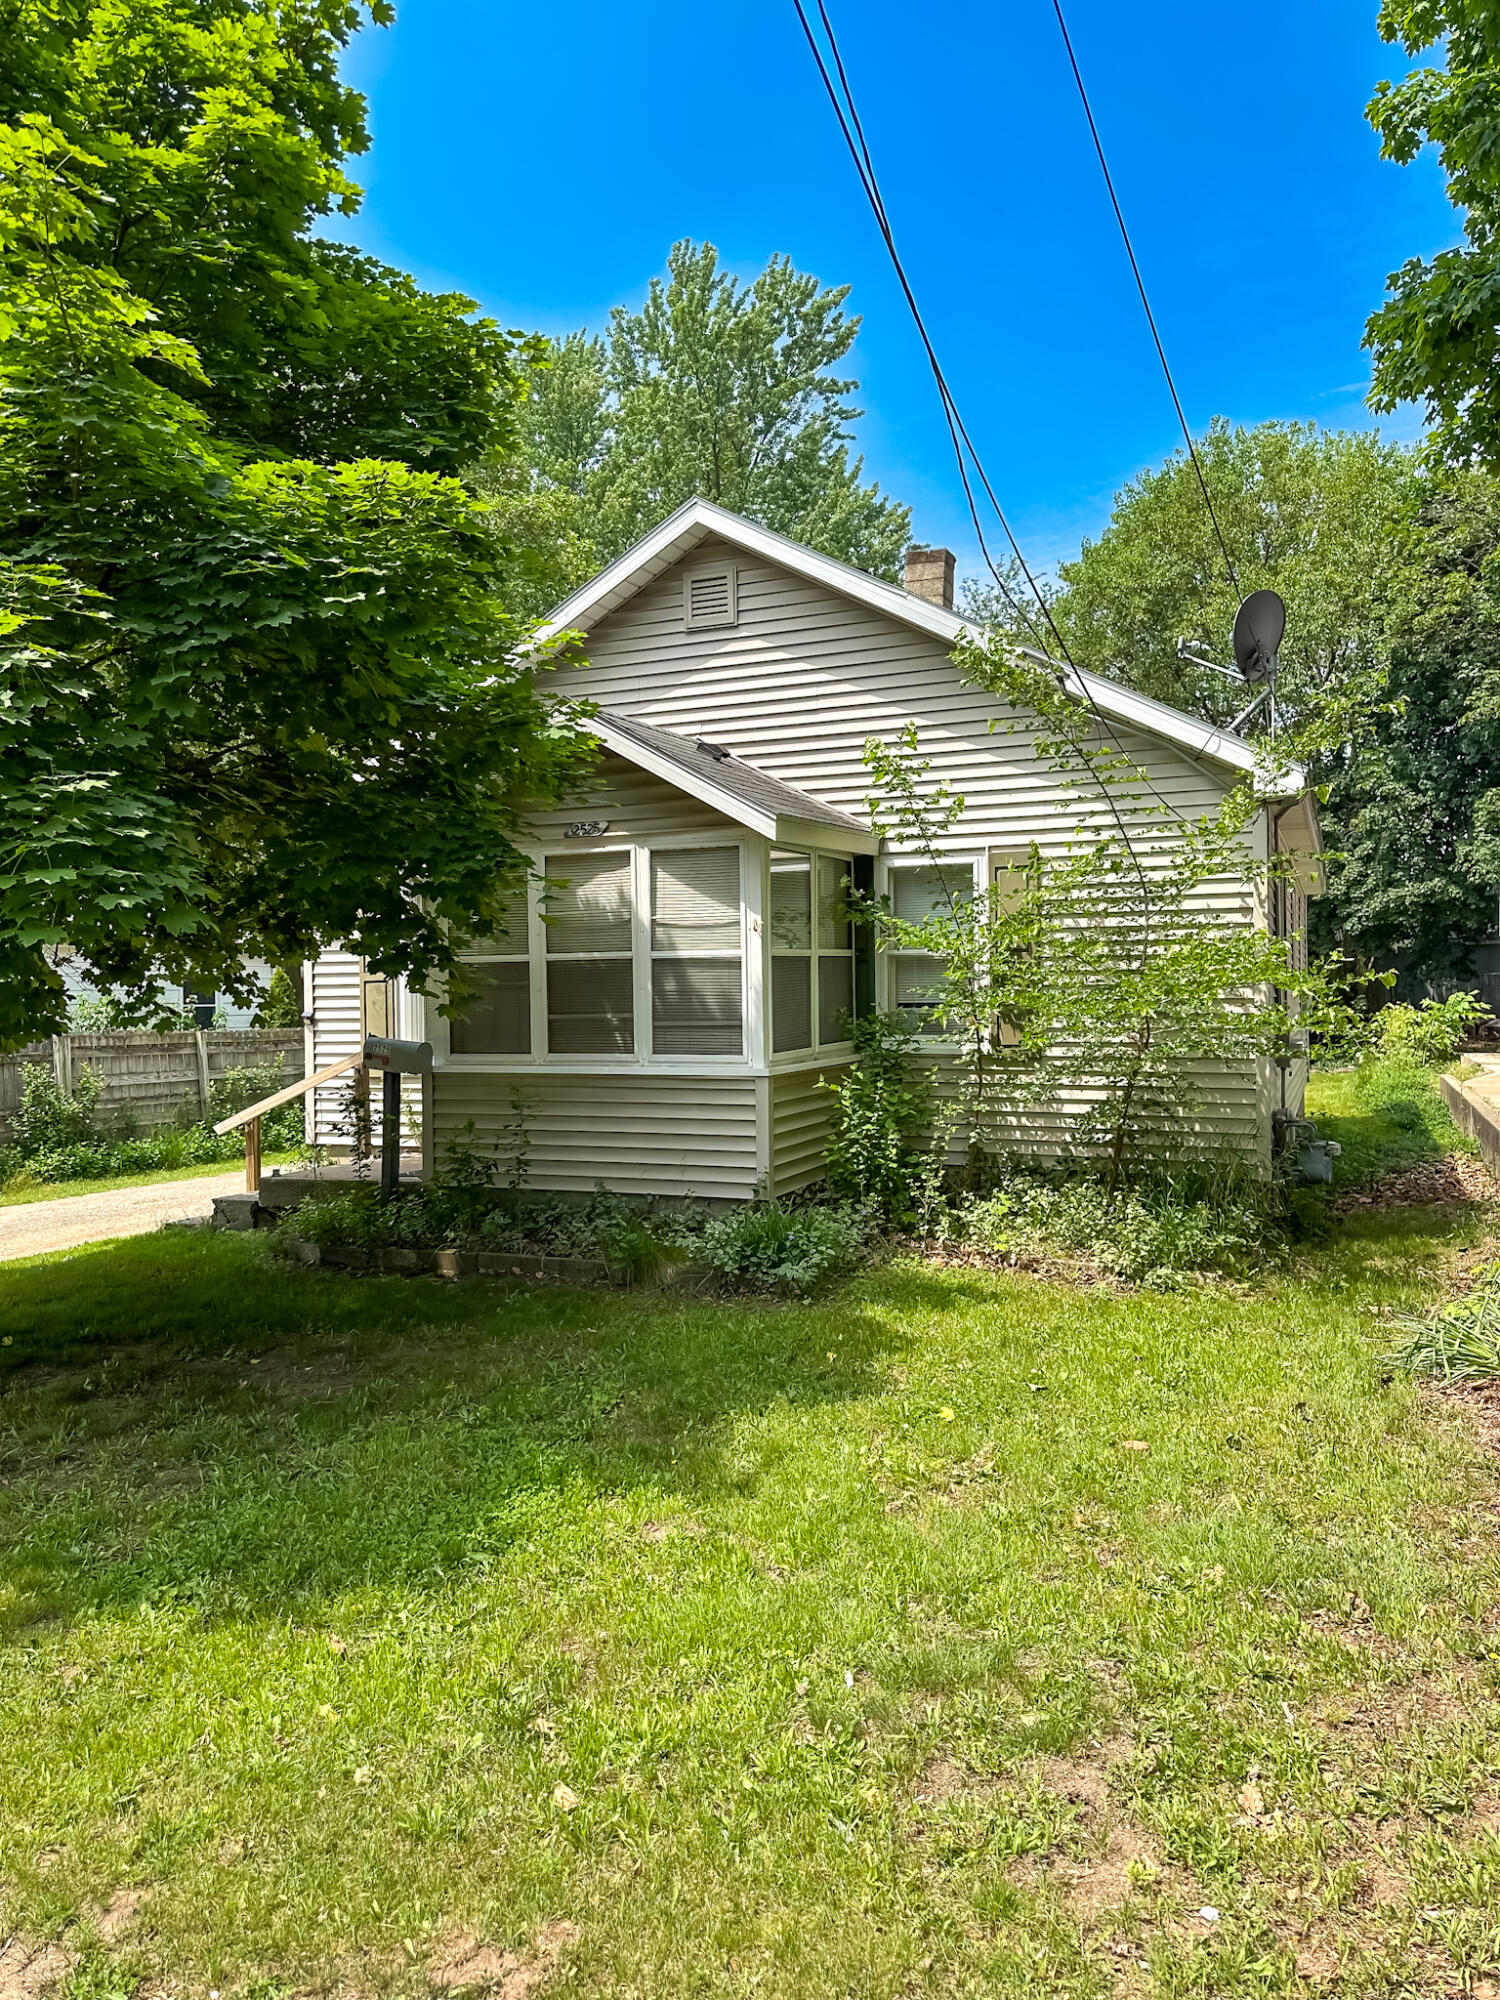
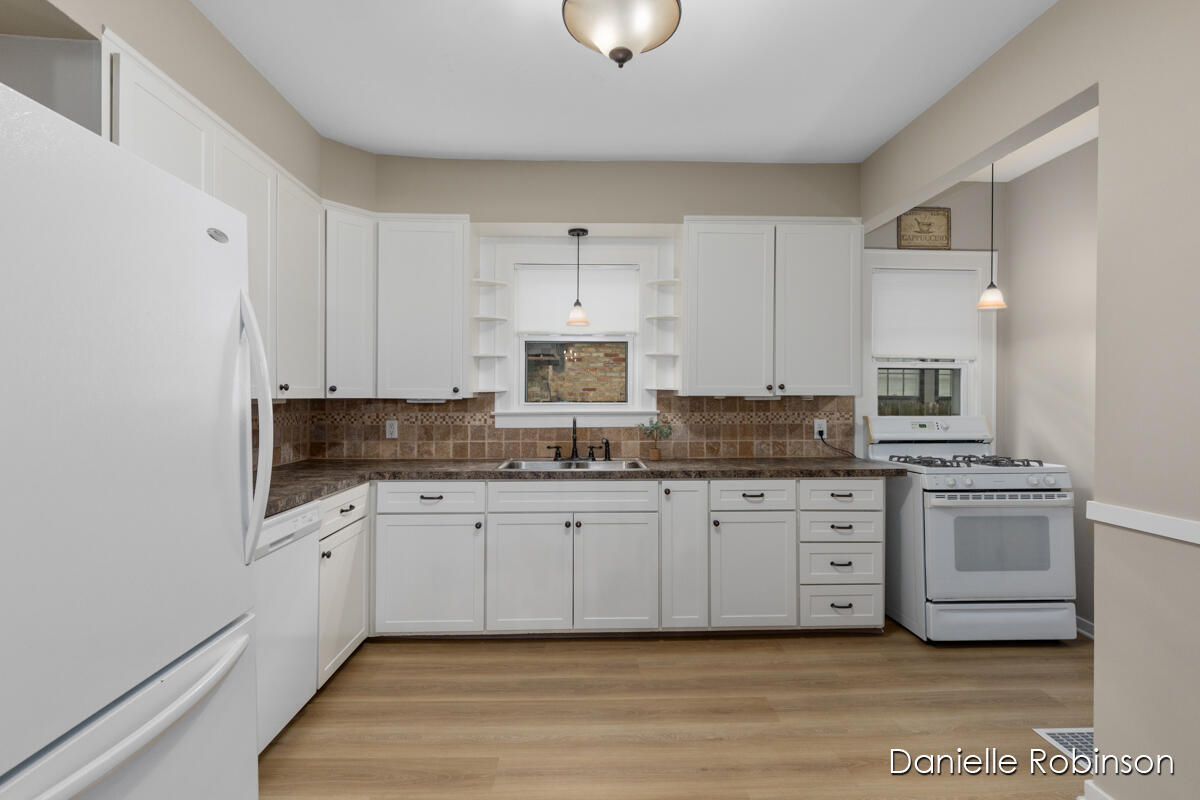
$175,000
2
bds
|
1
ba
|
850
sqft
|
built
1949
2525 Woodward Ave SW, Wyoming, MI 49509
$91
Cash flow
2.7%
Cash-on-Cash Return
6.8%
Cap rate
0.9%
Rent to Value Ratio
Pending
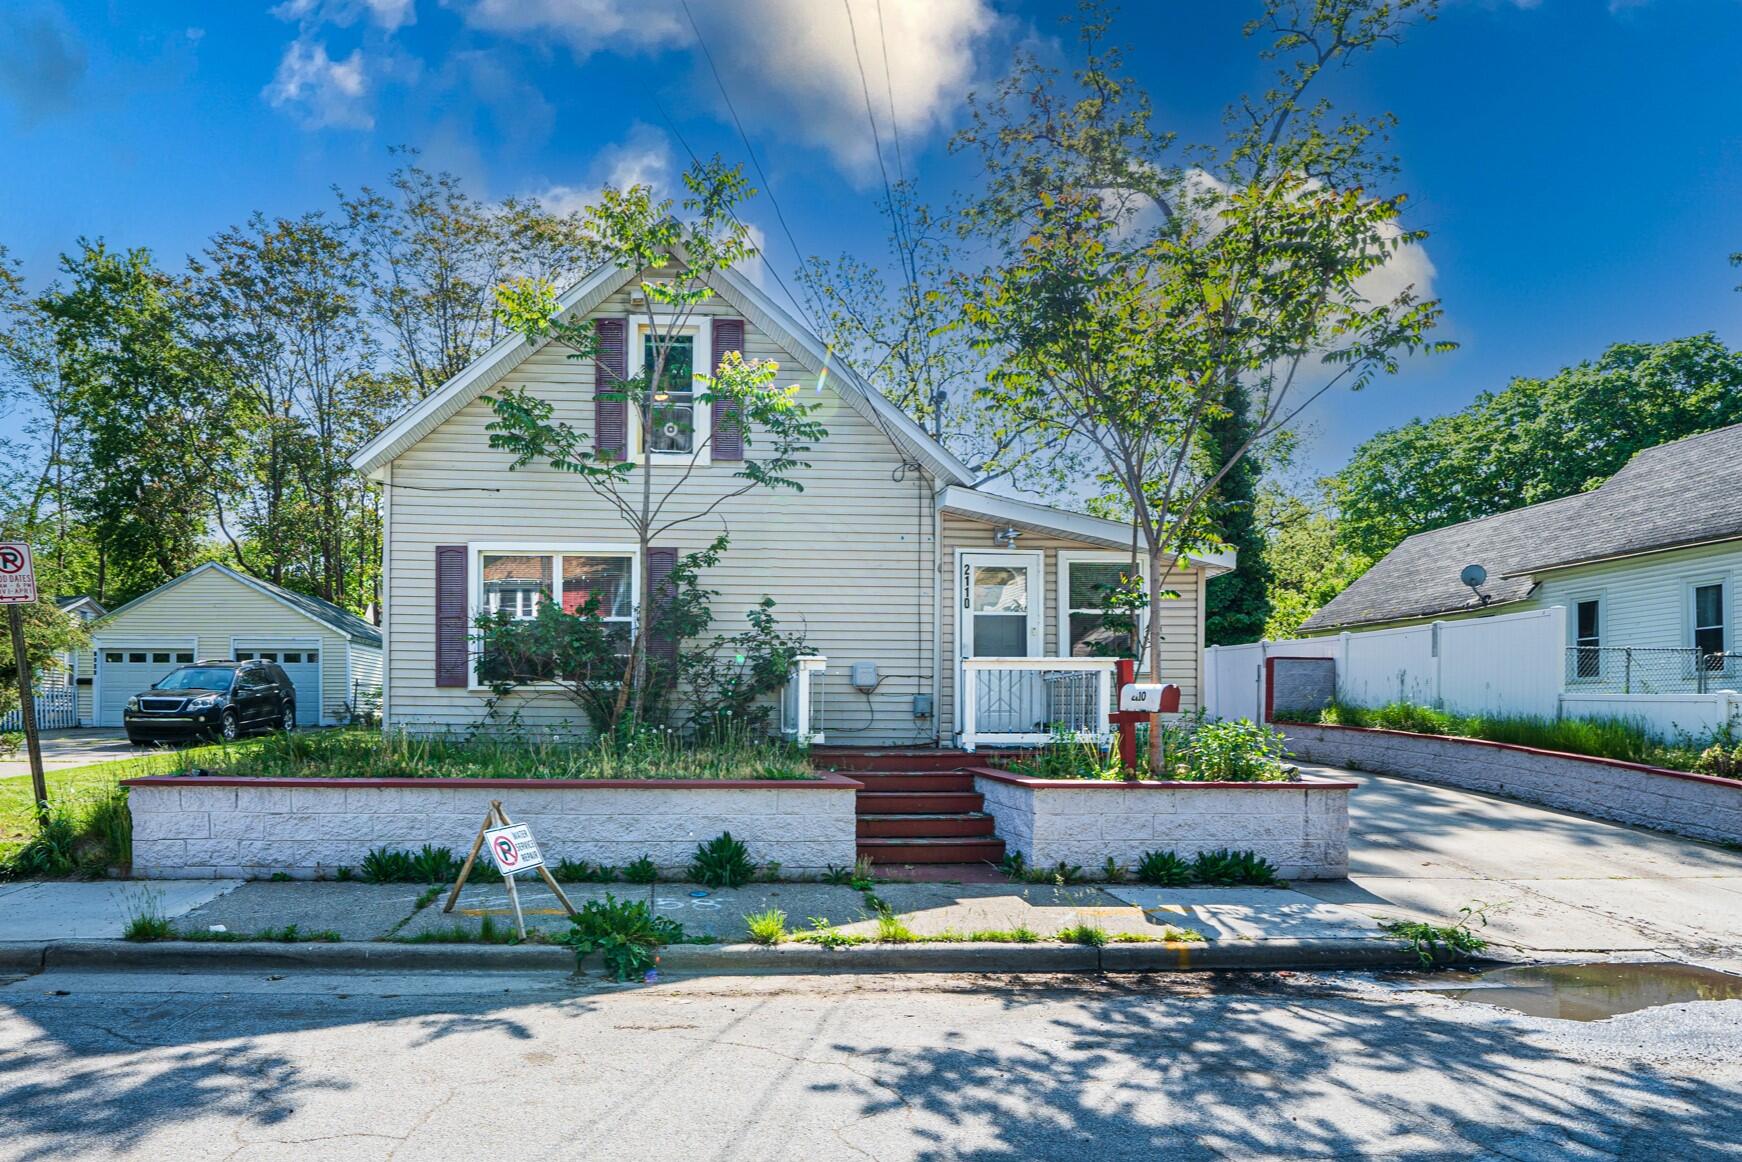
$200,000
4
bds
|
3
ba
|
1,675
sqft
|
built
1900
2110 Saint Charles Ave SW, Grand Rapids, MI 49507
$64
Cash flow
1.7%
Cash-on-Cash Return
6.5%
Cap rate
0.9%
Rent to Value Ratio
480 out of 650 properties for sale in Kent County
Limited Results Shown
Create a free account, or log in to reveal all property listings and enjoy the complete experience.
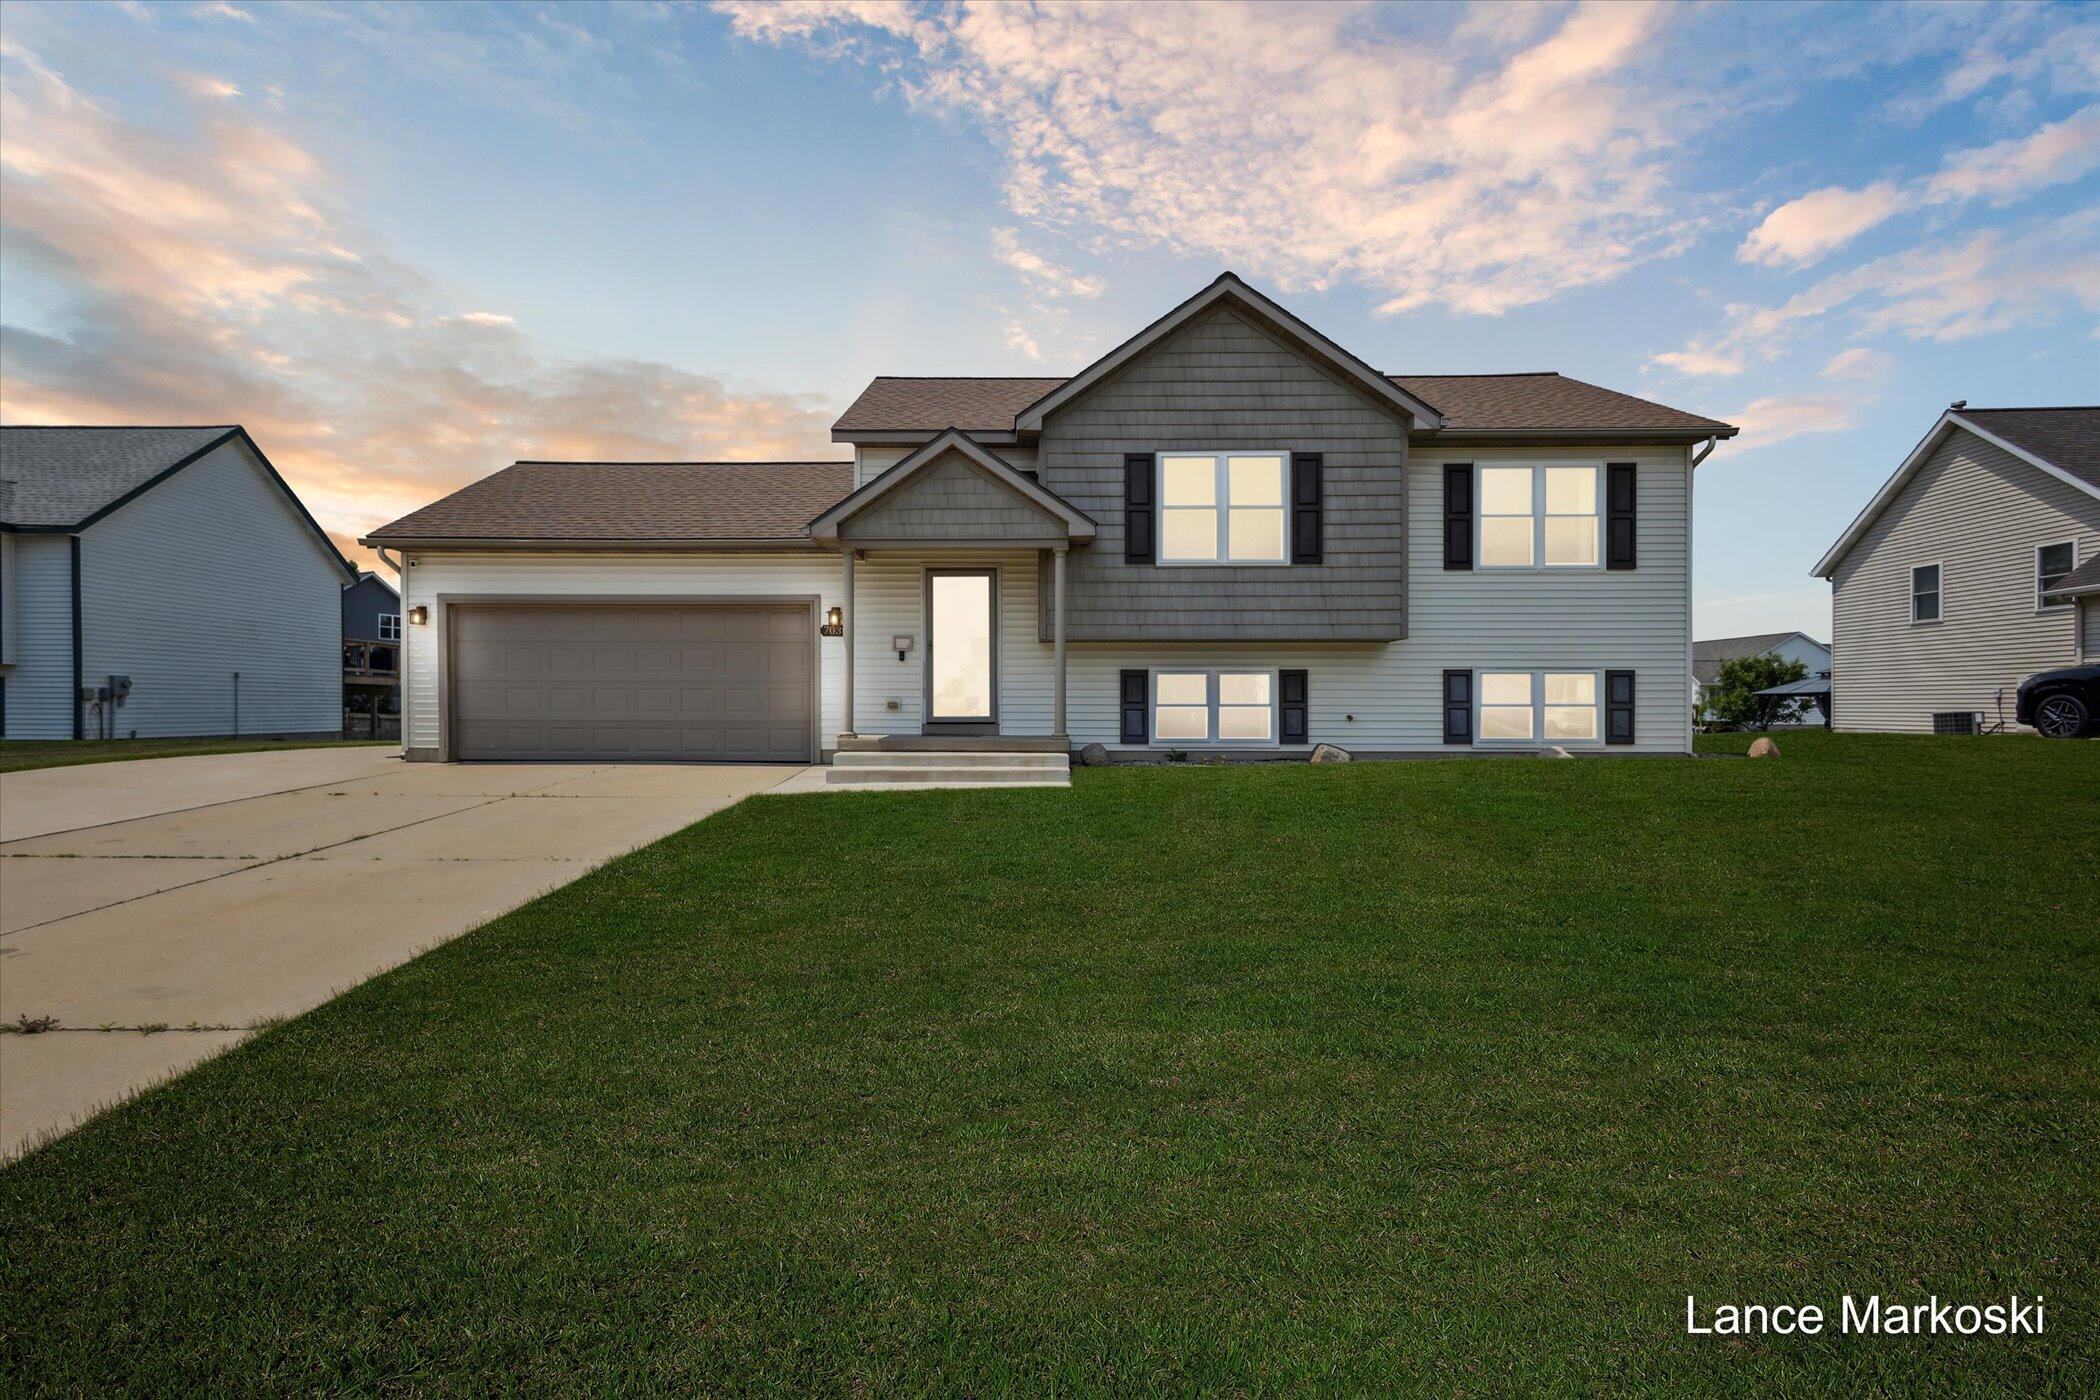
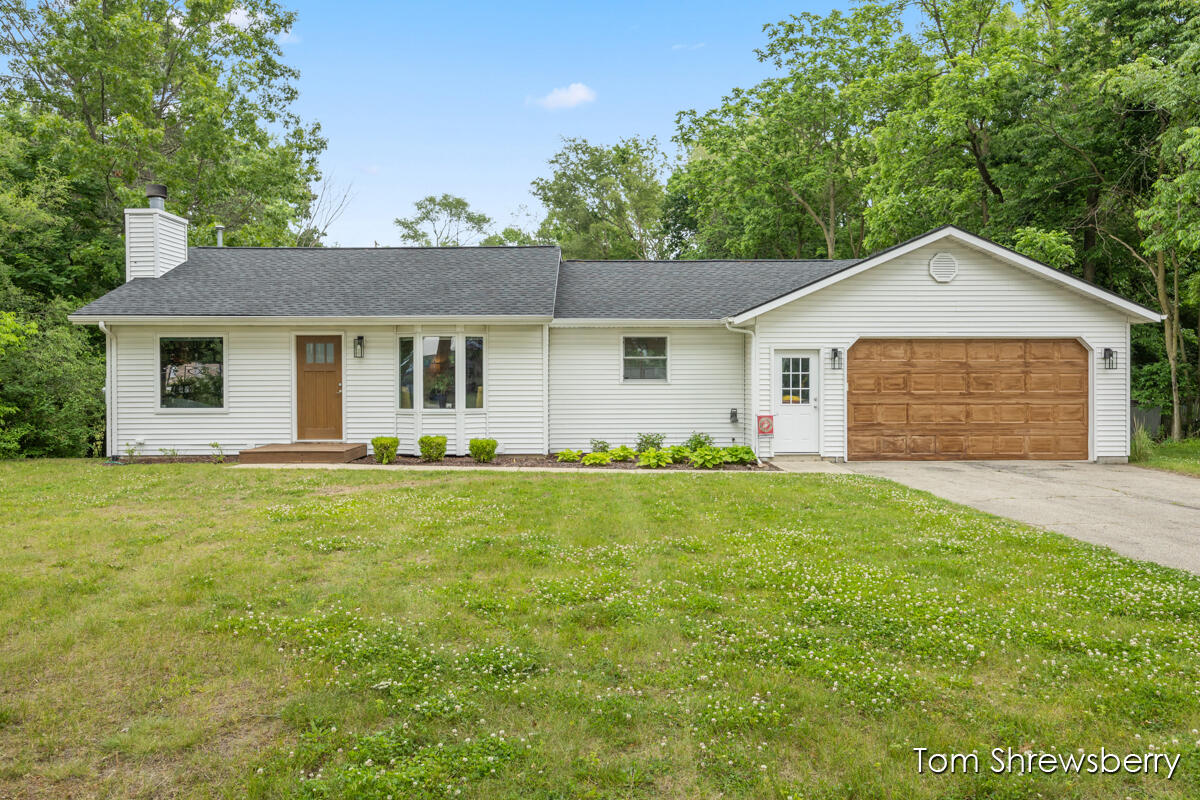
Pending
$389,900
4
bds
|
2
ba
|
2,164
sqft
|
built
2005
7039 Hartman Dr SE, Caledonia, MI 49316
$-791
Cash flow
-10.6%
Cash-on-Cash Return
3.7%
Cap rate
0.6%
Rent to Value Ratio
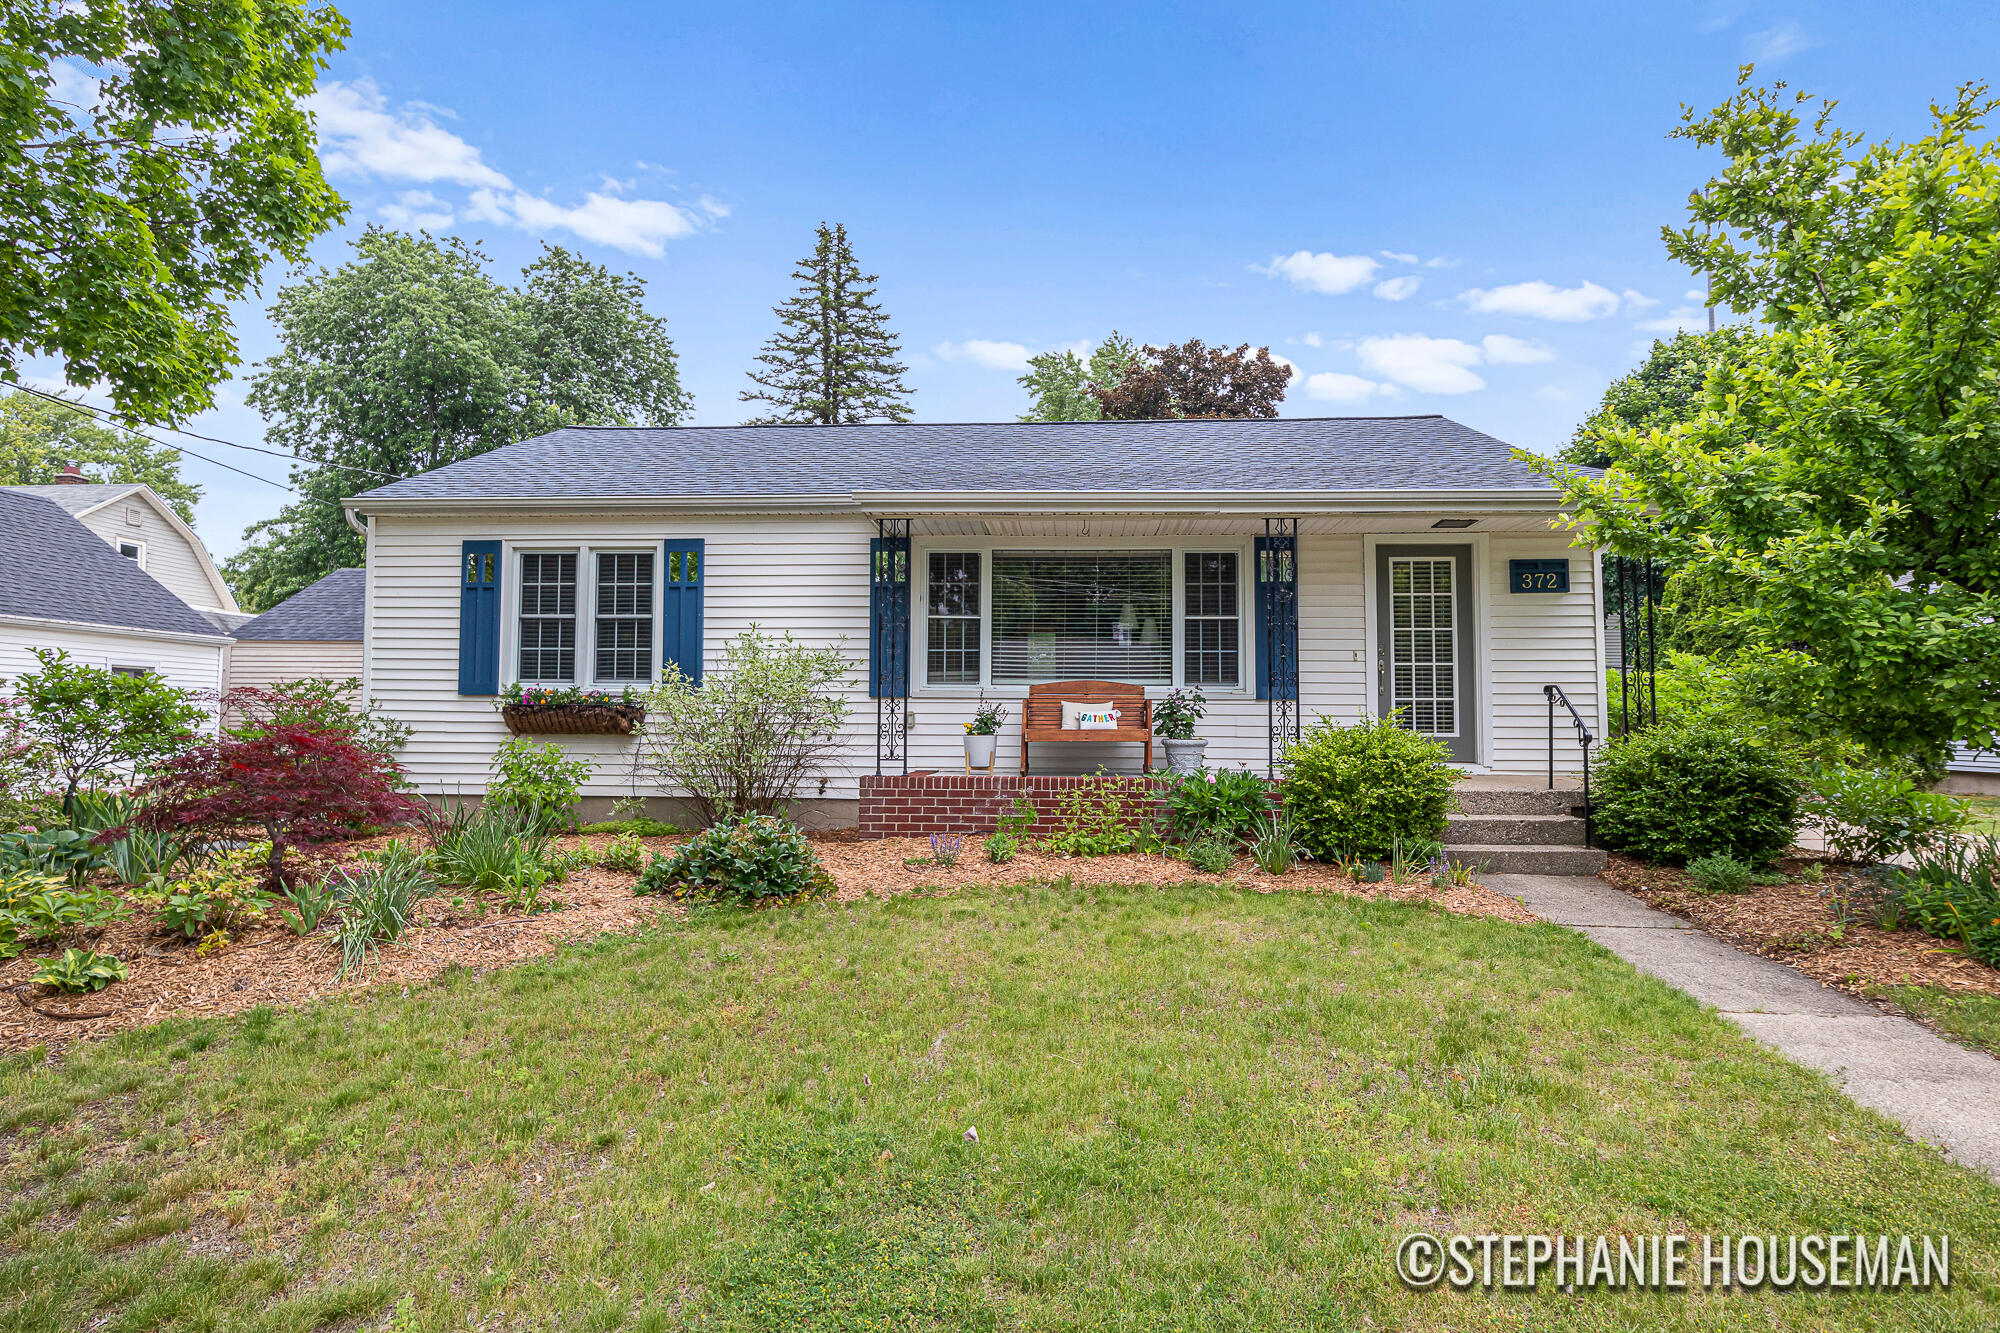
Active
$310,000
2
bds
|
1
ba
|
1,558
sqft
|
built
1951
372 Adolph St, Rockford, MI 49341
$-389
Cash flow
-6.5%
Cash-on-Cash Return
4.6%
Cap rate
0.8%
Rent to Value Ratio
Active
$330,000
3
bds
|
2
ba
|
1,461
sqft
|
built
1915
1448 Hall St SE, Grand Rapids, MI 49506
$-132
Cash flow
-2.1%
Cash-on-Cash Return
5.7%
Cap rate
0.8%
Rent to Value Ratio
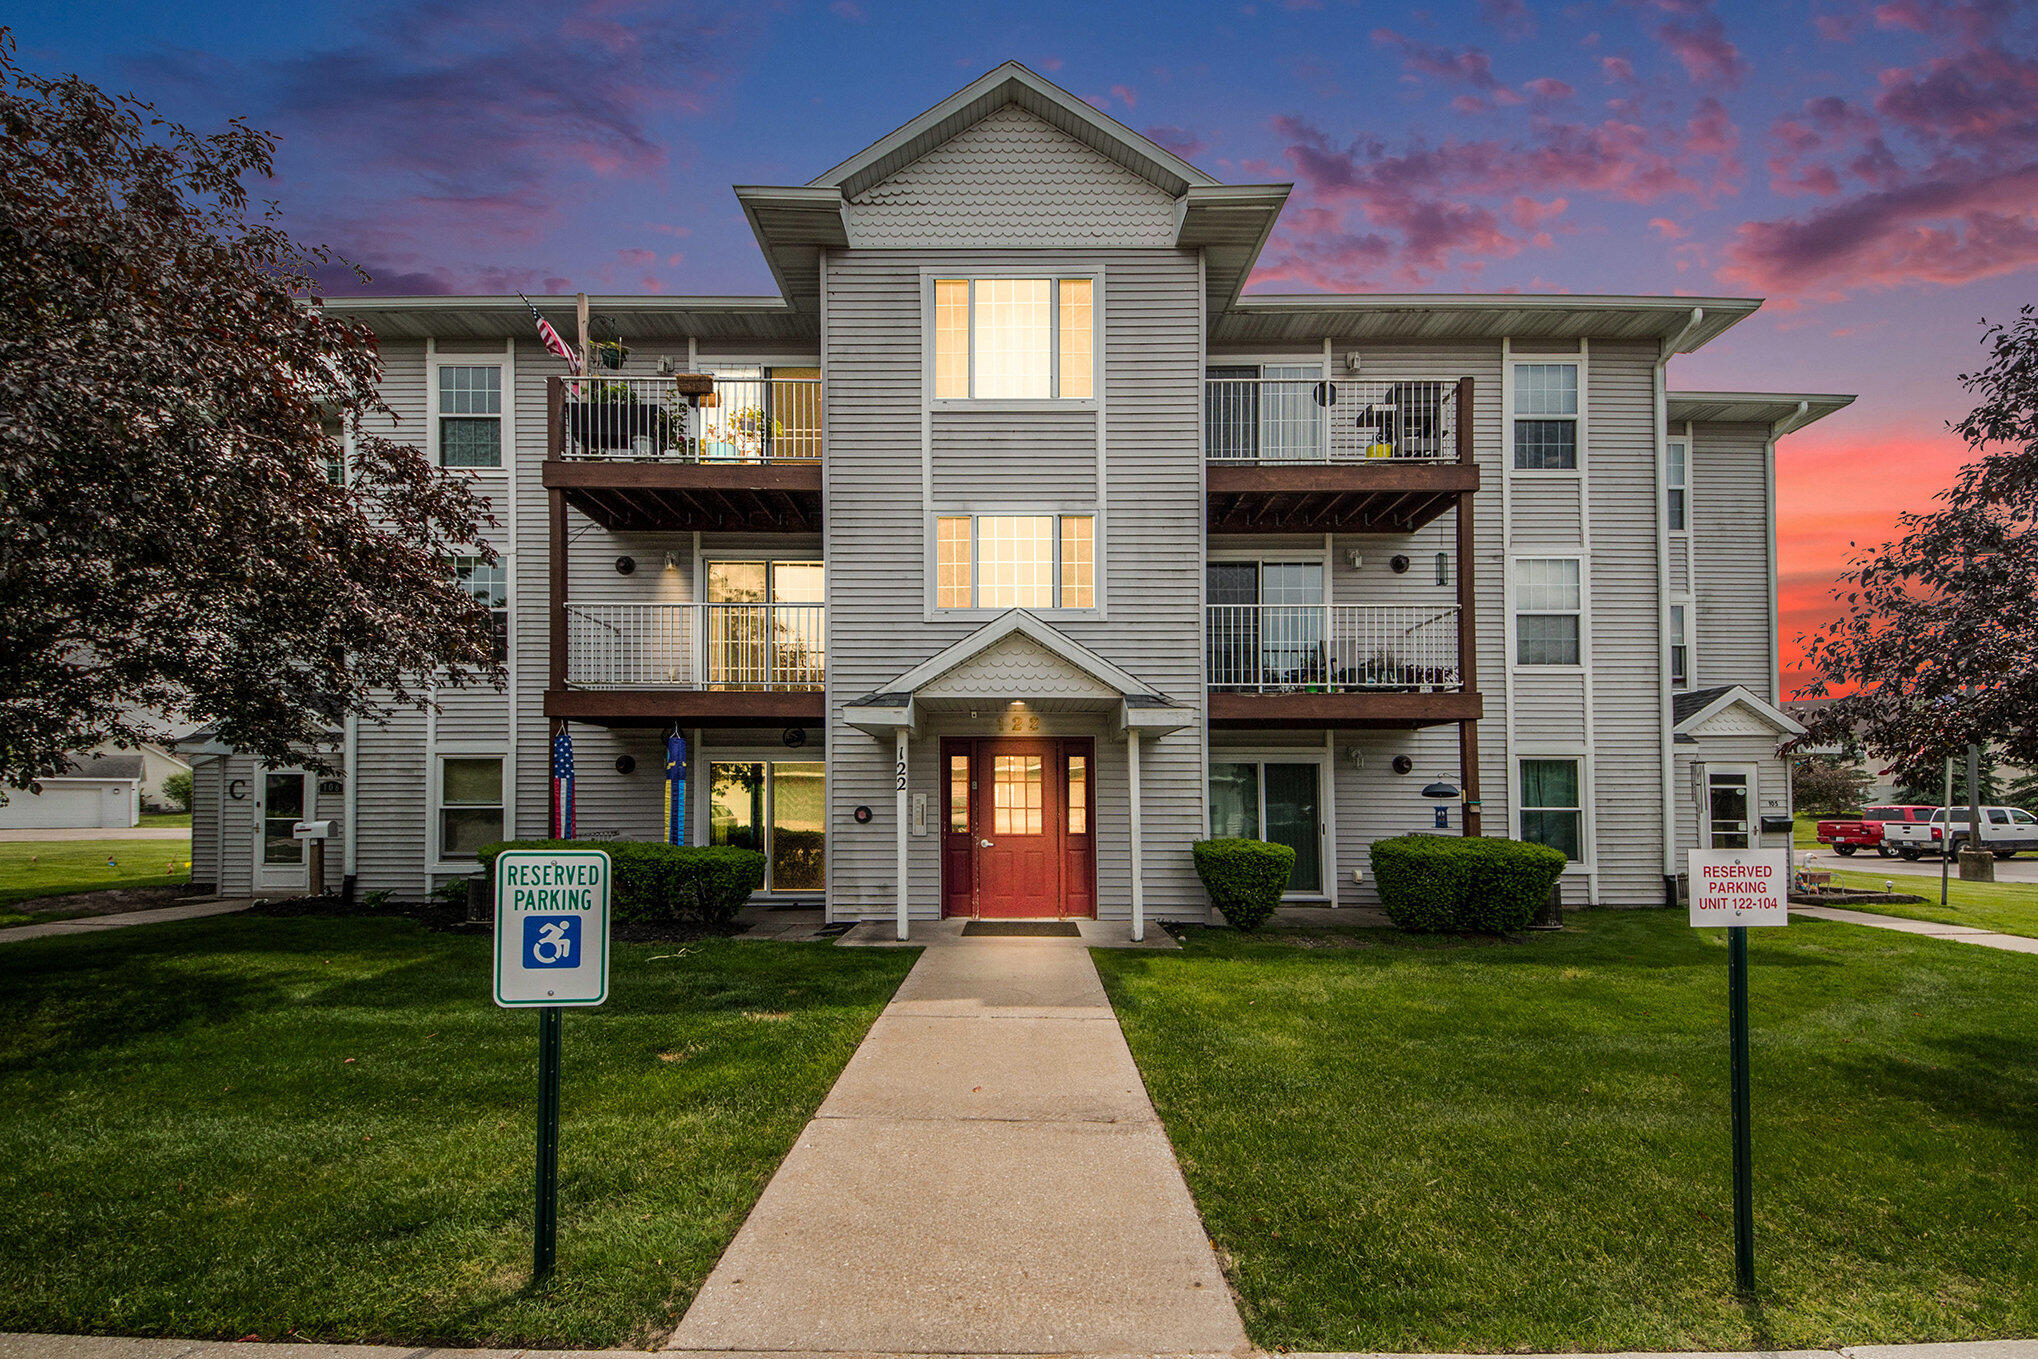
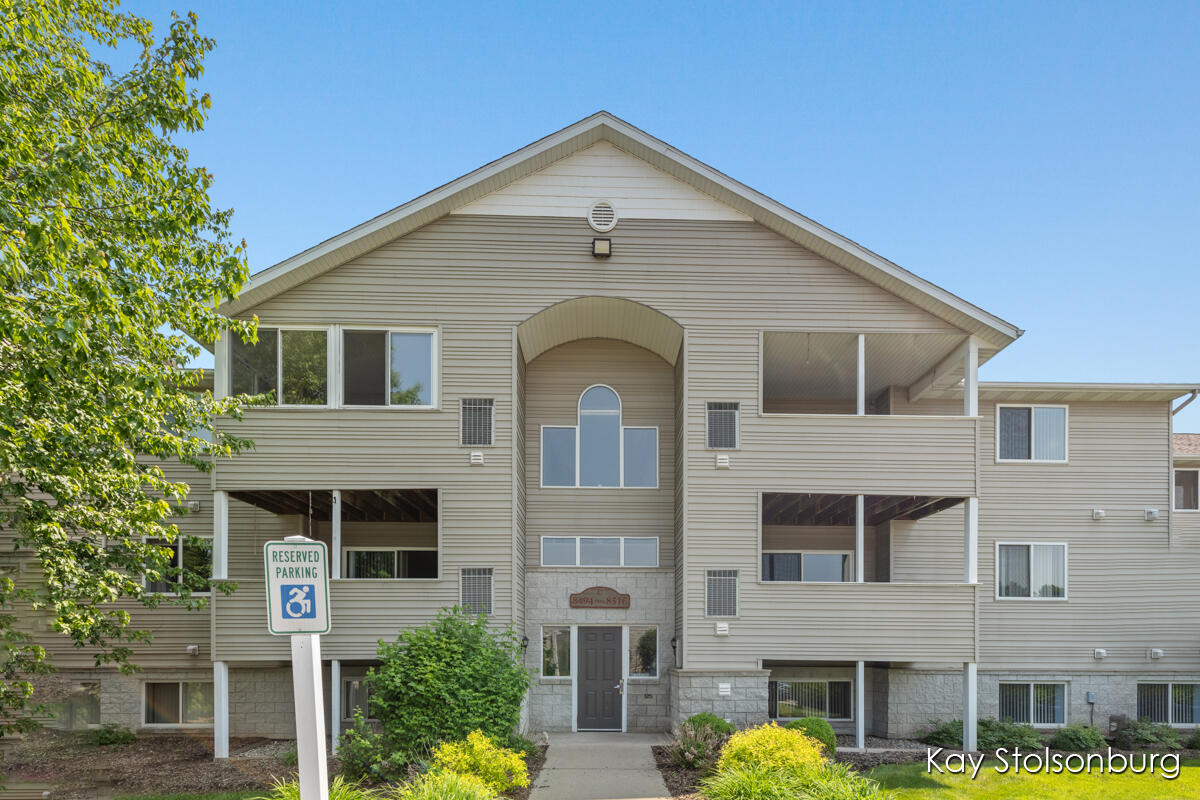
Pending
$135,000
1
bds
|
1
ba
|
690
sqft
|
built
1998
122 Ida Red Ave, Sparta, MI 49345
$-362
Cash flow
-14.0%
Cash-on-Cash Return
2.9%
Cap rate
0.8%
Rent to Value Ratio

Active
$350,000
3
bds
|
3
ba
|
2,583
sqft
|
built
1956
4785 Kalamazoo Ave SE, Kentwood, MI 49508
$-661
Cash flow
-9.9%
Cash-on-Cash Return
3.9%
Cap rate
0.7%
Rent to Value Ratio
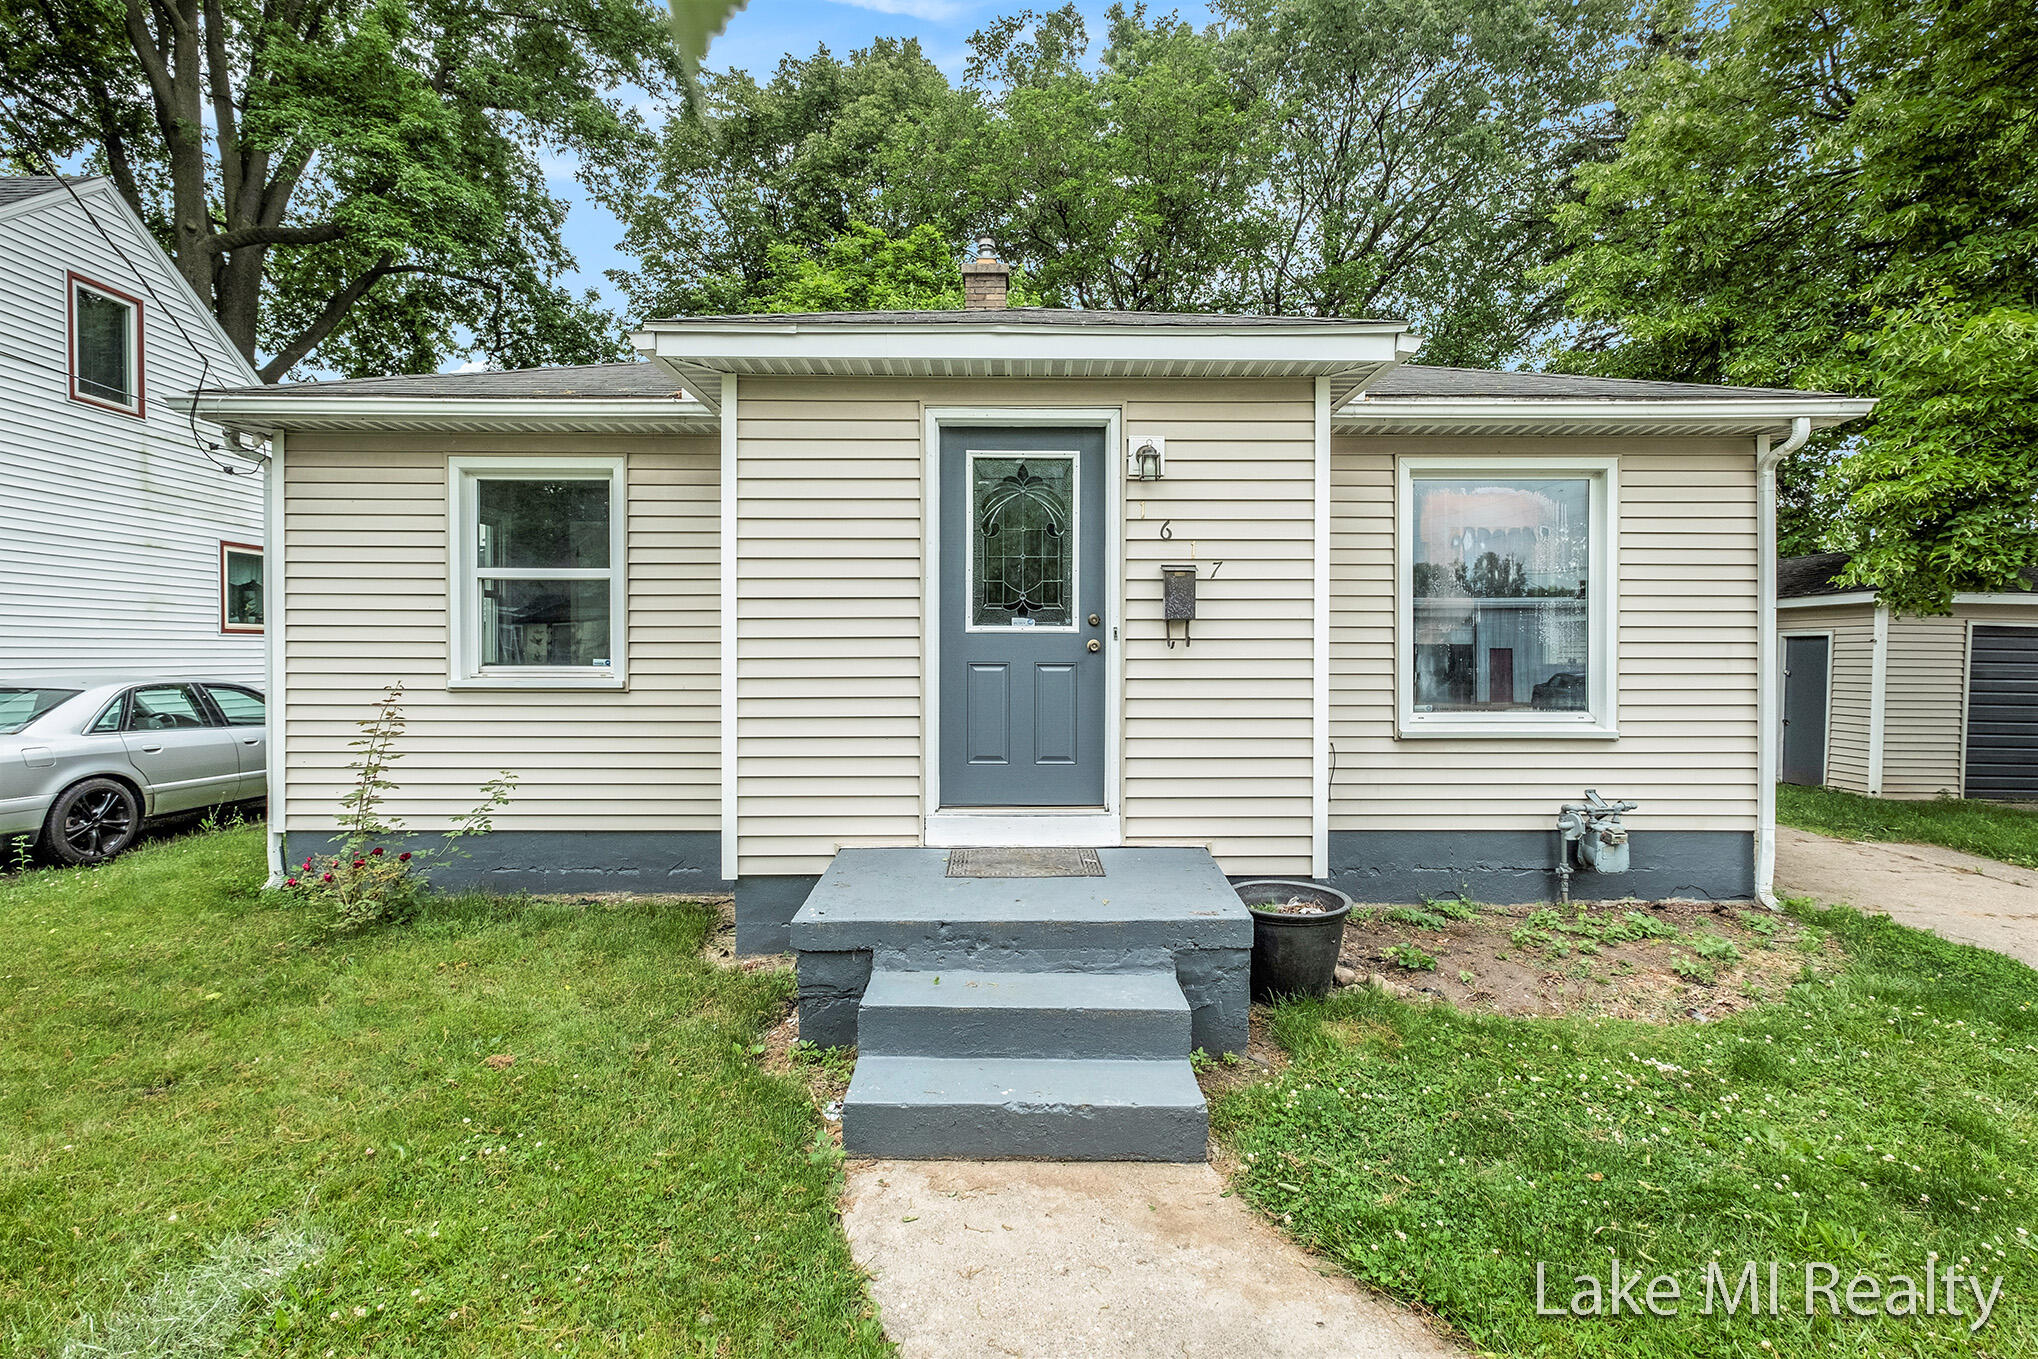
Pending
$225,000
2
bds
|
1
ba
|
808
sqft
|
built
1945
1617 Federal Ave SW, Wyoming, MI 49509
$-376
Cash flow
-8.7%
Cash-on-Cash Return
4.1%
Cap rate
0.7%
Rent to Value Ratio

Active
$355,000
3
bds
|
3
ba
|
1,511
sqft
|
built
2022
6857 Old Town Square Pvt NE, Rockford, MI 49341
$-794
Cash flow
-11.7%
Cash-on-Cash Return
3.5%
Cap rate
0.7%
Rent to Value Ratio
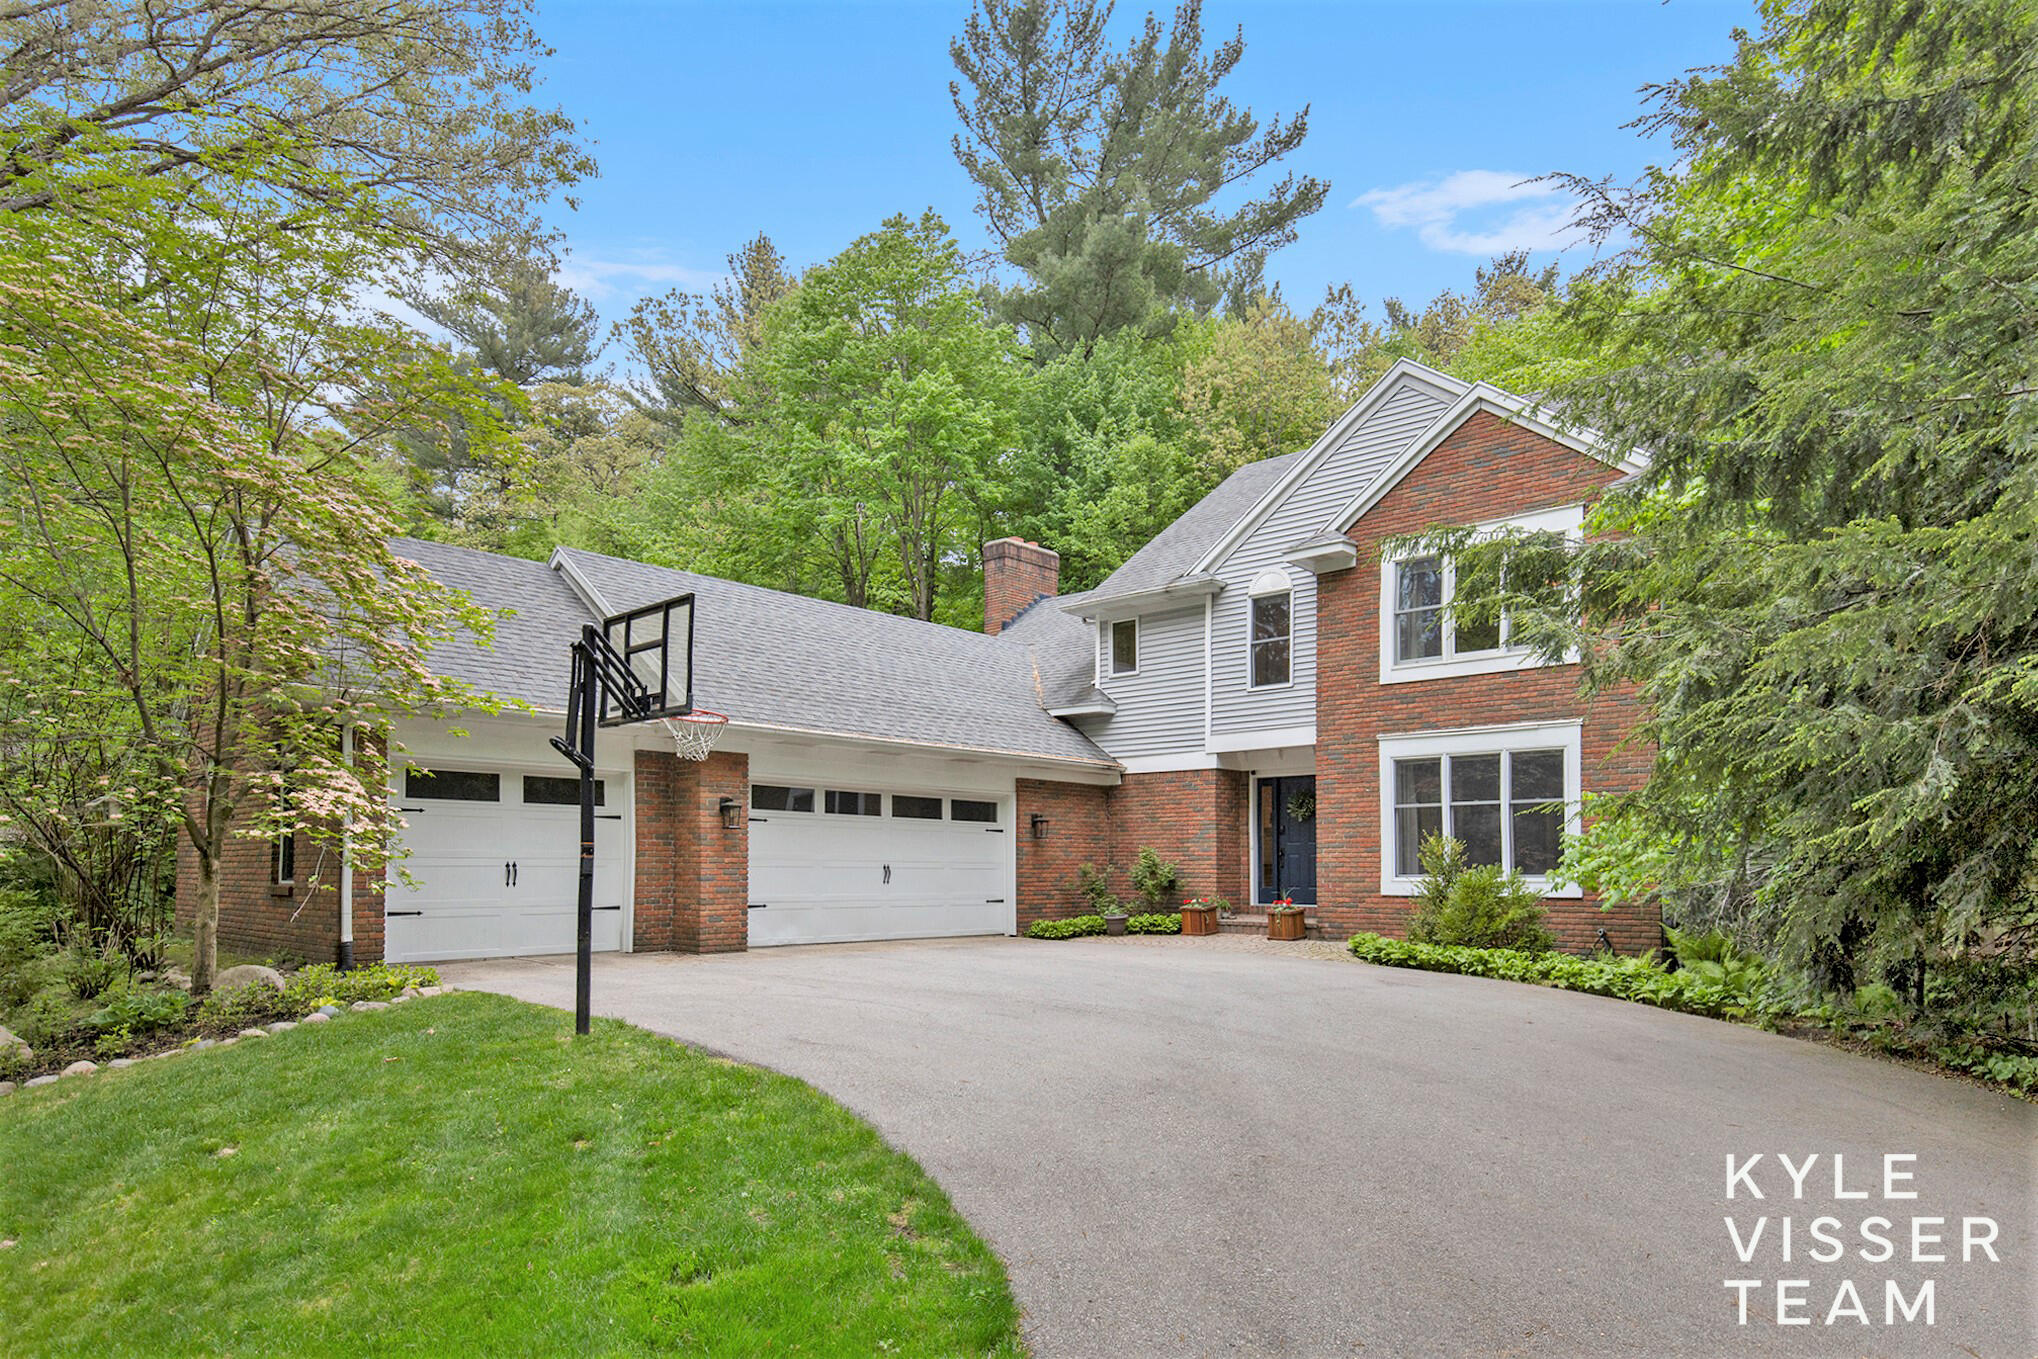
Active
$649,000
4
bds
|
3
ba
|
3,245
sqft
|
built
1989
3223 Riverwoods Dr NE, Rockford, MI 49341
$-1,613
Cash flow
-13.0%
Cash-on-Cash Return
3.2%
Cap rate
0.5%
Rent to Value Ratio

Pending
$360,000
3
bds
|
2
ba
|
1,487
sqft
|
built
2012
5099 Alyssum Dr SE, Kentwood, MI 49512
$-477
Cash flow
-6.9%
Cash-on-Cash Return
4.6%
Cap rate
0.7%
Rent to Value Ratio
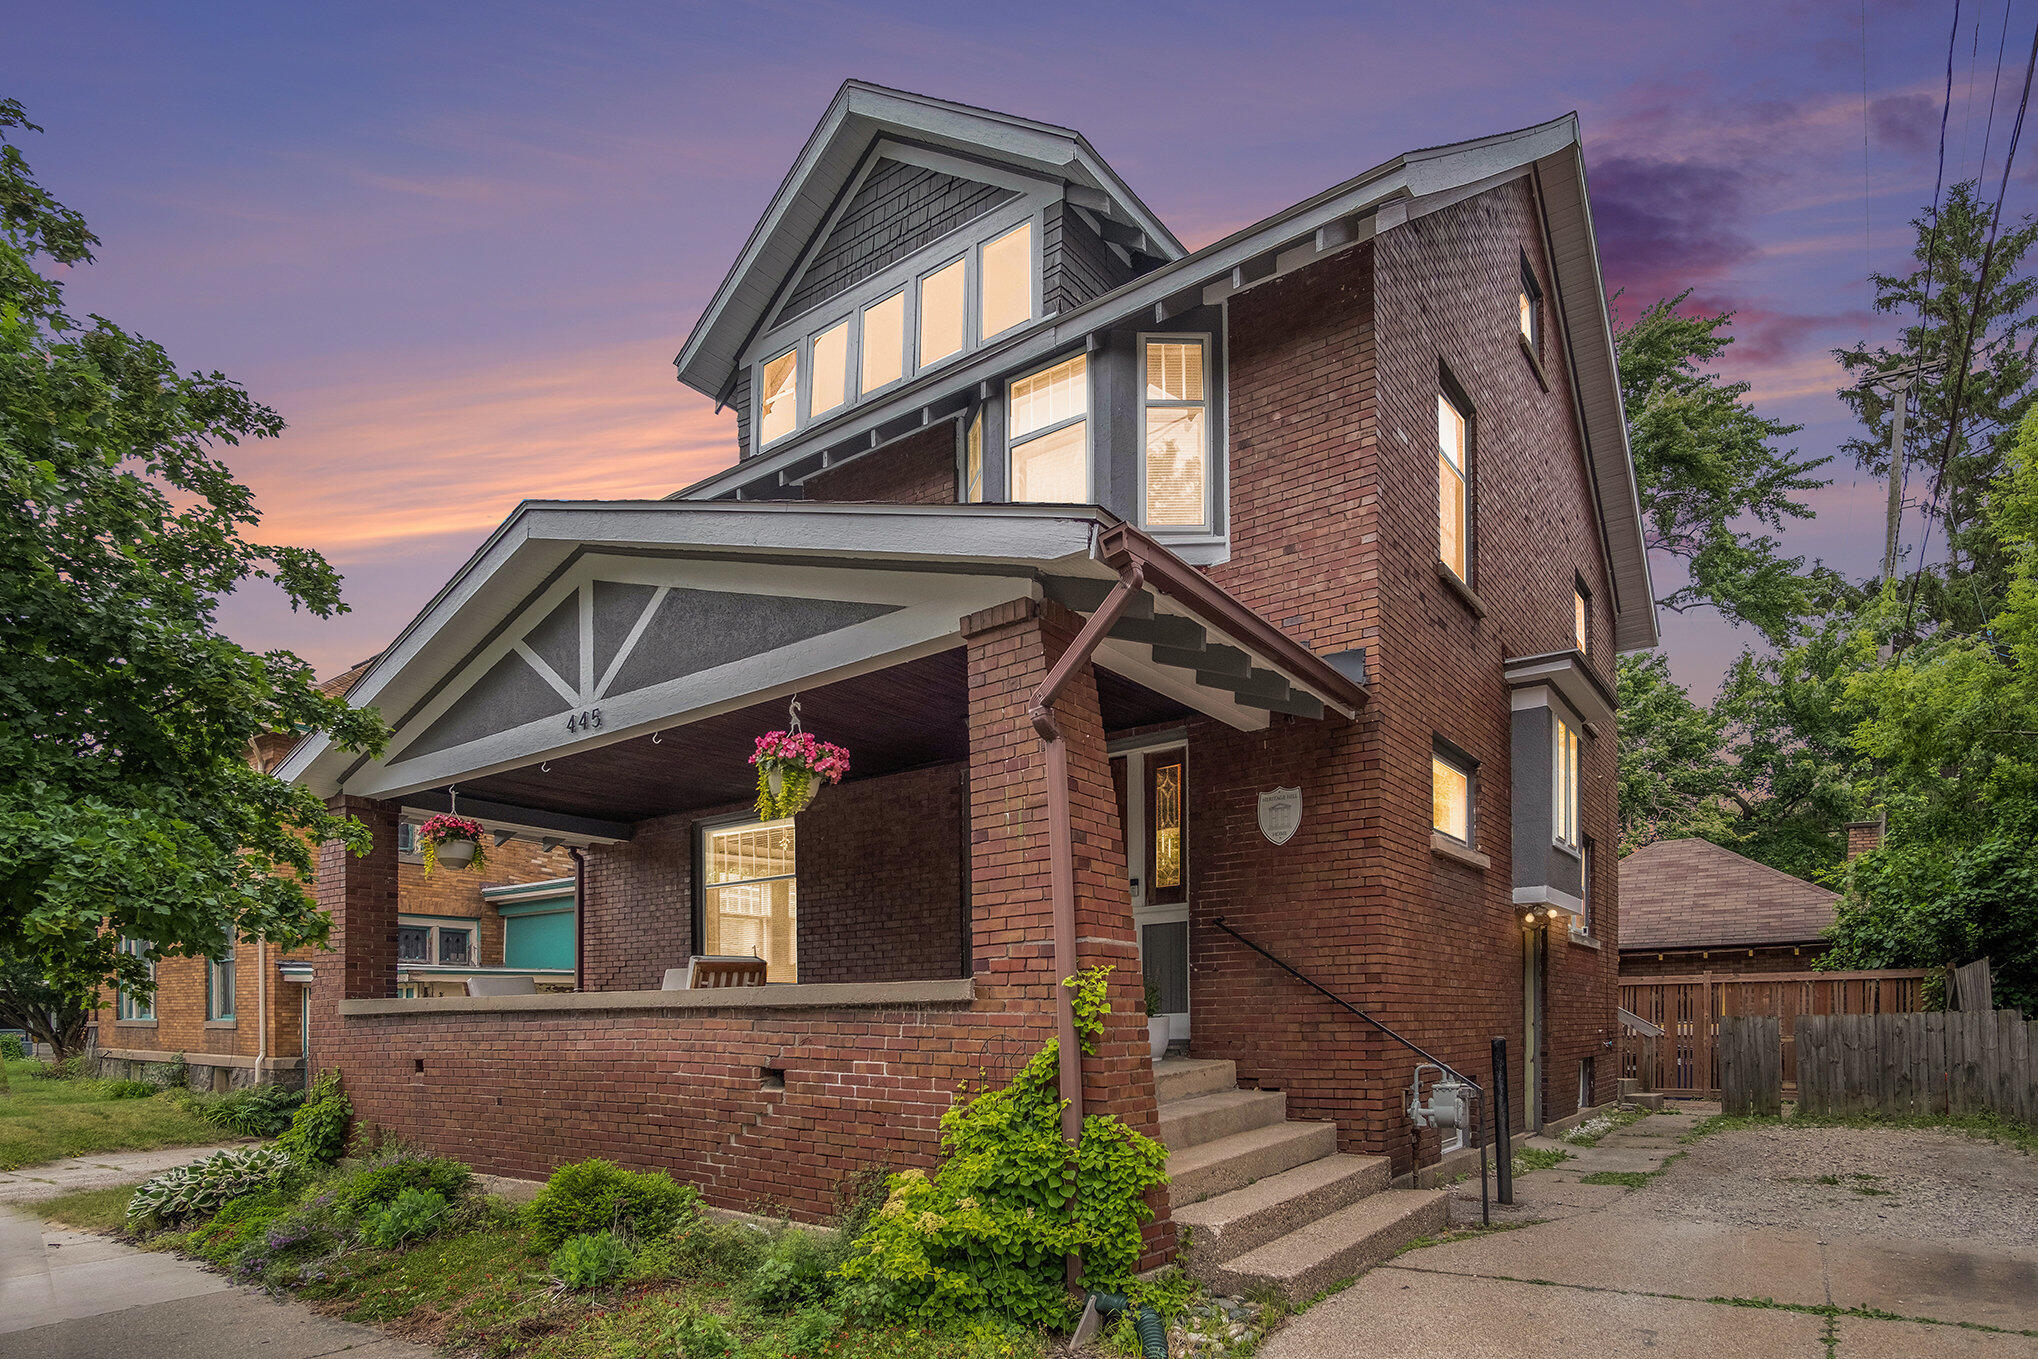
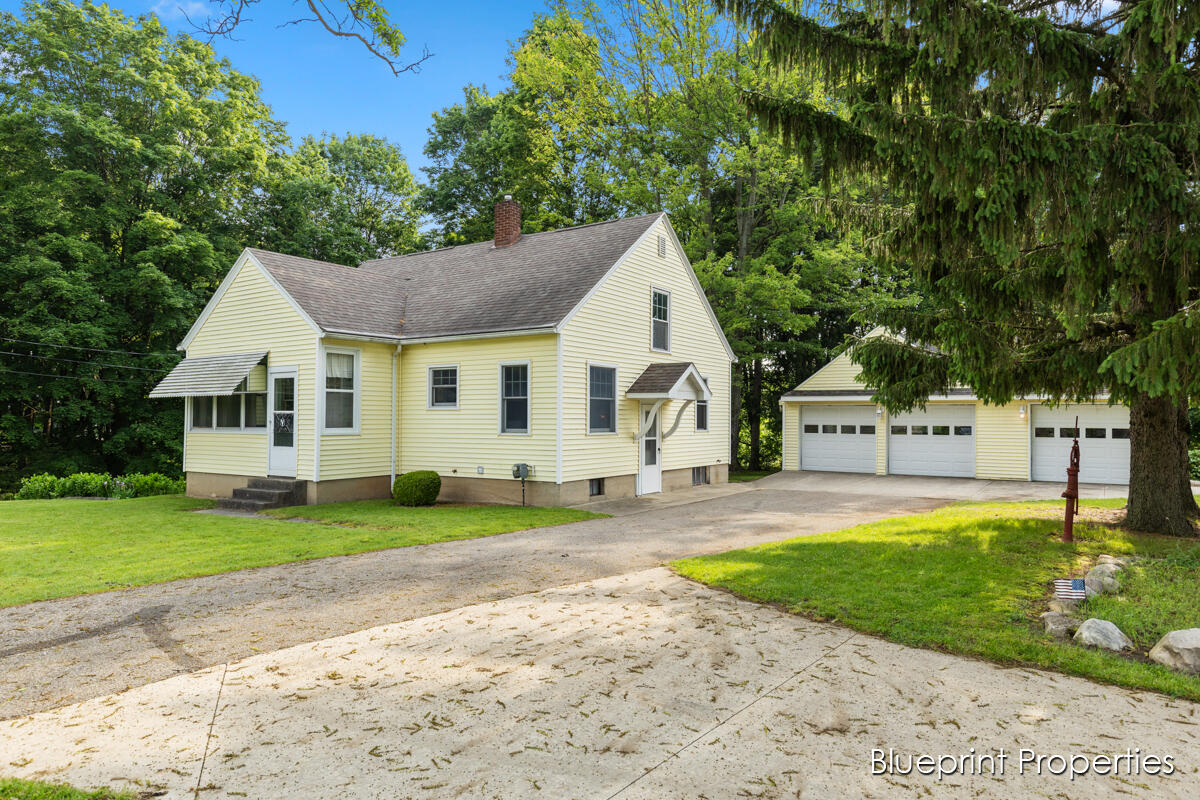
Active
$364,900
4
bds
|
2
ba
|
1,668
sqft
|
built
1902
445 Wealthy St SE, Grand Rapids, MI 49503
$-280
Cash flow
-4.0%
Cash-on-Cash Return
5.2%
Cap rate
0.8%
Rent to Value Ratio

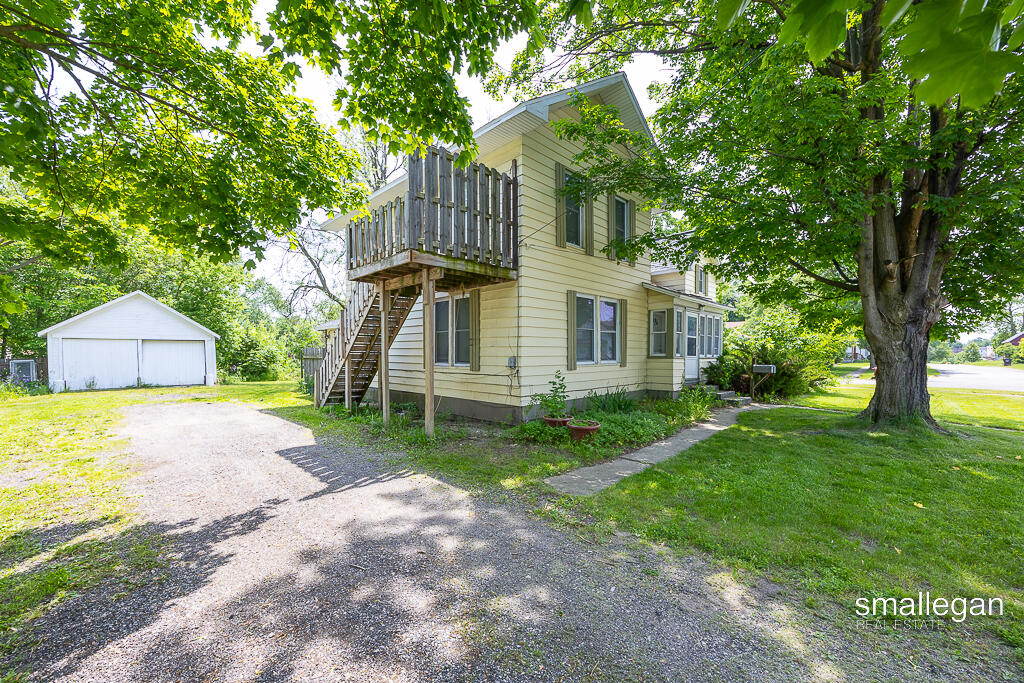
Pending
$240,000
bds
|
0
ba
|
0
sqft
|
built
1890
37 Caledonia St NE, Grand Rapids, MI 49505
$-49
Cash flow
-1.1%
Cash-on-Cash Return
5.9%
Cap rate
0.8%
Rent to Value Ratio
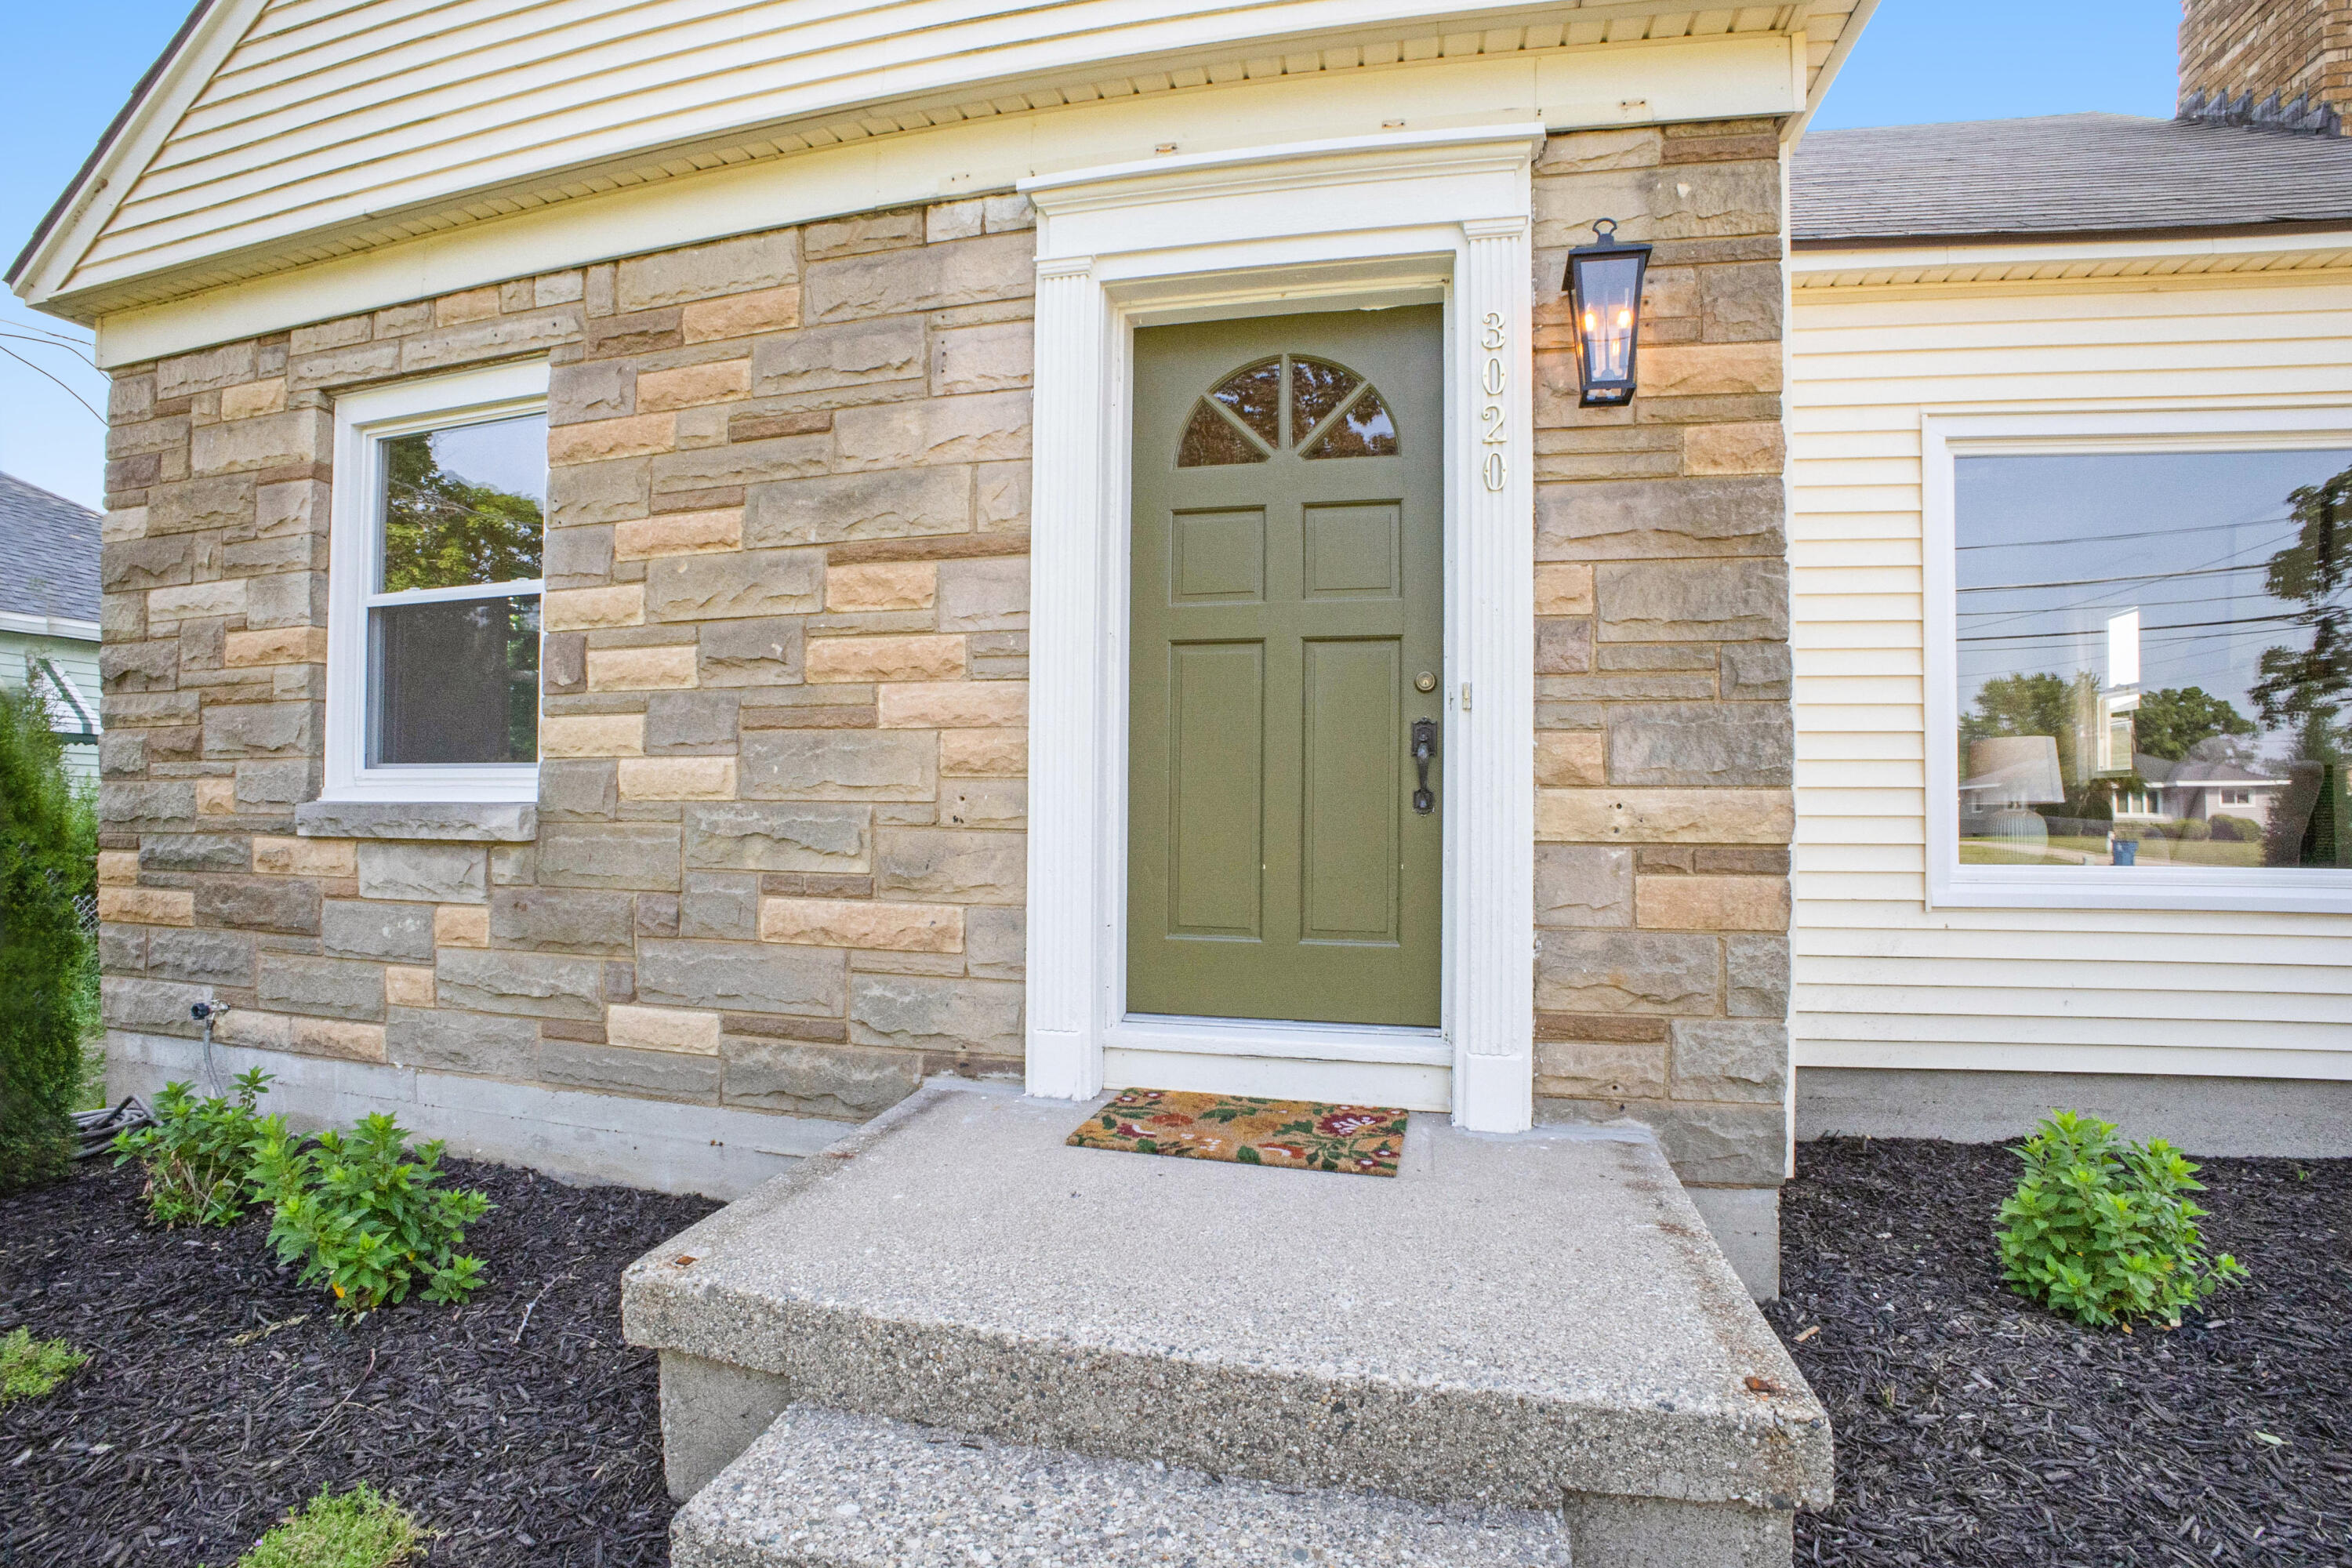
Pending
$249,900
3
bds
|
2
ba
|
1,060
sqft
|
built
1950
3020 Clyde Park Ave SW, Wyoming, MI 49509
$-205
Cash flow
-4.3%
Cash-on-Cash Return
5.2%
Cap rate
0.7%
Rent to Value Ratio
Active
$299,000
bds
|
0
ba
|
0
sqft
|
built
1911
186 N Elm St, Sparta, MI 49345
$-698
Cash flow
-12.2%
Cash-on-Cash Return
3.3%
Cap rate
0.7%
Rent to Value Ratio
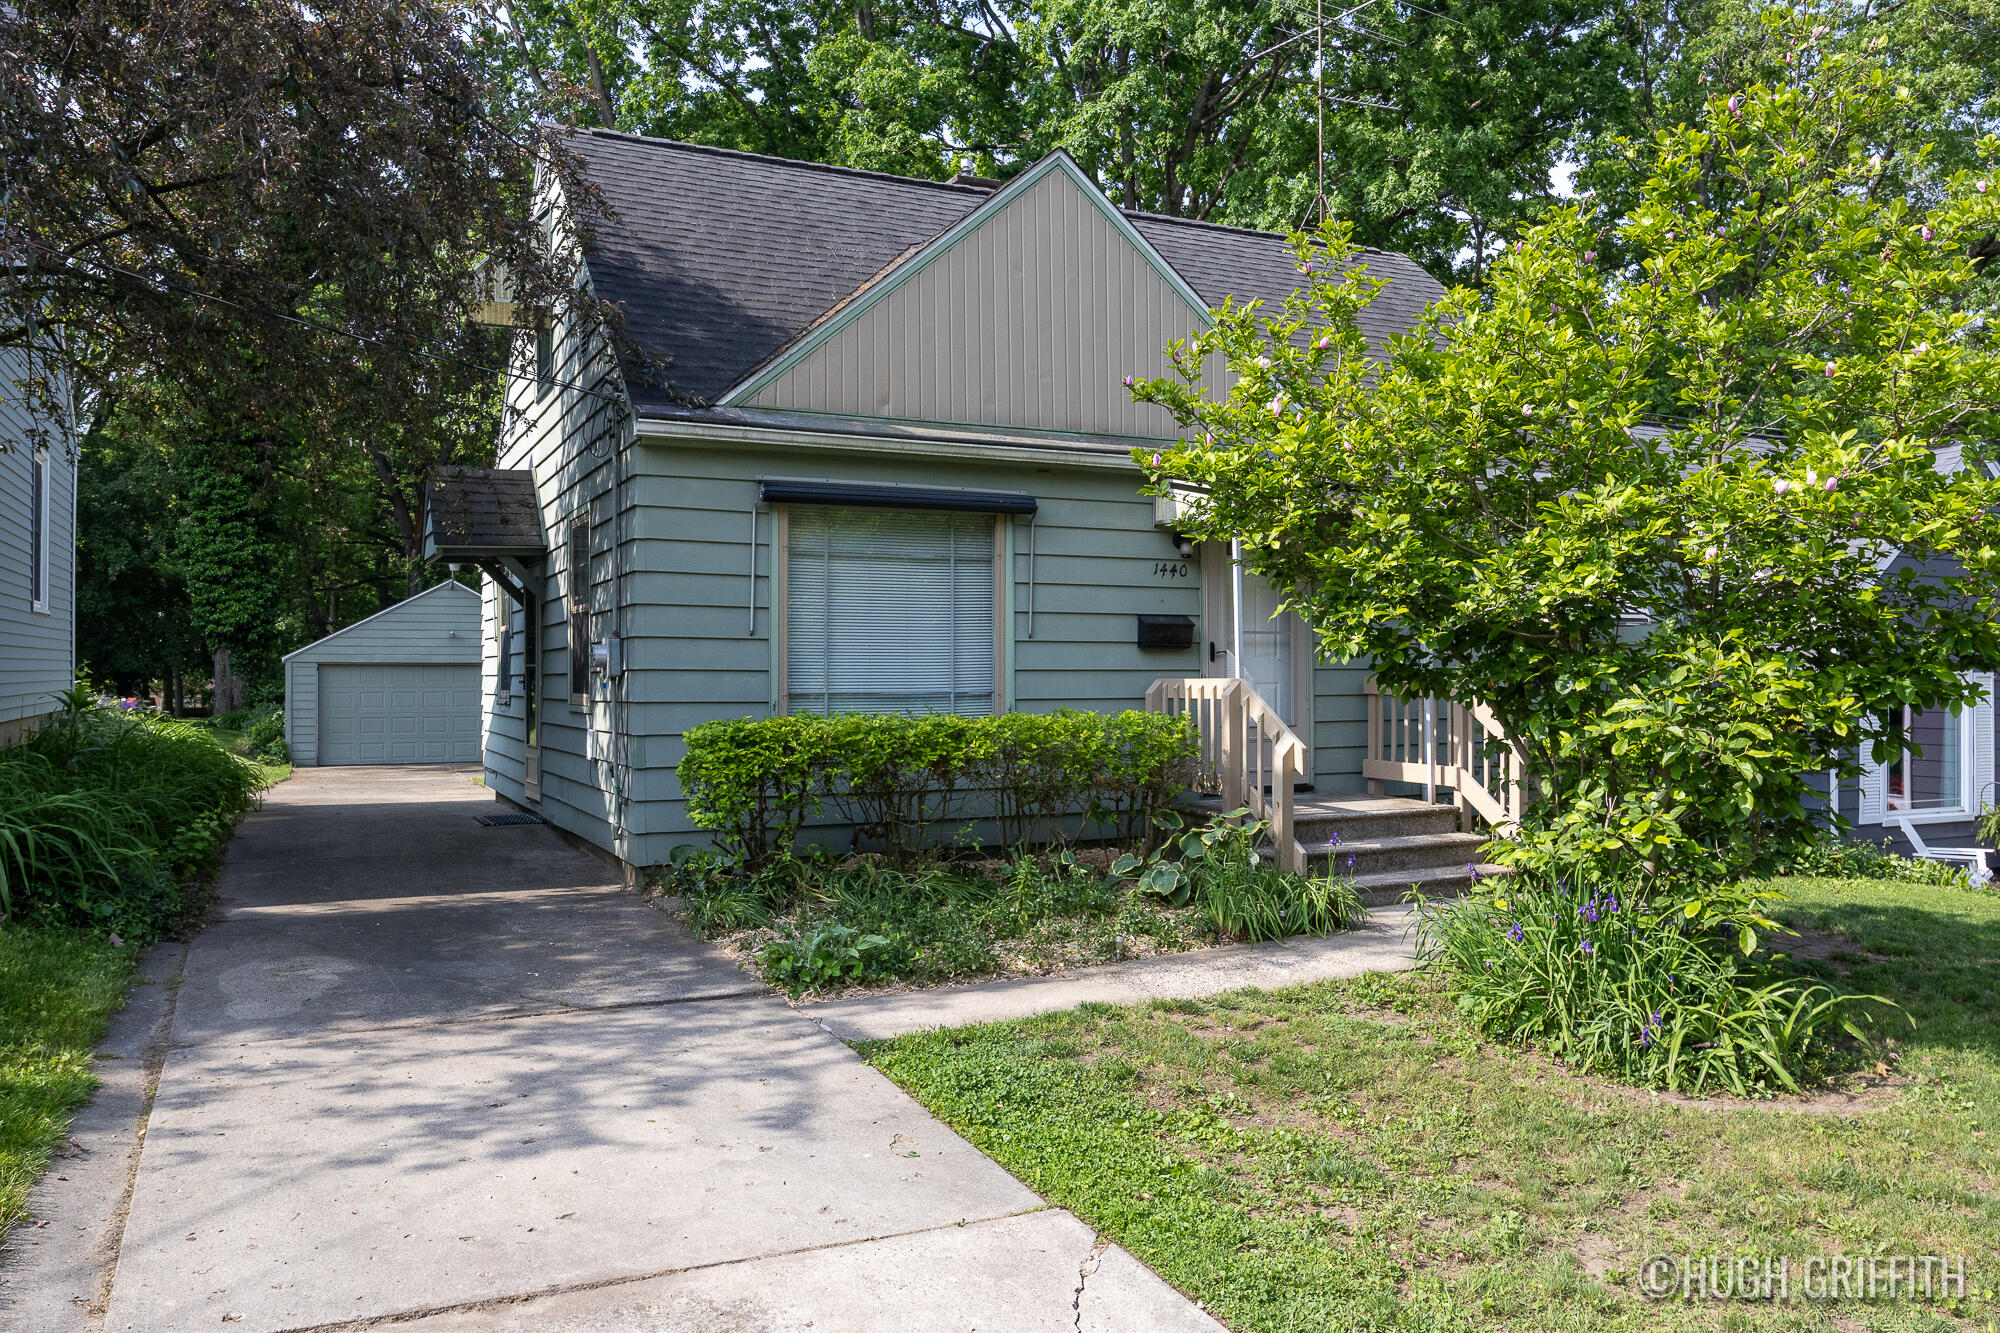
Pending
$250,000
3
bds
|
3
ba
|
1,381
sqft
|
built
1951
1440 Linwood St SE, Grand Rapids, MI 49507
$-121
Cash flow
-2.5%
Cash-on-Cash Return
5.6%
Cap rate
0.8%
Rent to Value Ratio
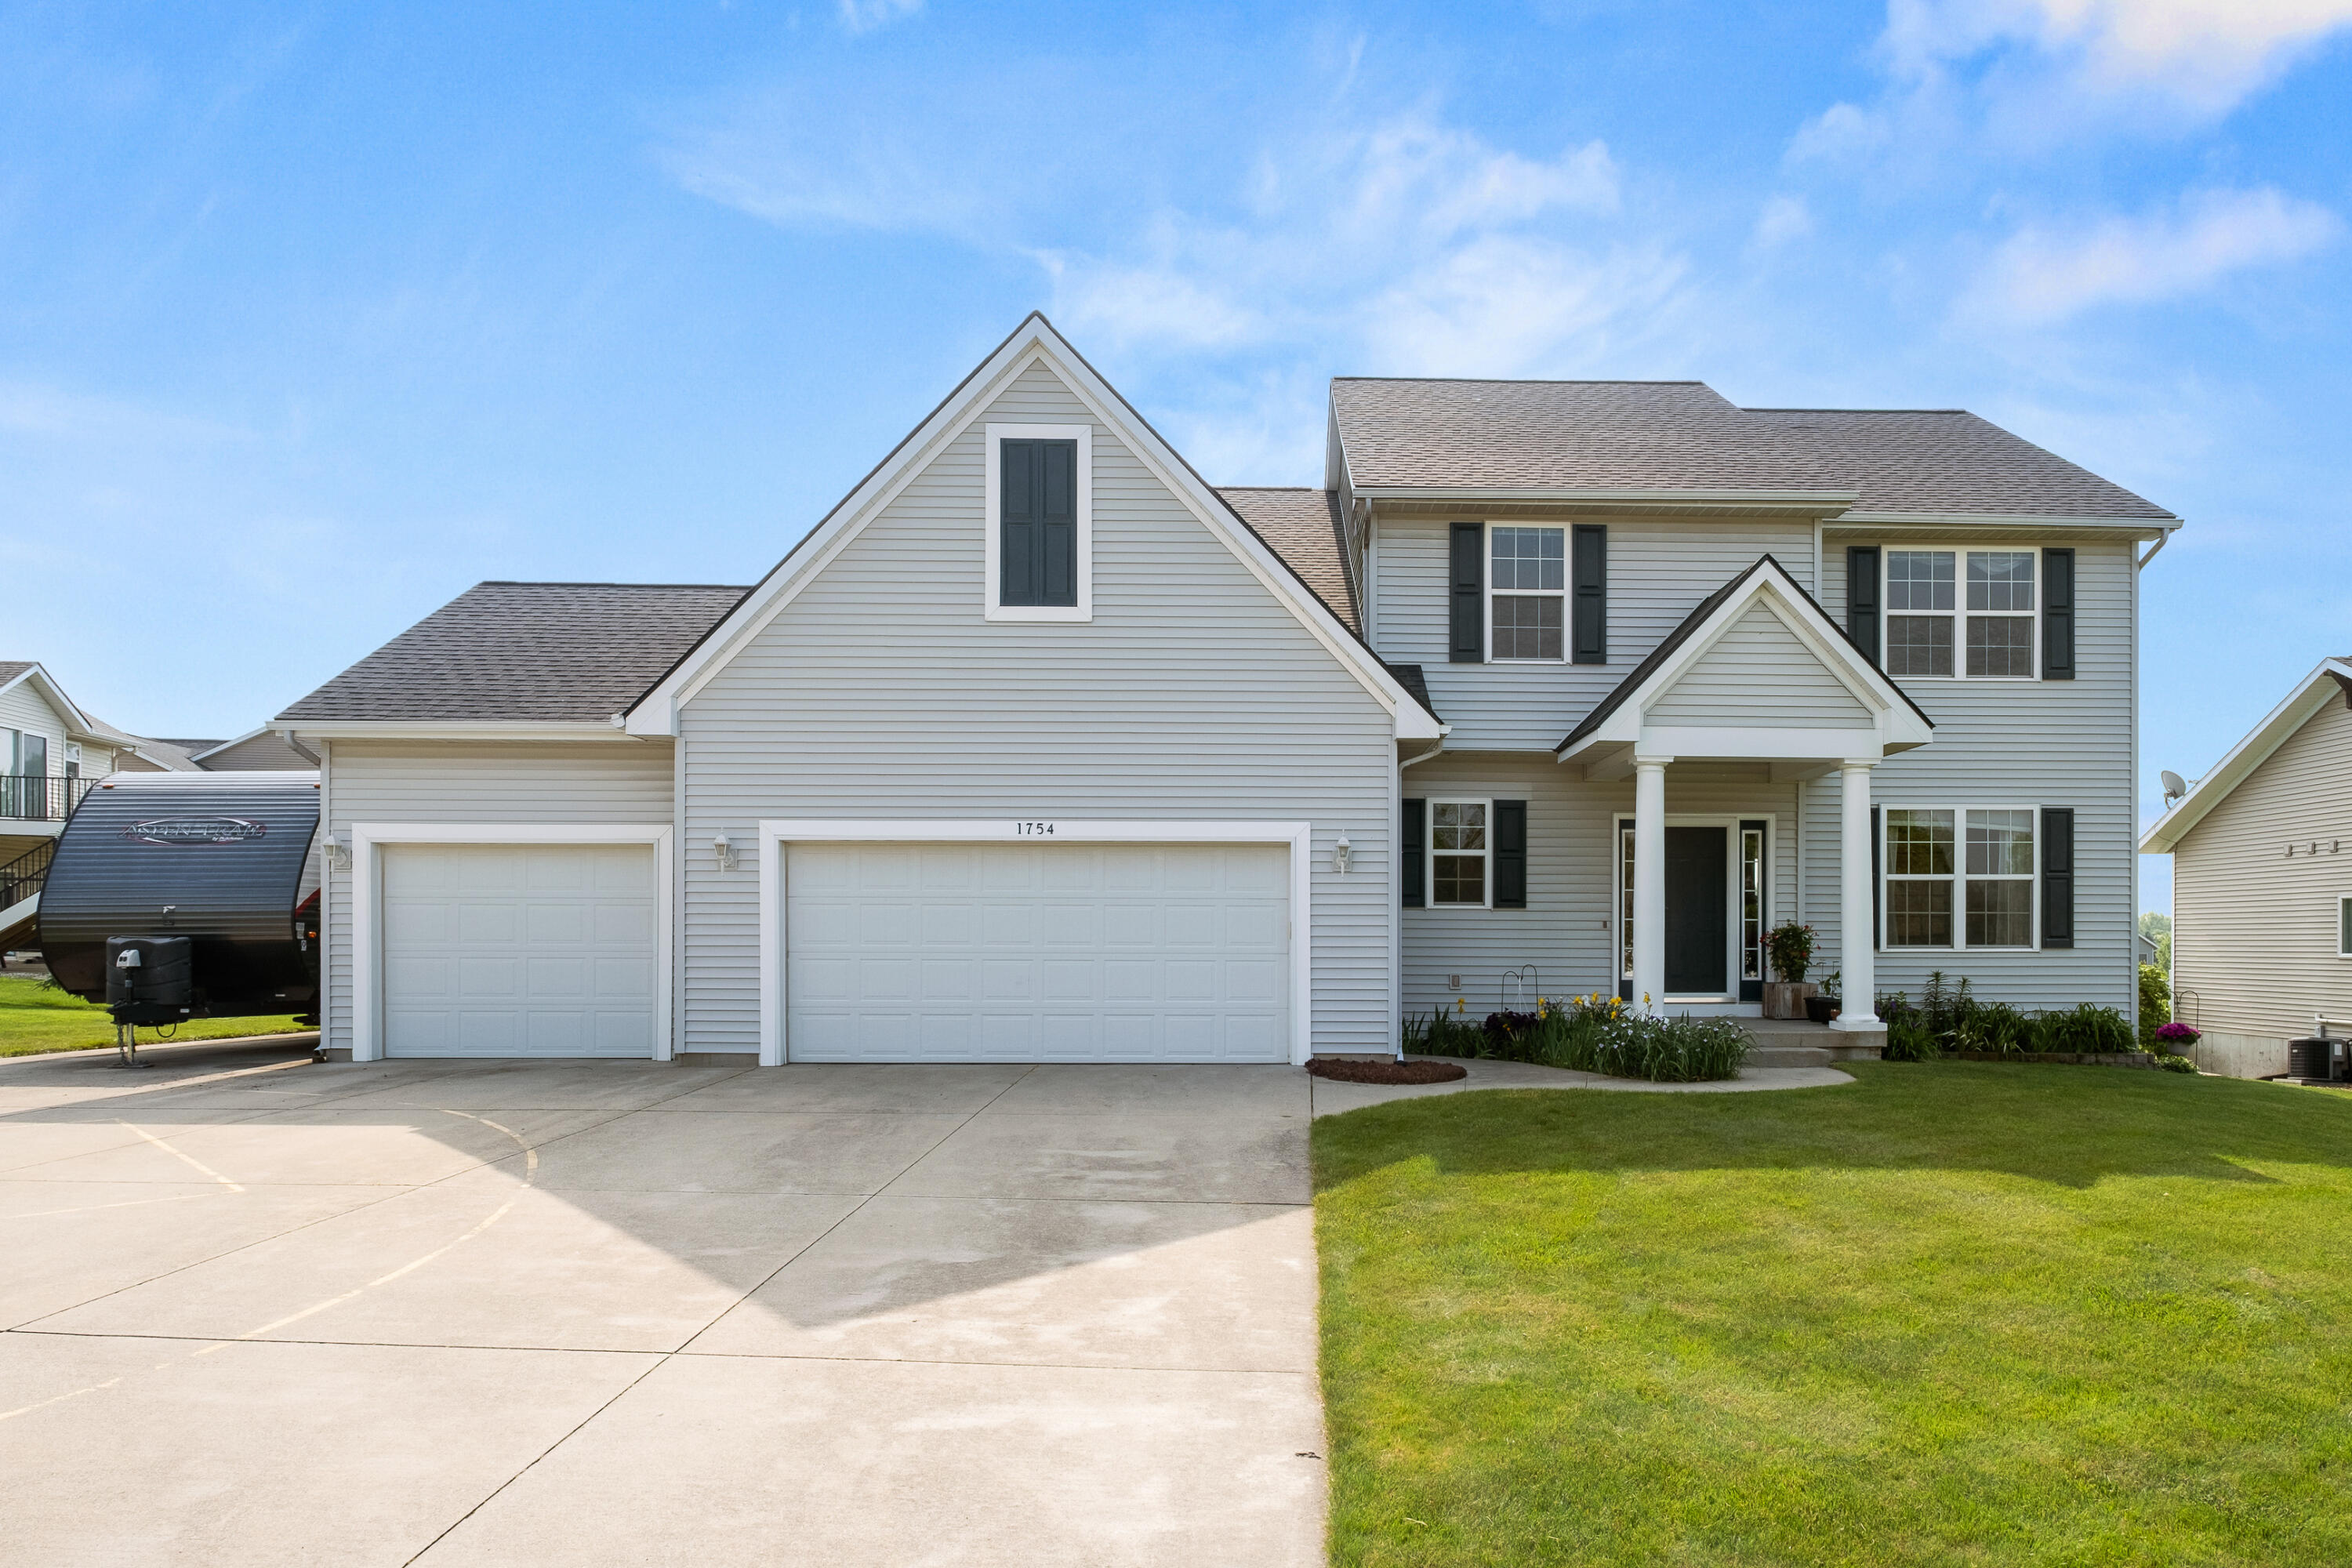
Active
$534,900
5
bds
|
4
ba
|
3,472
sqft
|
built
2004
1754 Hightree Dr SW, Byron Center, MI 49315
$-985
Cash flow
-9.6%
Cash-on-Cash Return
3.9%
Cap rate
0.6%
Rent to Value Ratio
Active
$465,000
4
bds
|
3
ba
|
2,949
sqft
|
built
2016
6635 Ramsdell Dr NE, Rockford, MI 49341
$-896
Cash flow
-10.1%
Cash-on-Cash Return
3.8%
Cap rate
0.5%
Rent to Value Ratio

Pending
$389,900
6
bds
|
3
ba
|
3,094
sqft
|
built
1922
1122 Martin Luther King Jr St SE, Grand Rapids, MI 49507
$-684
Cash flow
-9.2%
Cash-on-Cash Return
4.0%
Cap rate
0.6%
Rent to Value Ratio

Pending
$1,009,000
5
bds
|
4
ba
|
4,200
sqft
|
built
1997
6526 Ada Dr SE, Ada, MI 49301
$-3,075
Cash flow
-15.9%
Cash-on-Cash Return
2.5%
Cap rate
0.4%
Rent to Value Ratio
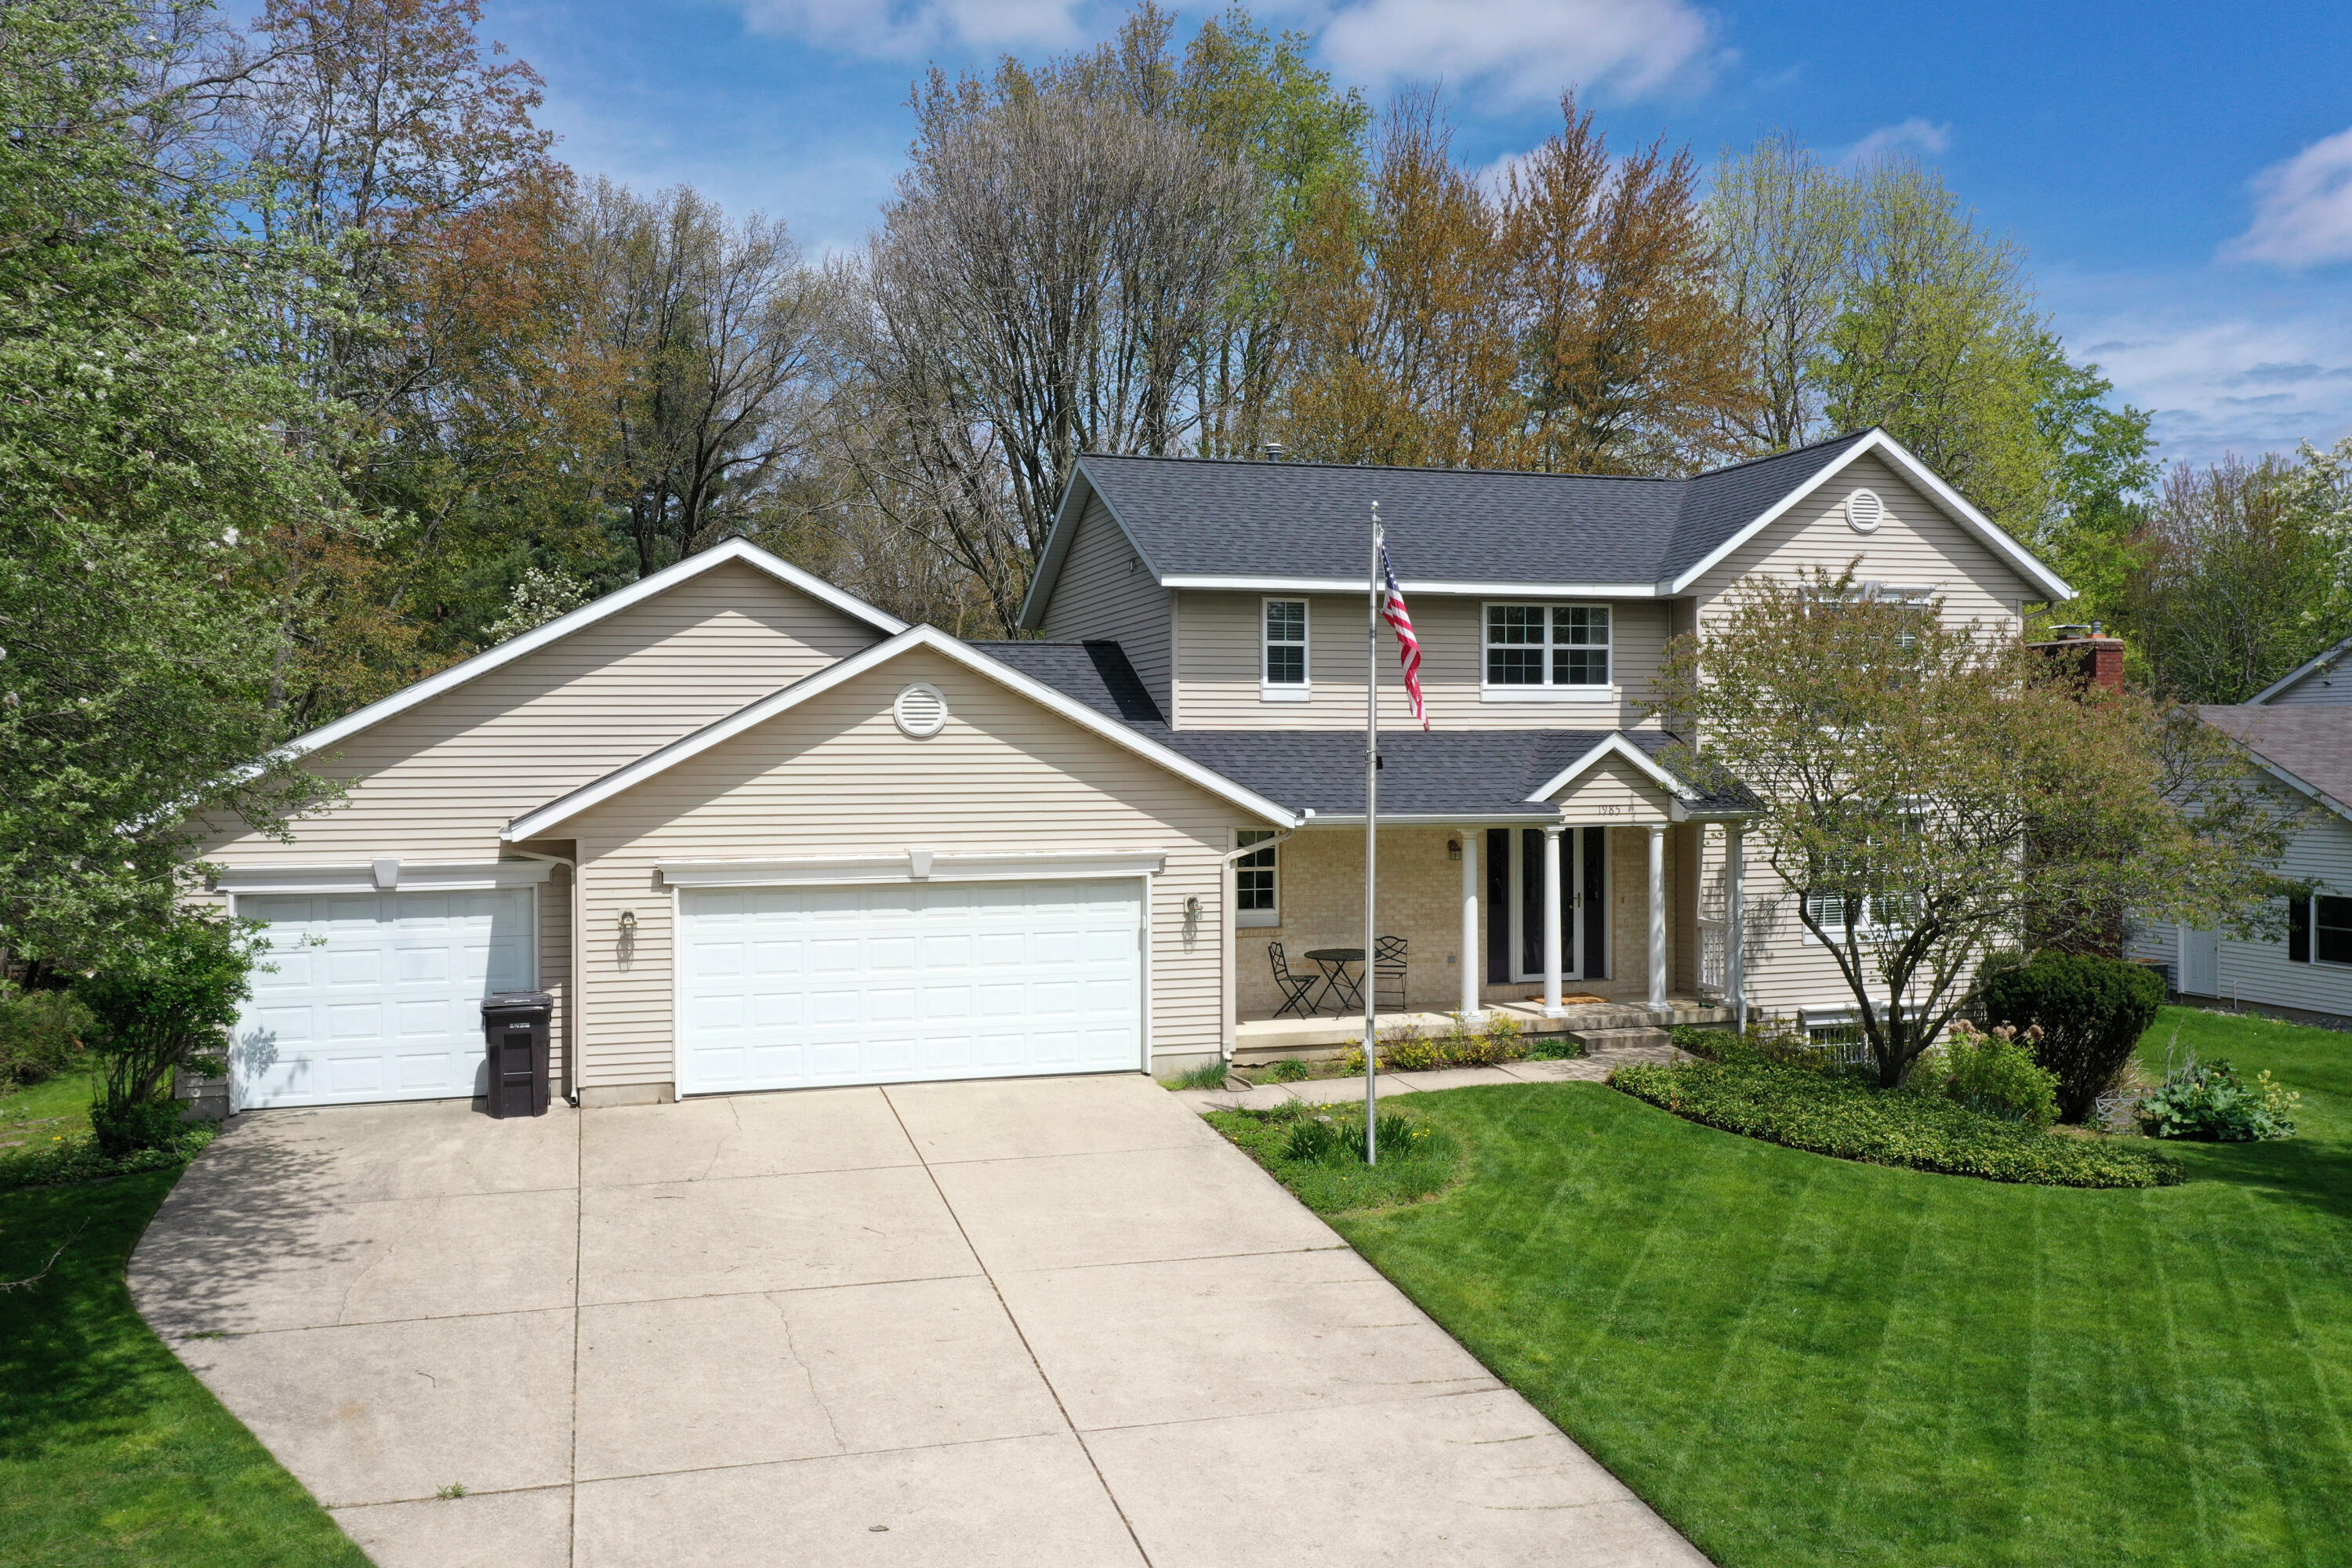
Active
$450,000
4
bds
|
4
ba
|
2,604
sqft
|
built
1996
1985 Glenvale Dr SW, Wyoming, MI 49519
$-873
Cash flow
-10.1%
Cash-on-Cash Return
3.8%
Cap rate
0.6%
Rent to Value Ratio

Pending
$229,900
4
bds
|
2
ba
|
970
sqft
|
built
1920
1169 3rd St NW, Grand Rapids, MI 49504
$-198
Cash flow
-4.5%
Cash-on-Cash Return
5.1%
Cap rate
0.8%
Rent to Value Ratio

Pending
$734,900
5
bds
|
4
ba
|
3,729
sqft
|
built
1975
2605 Shadowbrook Dr SE, Grand Rapids, MI 49546
$-1,662
Cash flow
-11.8%
Cash-on-Cash Return
3.4%
Cap rate
0.5%
Rent to Value Ratio
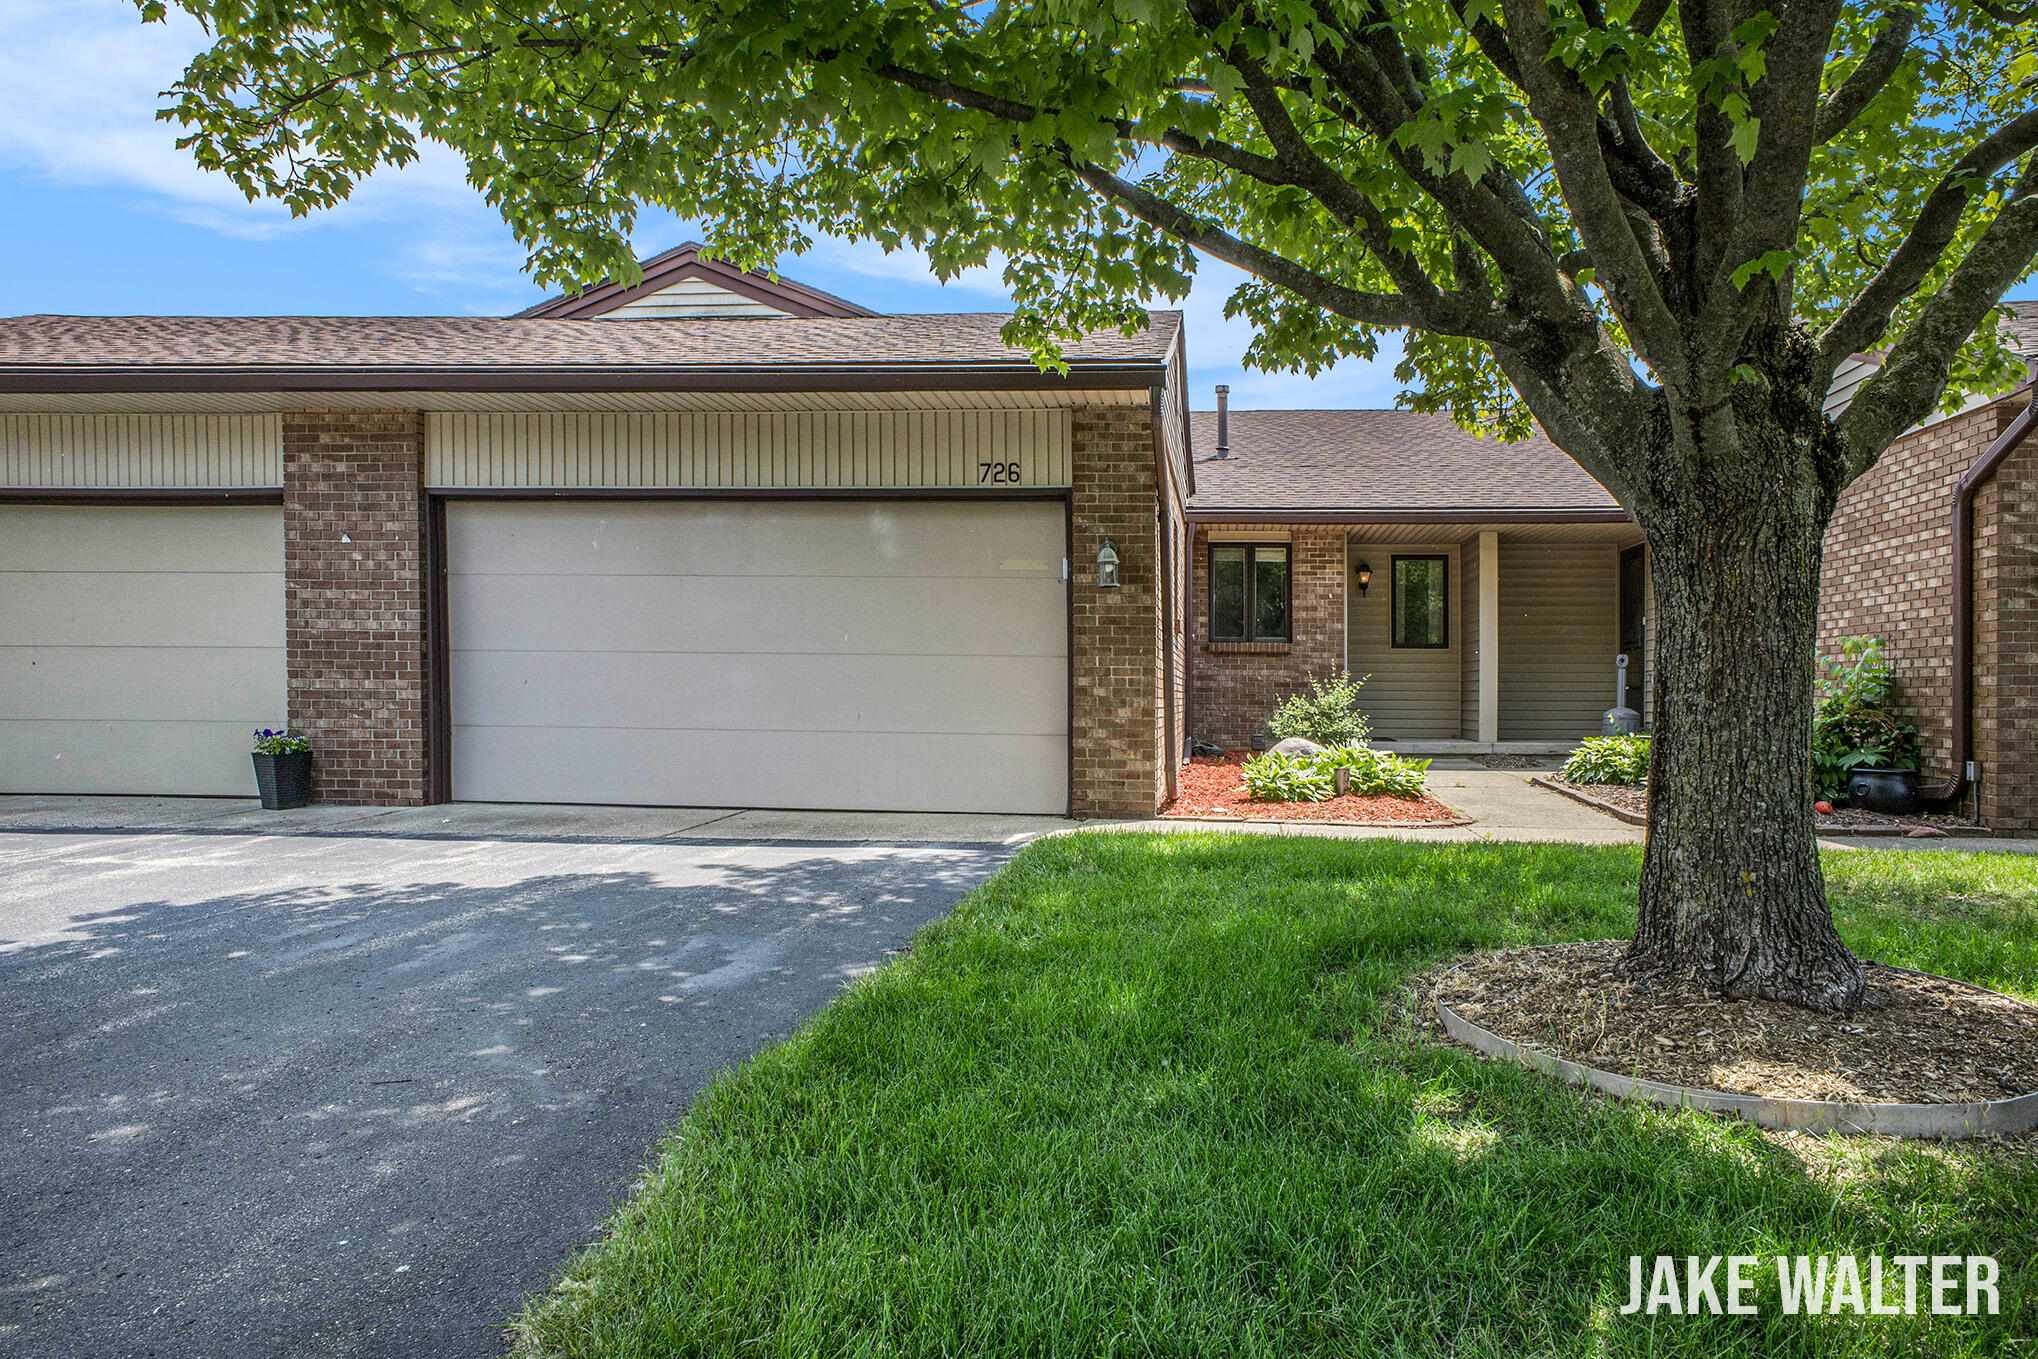
Pending
$289,900
2
bds
|
2
ba
|
1,728
sqft
|
built
1986
726 Gardenview Dr SW, Byron Center, MI 49315
$-1,079
Cash flow
-19.4%
Cash-on-Cash Return
1.7%
Cap rate
0.6%
Rent to Value Ratio
Active
$175,000
2
bds
|
1
ba
|
850
sqft
|
built
1949
2525 Woodward Ave SW, Wyoming, MI 49509
$91
Cash flow
2.7%
Cash-on-Cash Return
6.8%
Cap rate
0.9%
Rent to Value Ratio
Active
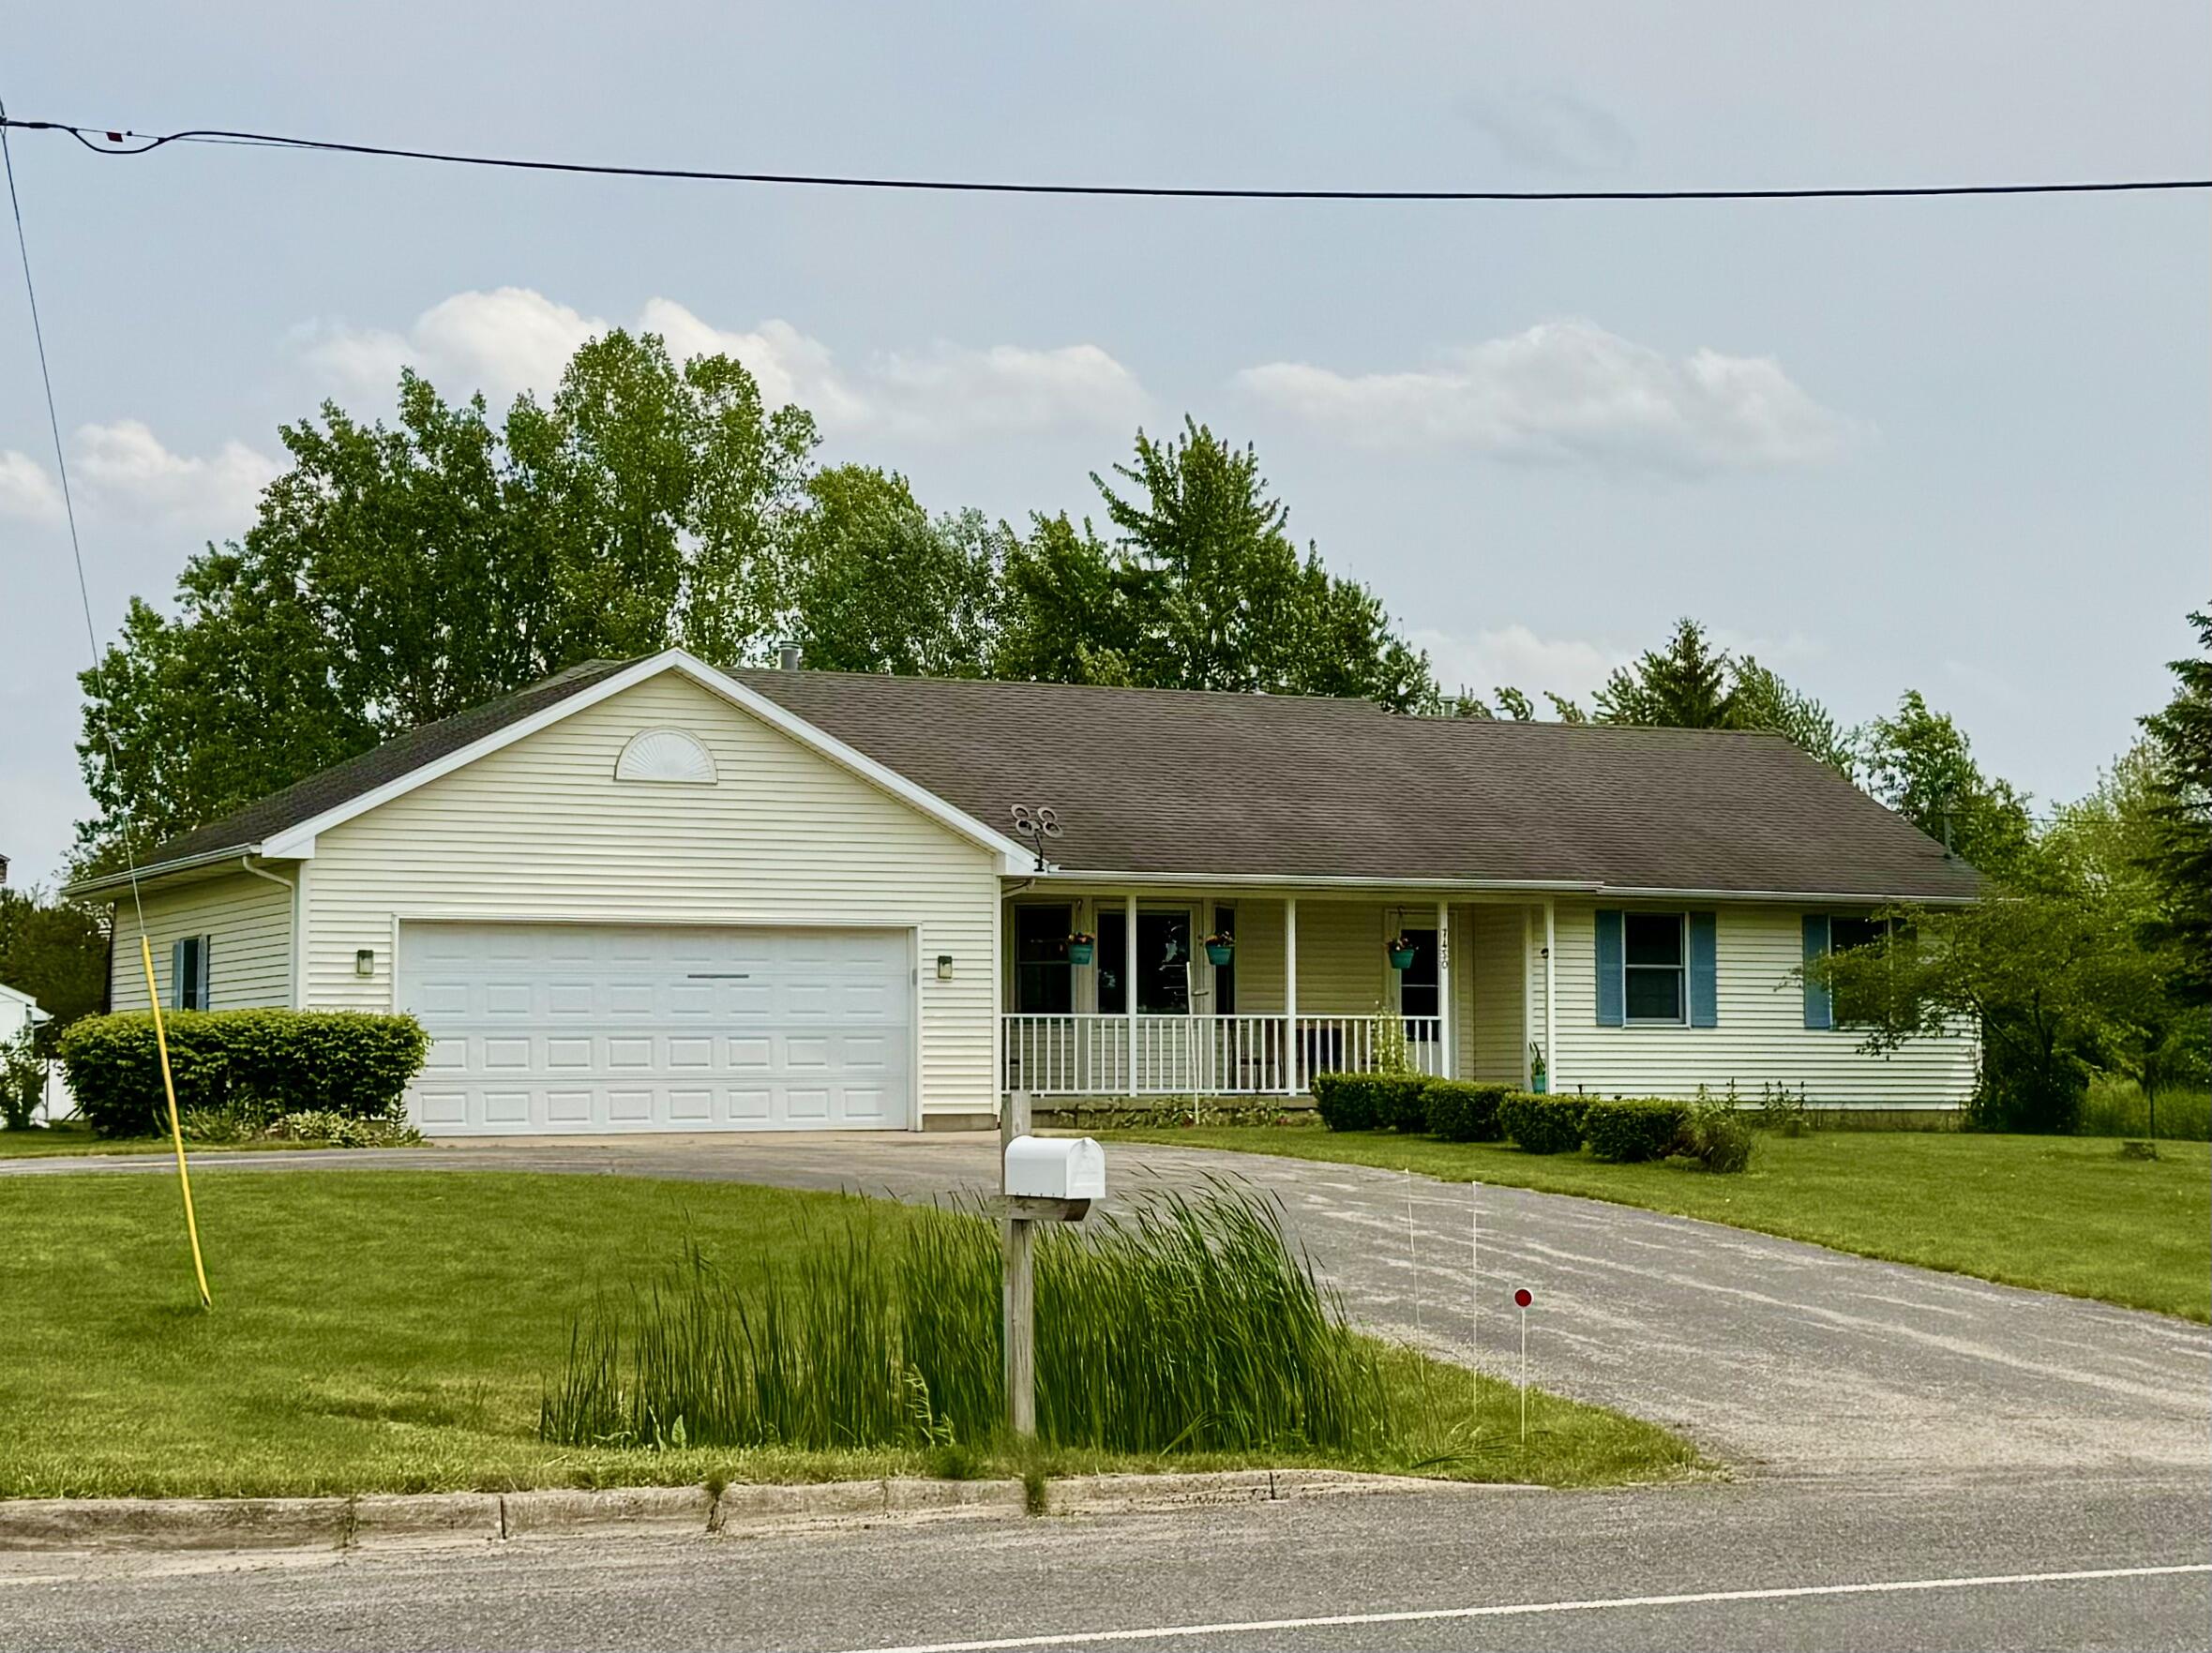
$394,900
3
bds
|
3
ba
|
1,456
sqft
|
built
2000
7450 Hanna Lake Ave SE, Caledonia, MI 49316
$-622
Cash flow
-8.2%
Cash-on-Cash Return
4.3%
Cap rate
0.6%
Rent to Value Ratio
Active
$569,900
4
bds
|
3
ba
|
3,336
sqft
|
built
2001
3916 Grand River Dr NE, Grand Rapids, MI 49525
$-1,280
Cash flow
-11.7%
Cash-on-Cash Return
3.5%
Cap rate
0.6%
Rent to Value Ratio

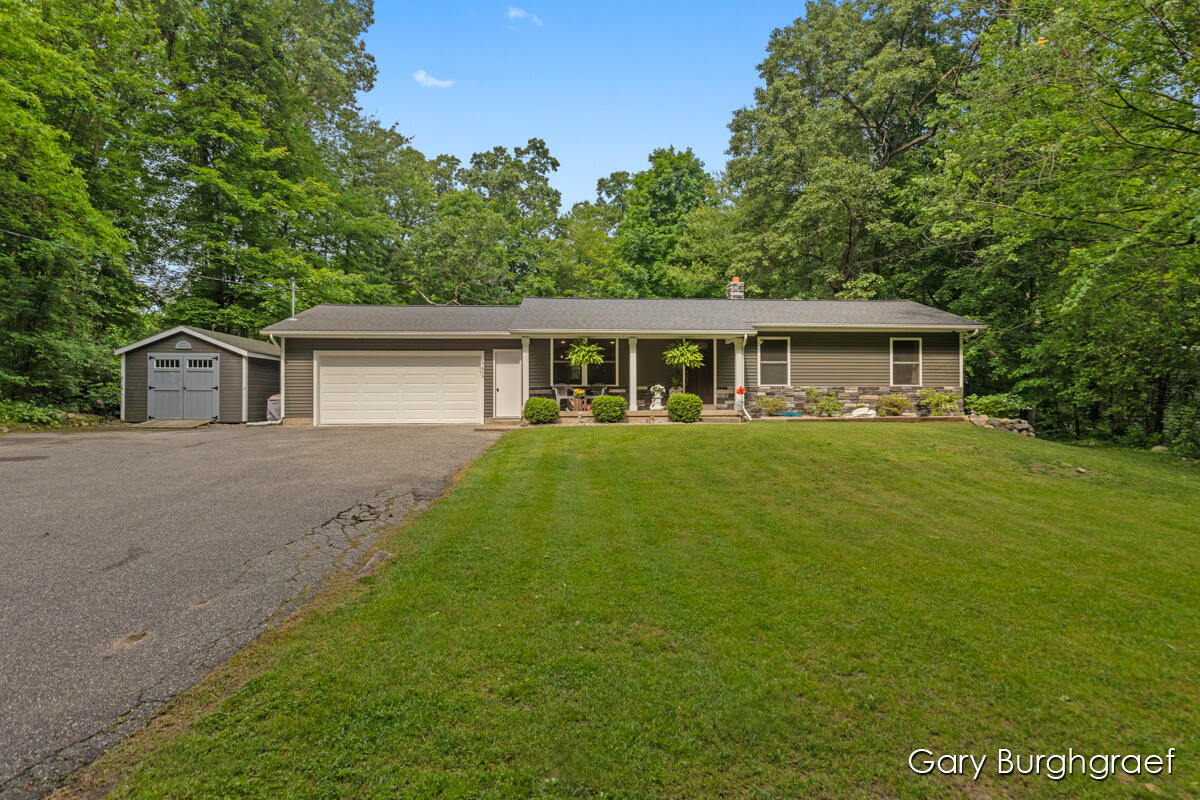
Active
$359,000
bds
|
0
ba
|
0
sqft
|
built
1972
8755 Belding Rd NE, Rockford, MI 49341
$-634
Cash flow
-9.2%
Cash-on-Cash Return
4.0%
Cap rate
0.7%
Rent to Value Ratio
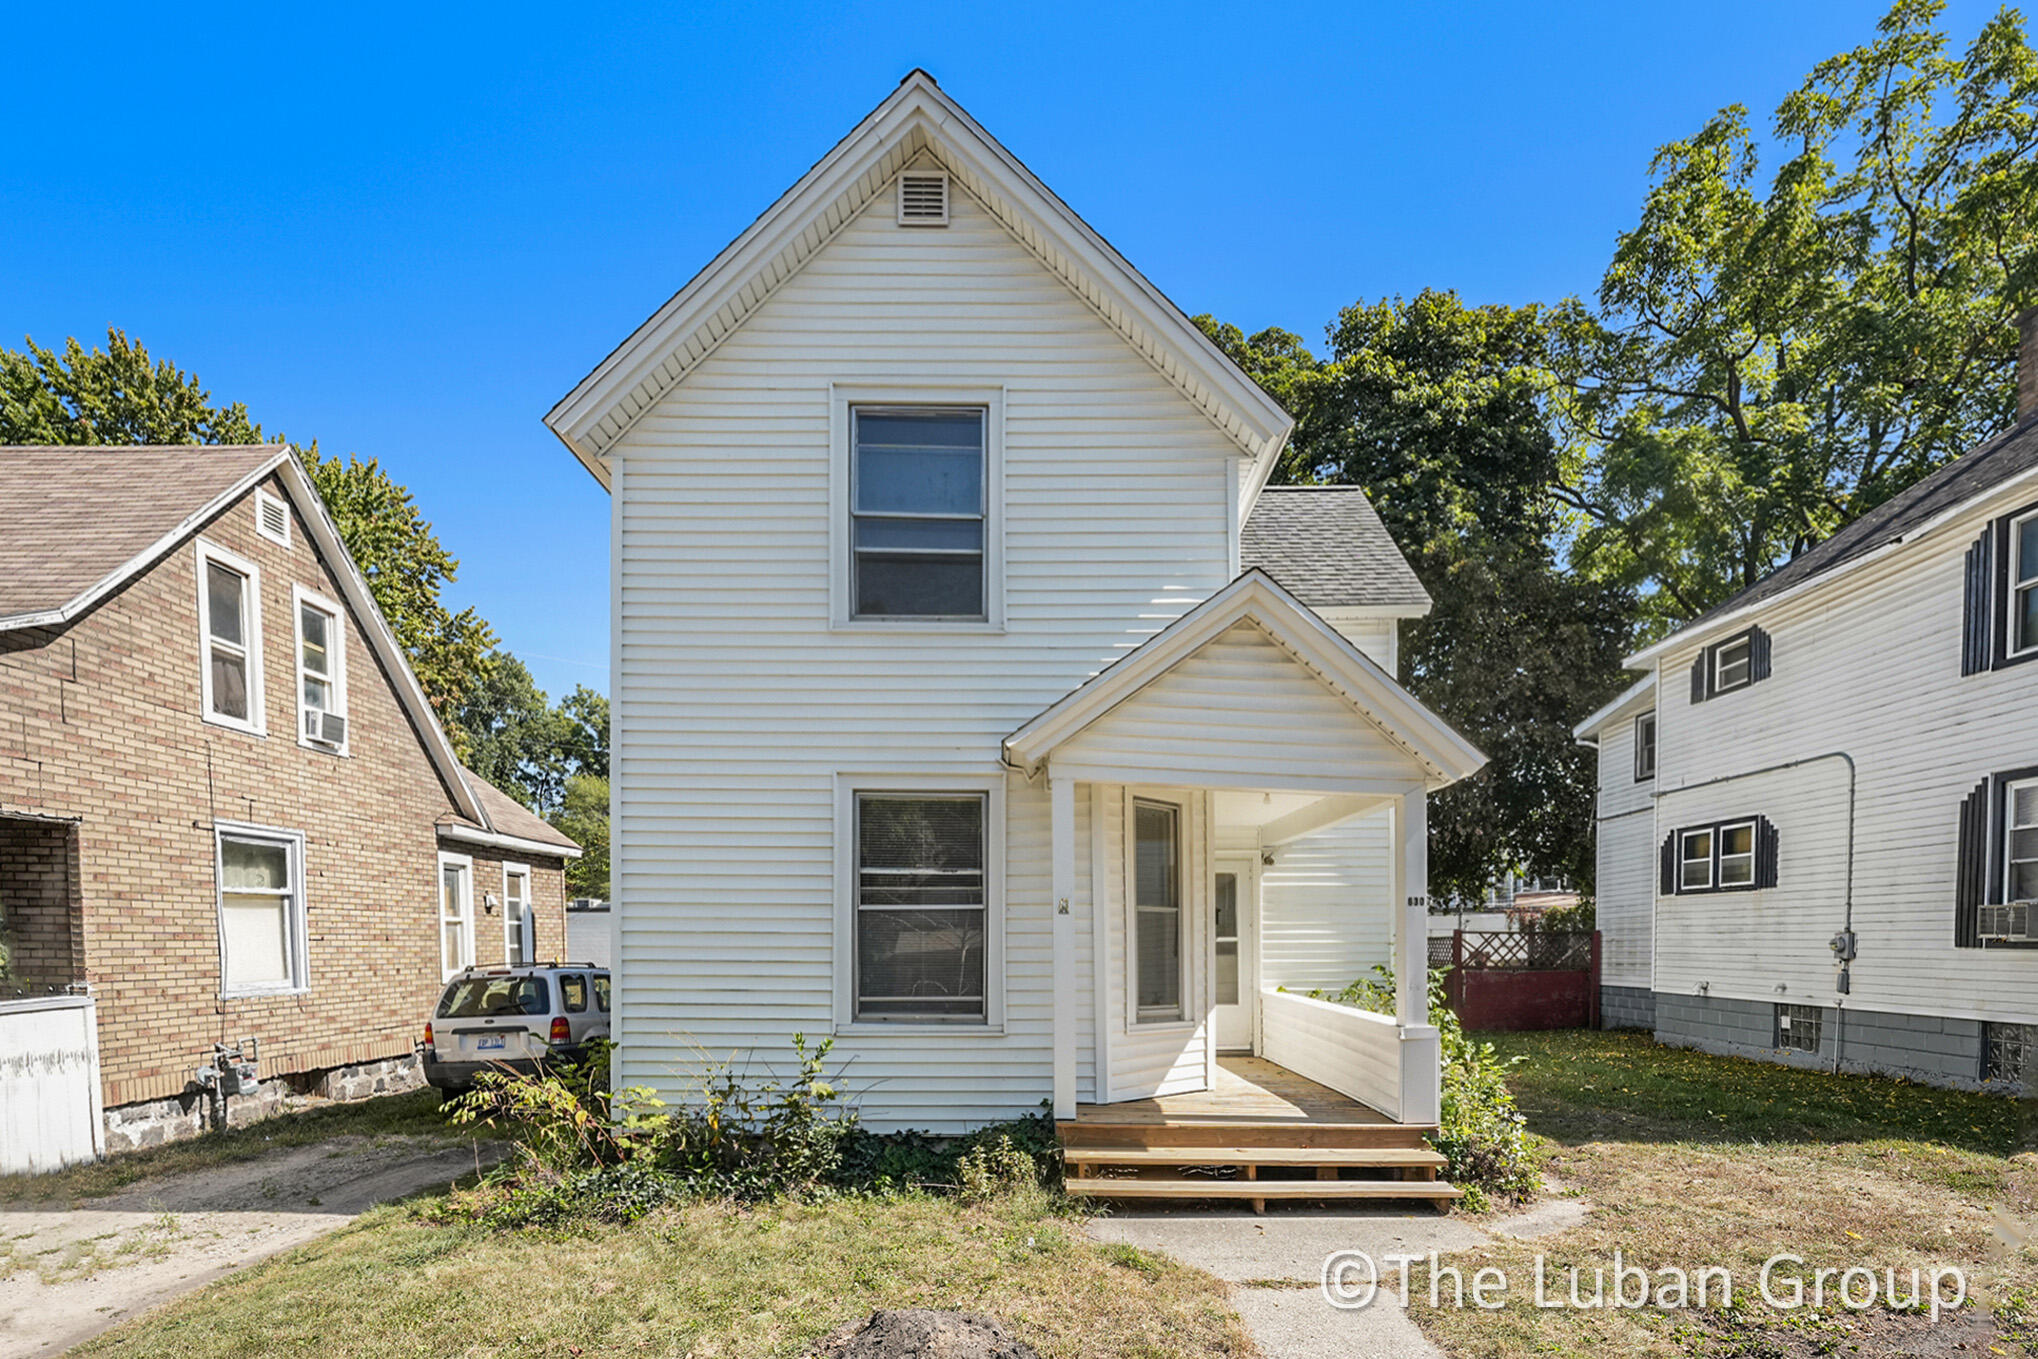
Active
$229,900
4
bds
|
1
ba
|
1,217
sqft
|
built
1860
630 Prospect Ave NE, Grand Rapids, MI 49503
$-20
Cash flow
-0.5%
Cash-on-Cash Return
6.0%
Cap rate
0.8%
Rent to Value Ratio
Pending
$200,000
4
bds
|
3
ba
|
1,675
sqft
|
built
1900
2110 Saint Charles Ave SW, Grand Rapids, MI 49507
$64
Cash flow
1.7%
Cash-on-Cash Return
6.5%
Cap rate
0.9%
Rent to Value Ratio
Active
$799,000
4
bds
|
4
ba
|
3,874
sqft
|
built
2006
10245 Lincoln Lake Rd NE, Greenville, MI 48838
$-2,611
Cash flow
-17.0%
Cash-on-Cash Return
2.2%
Cap rate
0.4%
Rent to Value Ratio
Pending
$349,900
2
bds
|
3
ba
|
2,163
sqft
|
built
2018
158 Brewer Park Cir, Grand Rapids, MI 49548
$-651
Cash flow
-9.7%
Cash-on-Cash Return
3.9%
Cap rate
0.7%
Rent to Value Ratio
Active
$239,900
3
bds
|
1
ba
|
1,180
sqft
|
built
1926
1714 Kalamazoo Ave SE, Grand Rapids, MI 49507
$-221
Cash flow
-4.8%
Cash-on-Cash Return
5.0%
Cap rate
0.8%
Rent to Value Ratio

Active
$1,500,000
7
bds
|
5
ba
|
7,524
sqft
|
built
1999
6374 Blakely Dr NE, Rockford, MI 49341
$-5,372
Cash flow
-18.7%
Cash-on-Cash Return
1.8%
Cap rate
0.3%
Rent to Value Ratio
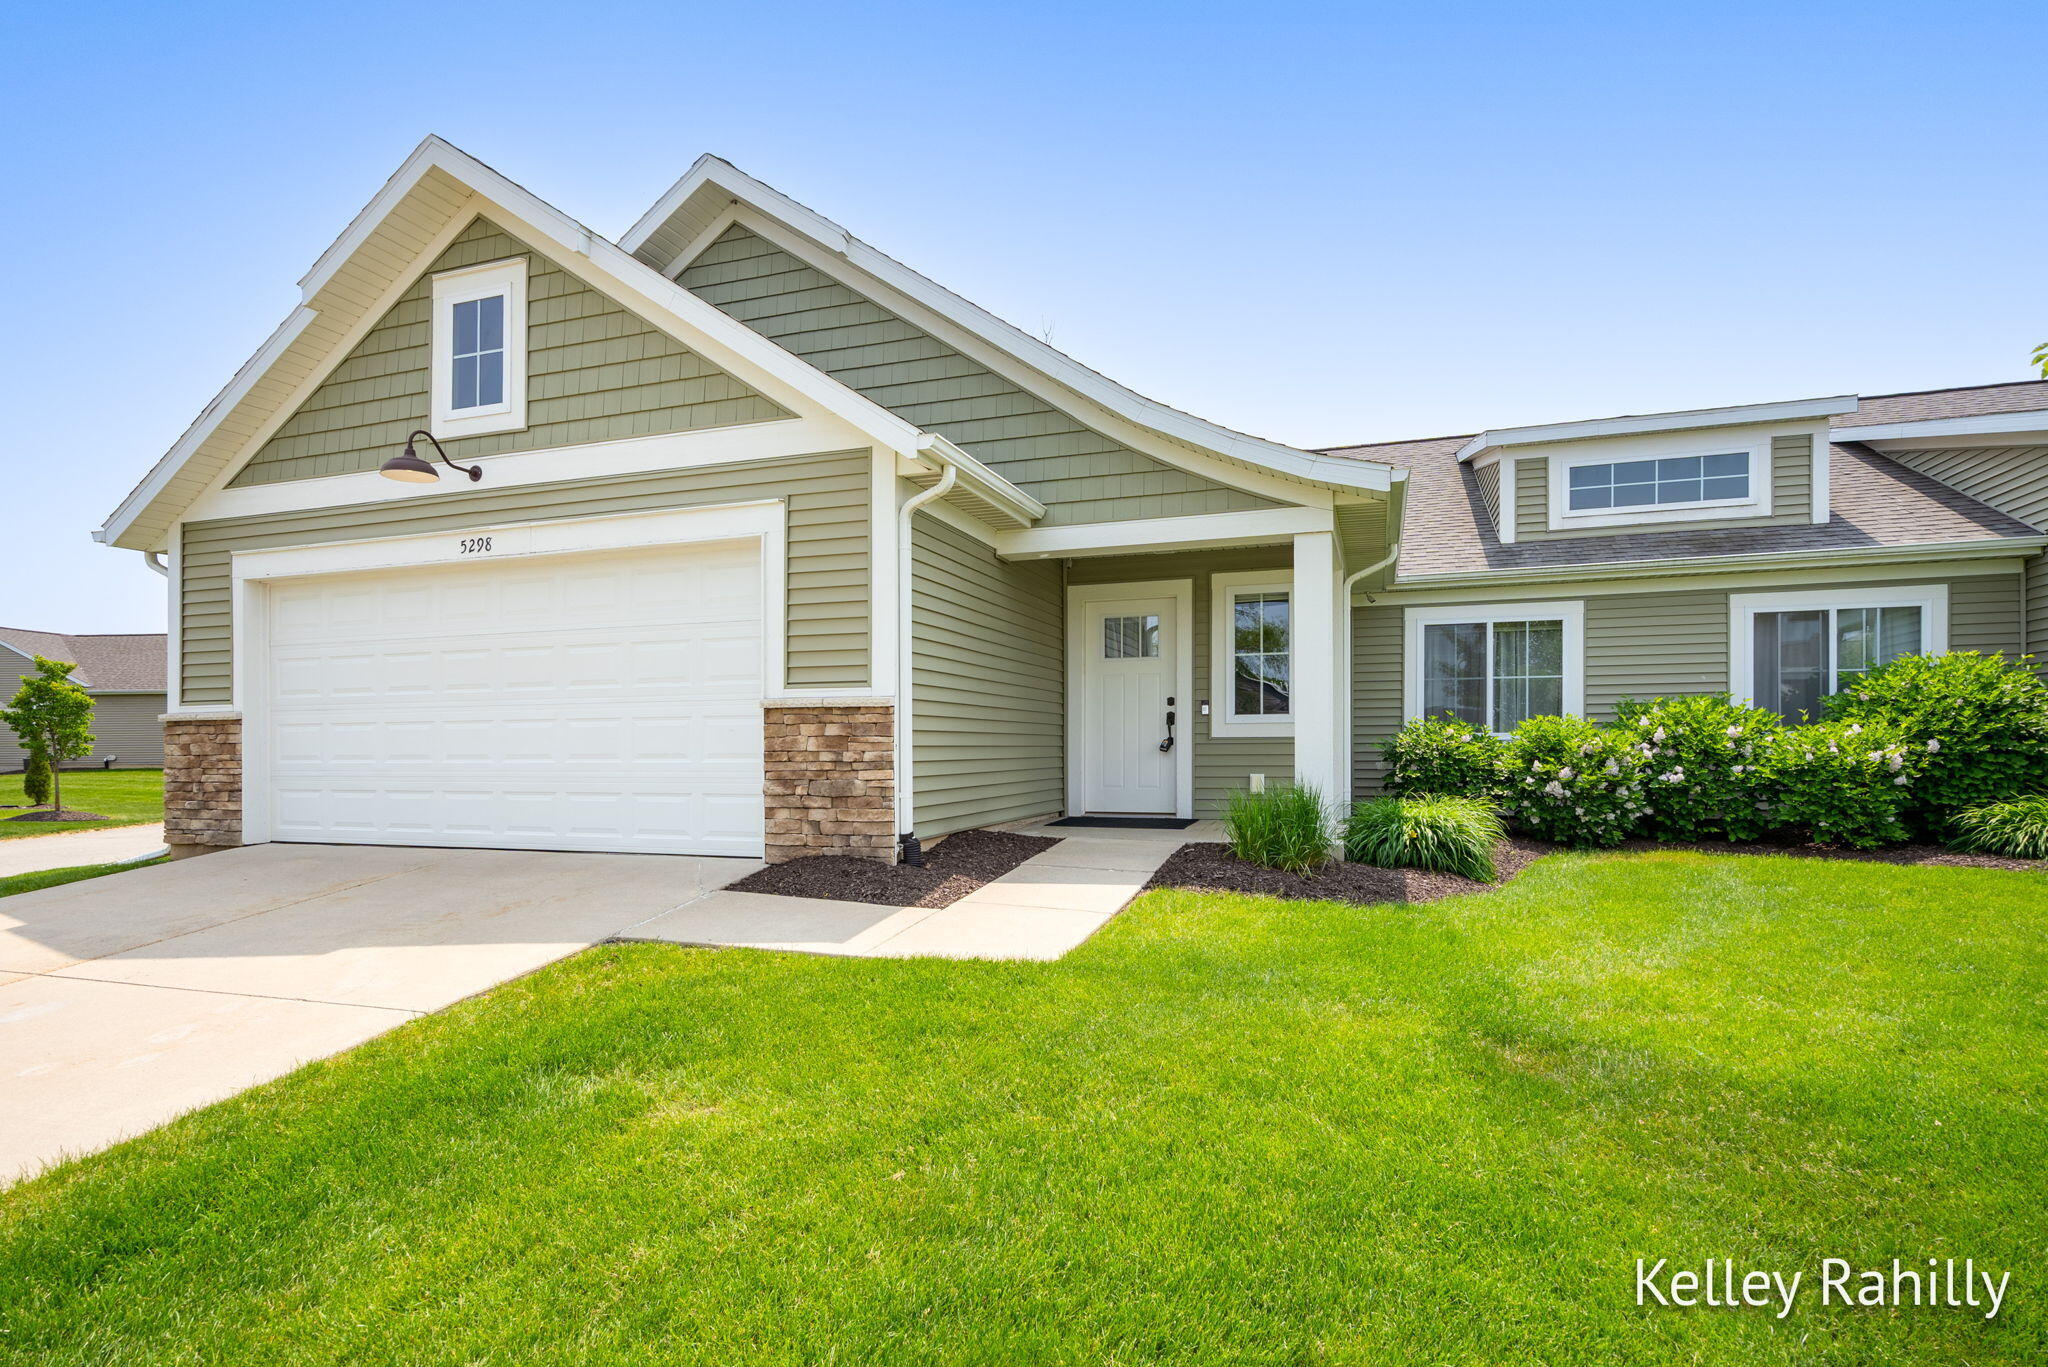
Pending
$359,900
3
bds
|
3
ba
|
2,122
sqft
|
built
2016
5298 Swanwood St SE, Caledonia, MI 49316
$-880
Cash flow
-12.8%
Cash-on-Cash Return
3.2%
Cap rate
0.6%
Rent to Value Ratio
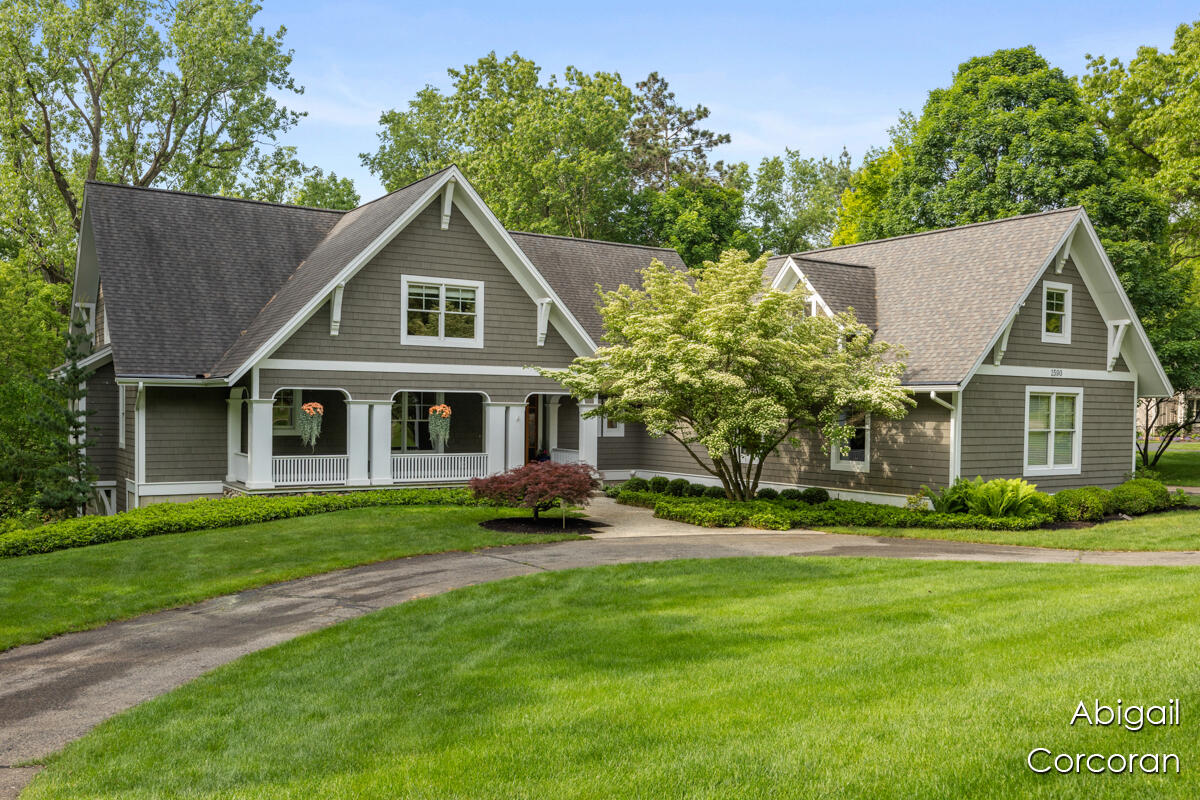
Pending
$1,250,000
5
bds
|
4
ba
|
4,508
sqft
|
built
1999
1590 Foot Hills Trl NE, Ada, MI 49301
$-3,316
Cash flow
-13.8%
Cash-on-Cash Return
3.0%
Cap rate
0.5%
Rent to Value Ratio
Active
$159,900
1
bds
|
1
ba
|
934
sqft
|
built
1999
8508 Jasonville Ct SE, Caledonia, MI 49316
$-204
Cash flow
-6.7%
Cash-on-Cash Return
4.6%
Cap rate
0.9%
Rent to Value Ratio

Active
$519,900
2
bds
|
2
ba
|
1,495
sqft
|
built
2007
335 Bridge St NW, Grand Rapids, MI 49504
$-2,313
Cash flow
-23.2%
Cash-on-Cash Return
0.8%
Cap rate
0.5%
Rent to Value Ratio
Active
$429,900
3
bds
|
2
ba
|
1,837
sqft
|
built
1931
4372 Hunsberger Ave NE, Grand Rapids, MI 49525
$-667
Cash flow
-8.1%
Cash-on-Cash Return
4.3%
Cap rate
0.6%
Rent to Value Ratio
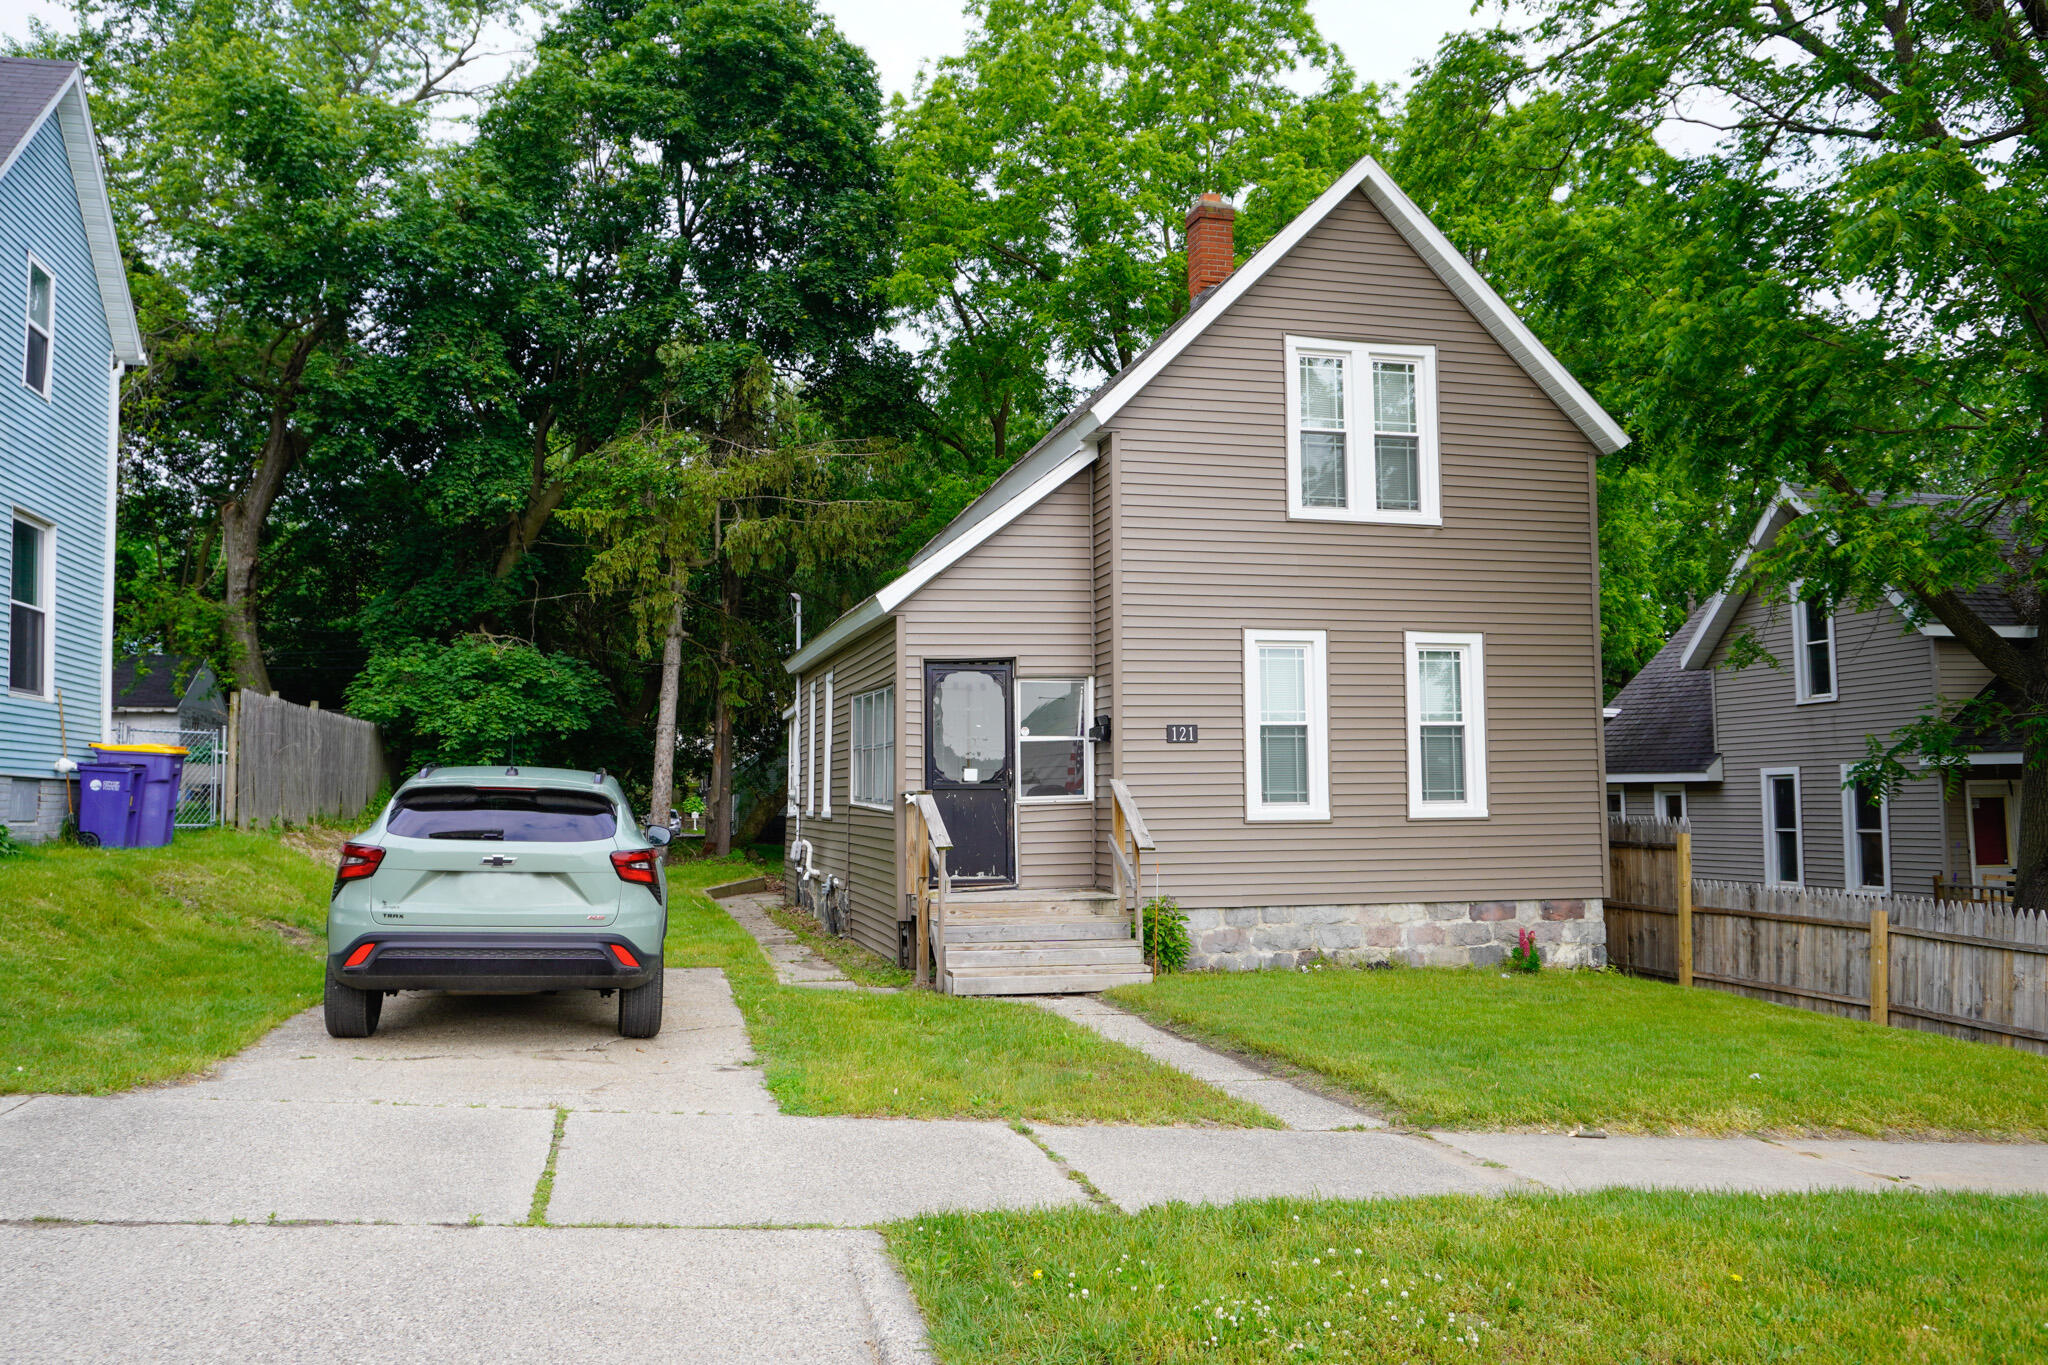
Active
$290,000
3
bds
|
2
ba
|
1,292
sqft
|
built
1885
121 Houseman Ave NE, Grand Rapids, MI 49503
$-419
Cash flow
-7.5%
Cash-on-Cash Return
4.4%
Cap rate
0.6%
Rent to Value Ratio

Active
$269,900
3
bds
|
2
ba
|
1,377
sqft
|
built
1925
1060 Walker Ave NW, Grand Rapids, MI 49504
$-196
Cash flow
-3.8%
Cash-on-Cash Return
5.3%
Cap rate
0.9%
Rent to Value Ratio
Pending
$284,900
2
bds
|
2
ba
|
1,547
sqft
|
built
1940
8354 Kraft Ave SE, Caledonia, MI 49316
$-134
Cash flow
-2.5%
Cash-on-Cash Return
5.6%
Cap rate
0.8%
Rent to Value Ratio