Kent County Investment Properties for Sale
Browse homes for sale and investment properties in Kent County. Refine your search by price, property type, or more.
Best cash flowing properties in Kent County
Pending
$209,900
3
bds
|
1
ba
|
1,152
sqft
|
built
1948
36 Peony St SW, Grand Rapids, MI 49548
$184
Cash flow
4.6%
Cash-on-Cash Return
7.2%
Cap rate
1.0%
Rent to Value Ratio

Pending
$219,900
3
bds
|
2
ba
|
1,181
sqft
|
built
1905
114 Dale St NE, Grand Rapids, MI 49505
$106
Cash flow
2.5%
Cash-on-Cash Return
6.7%
Cap rate
0.9%
Rent to Value Ratio
480 out of 649 properties for sale in Kent County
Limited Results Shown
Create a free account, or log in to reveal all property listings and enjoy the complete experience.
Pending
$219,900
3
bds
|
2
ba
|
1,181
sqft
|
built
1905
114 Dale St NE, Grand Rapids, MI 49505
$106
Cash flow
2.5%
Cash-on-Cash Return
6.7%
Cap rate
0.9%
Rent to Value Ratio
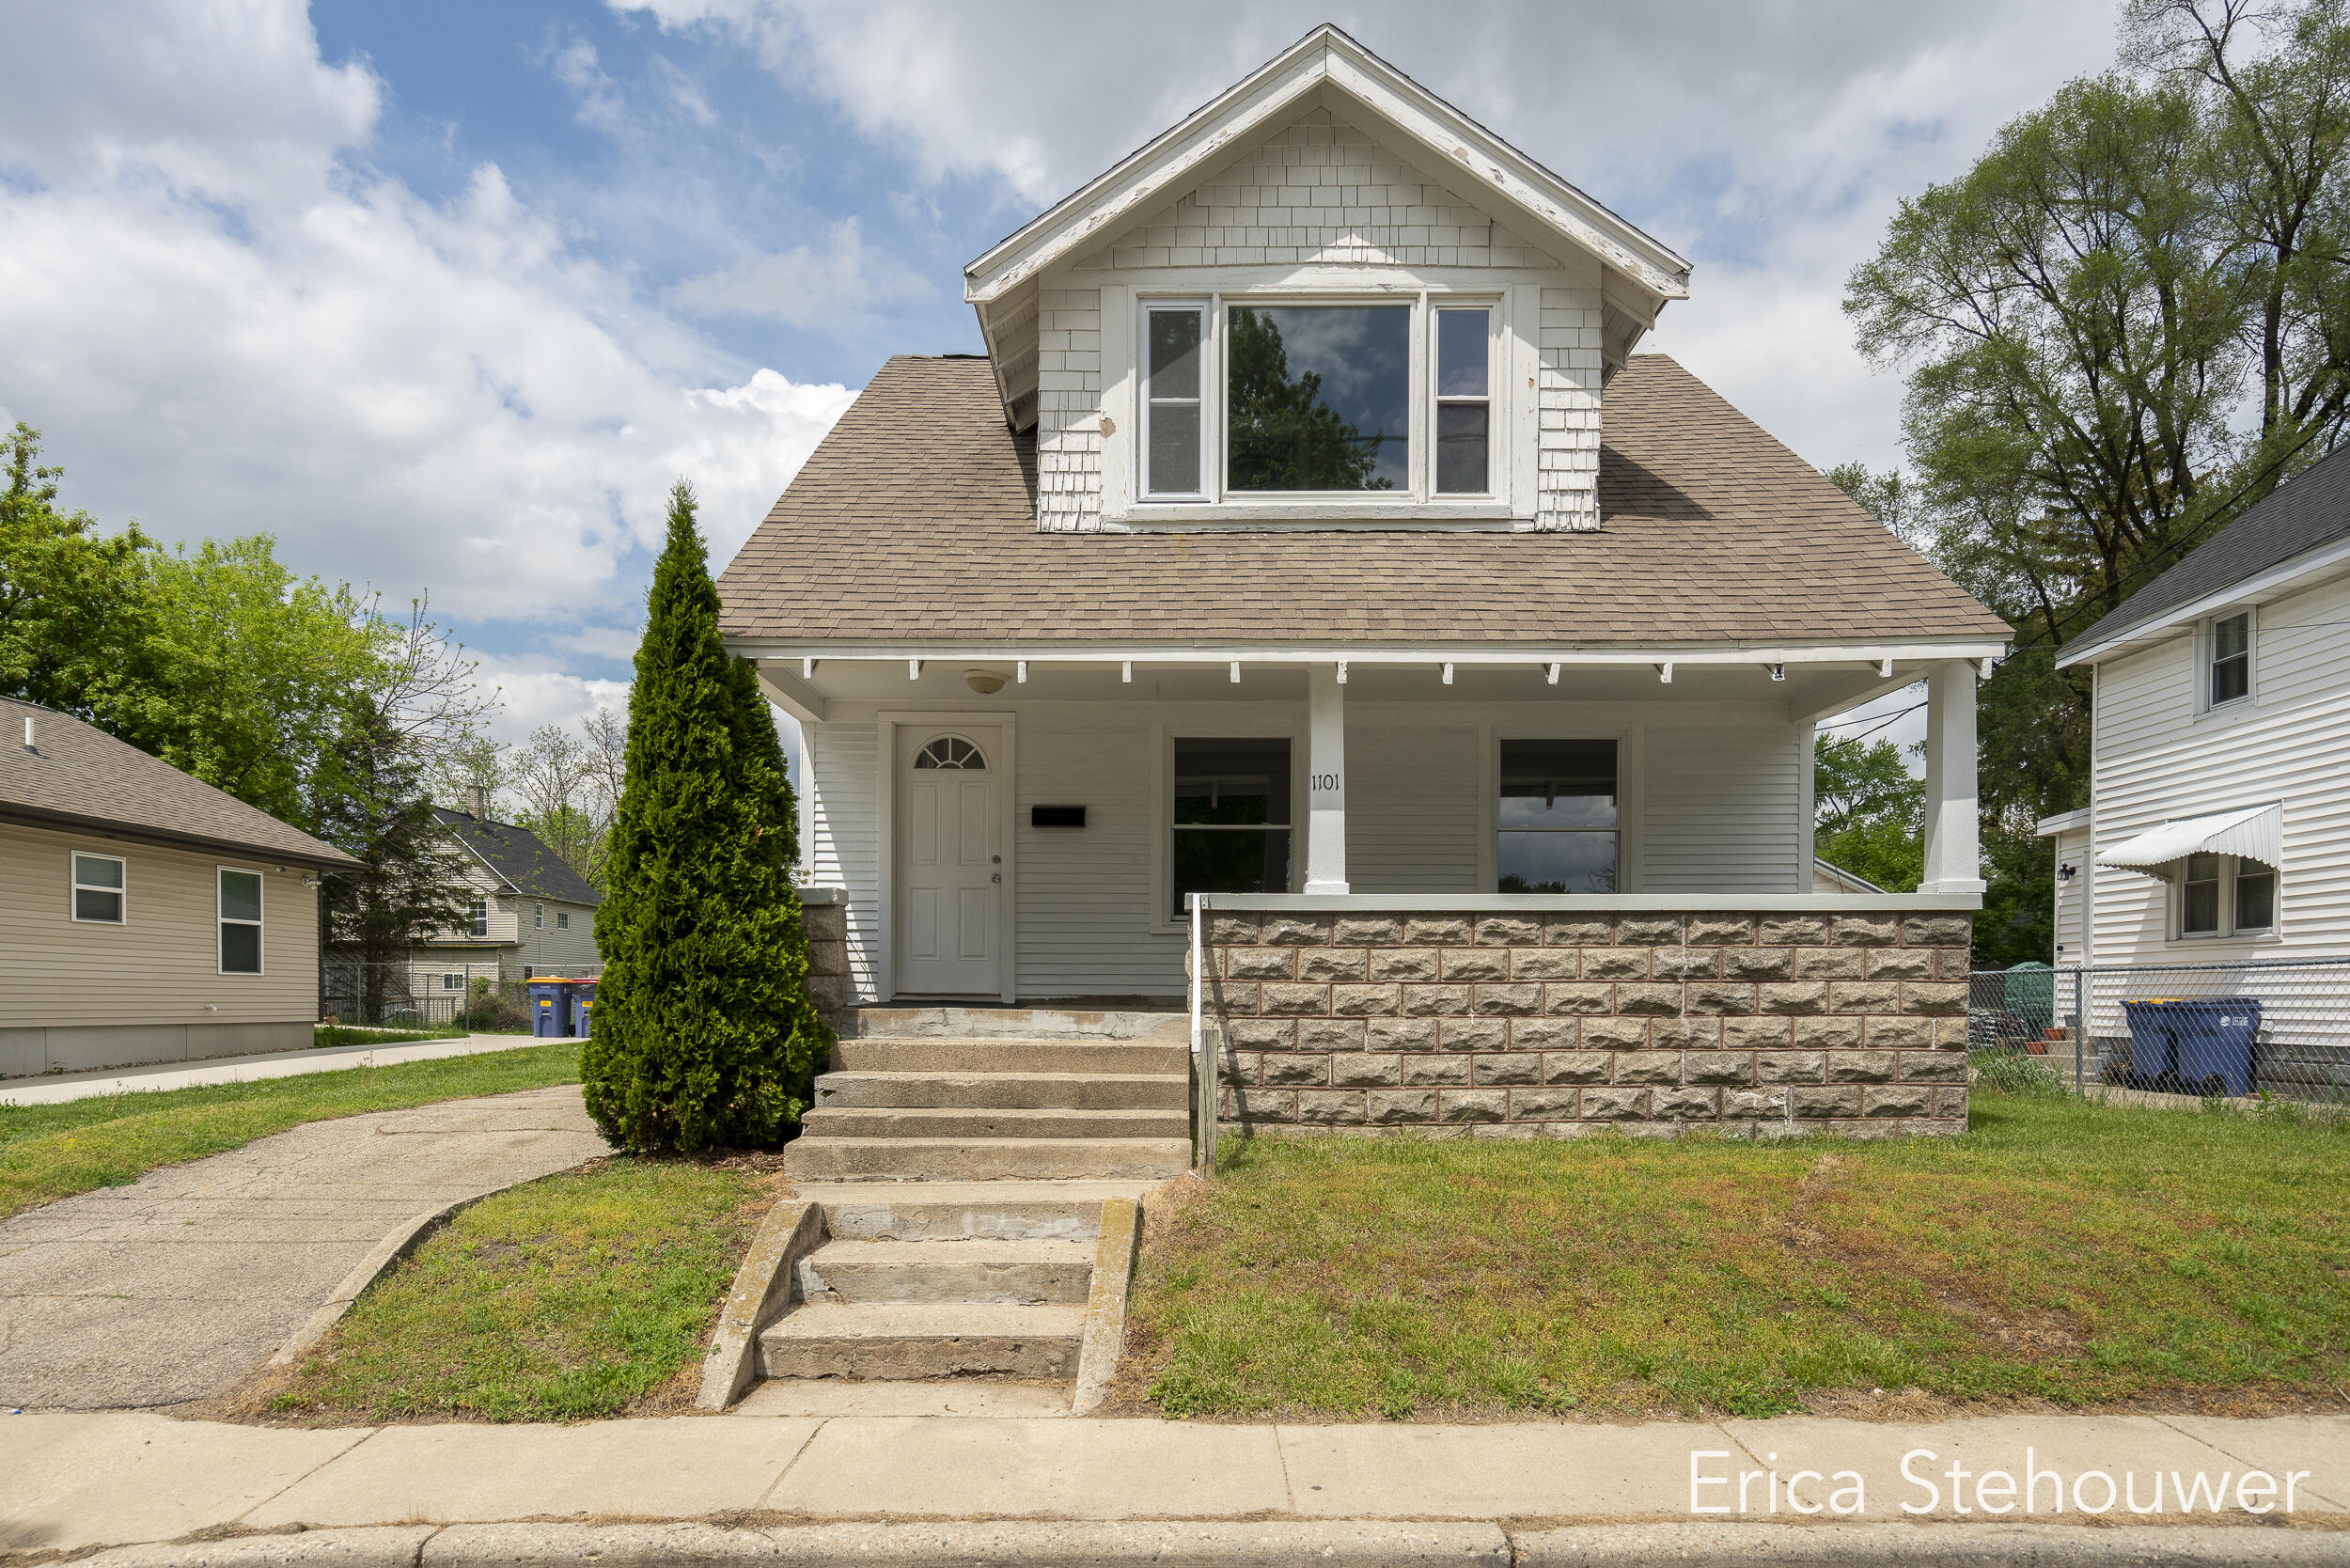
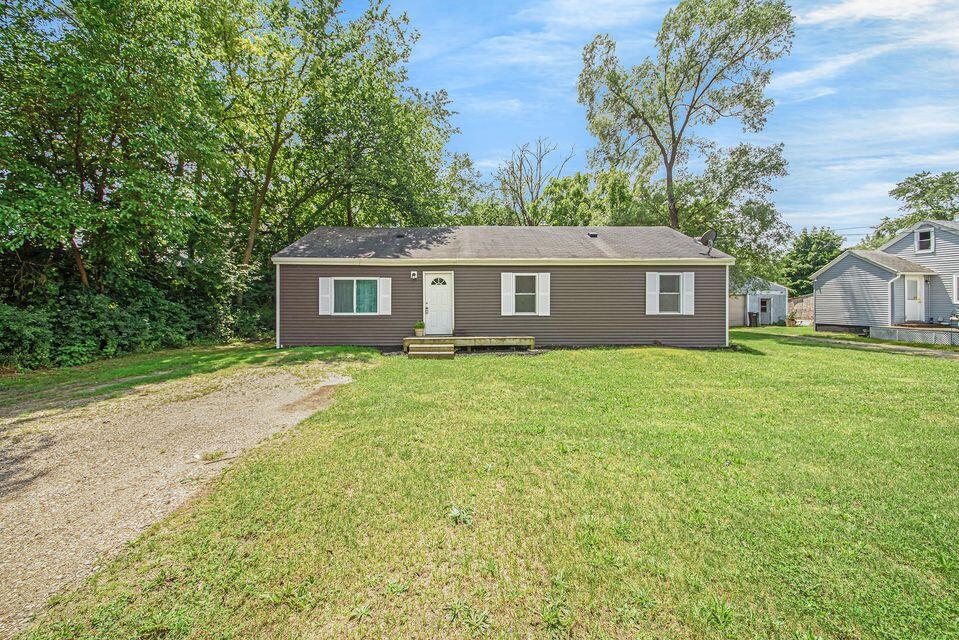
Active
$199,900
3
bds
|
1
ba
|
1,250
sqft
|
built
1922
1101 Bemis St SE, Grand Rapids, MI 49506
$-5,765
Cash flow
-150.5%
Cash-on-Cash Return
-28.5%
Cap rate
0.9%
Rent to Value Ratio
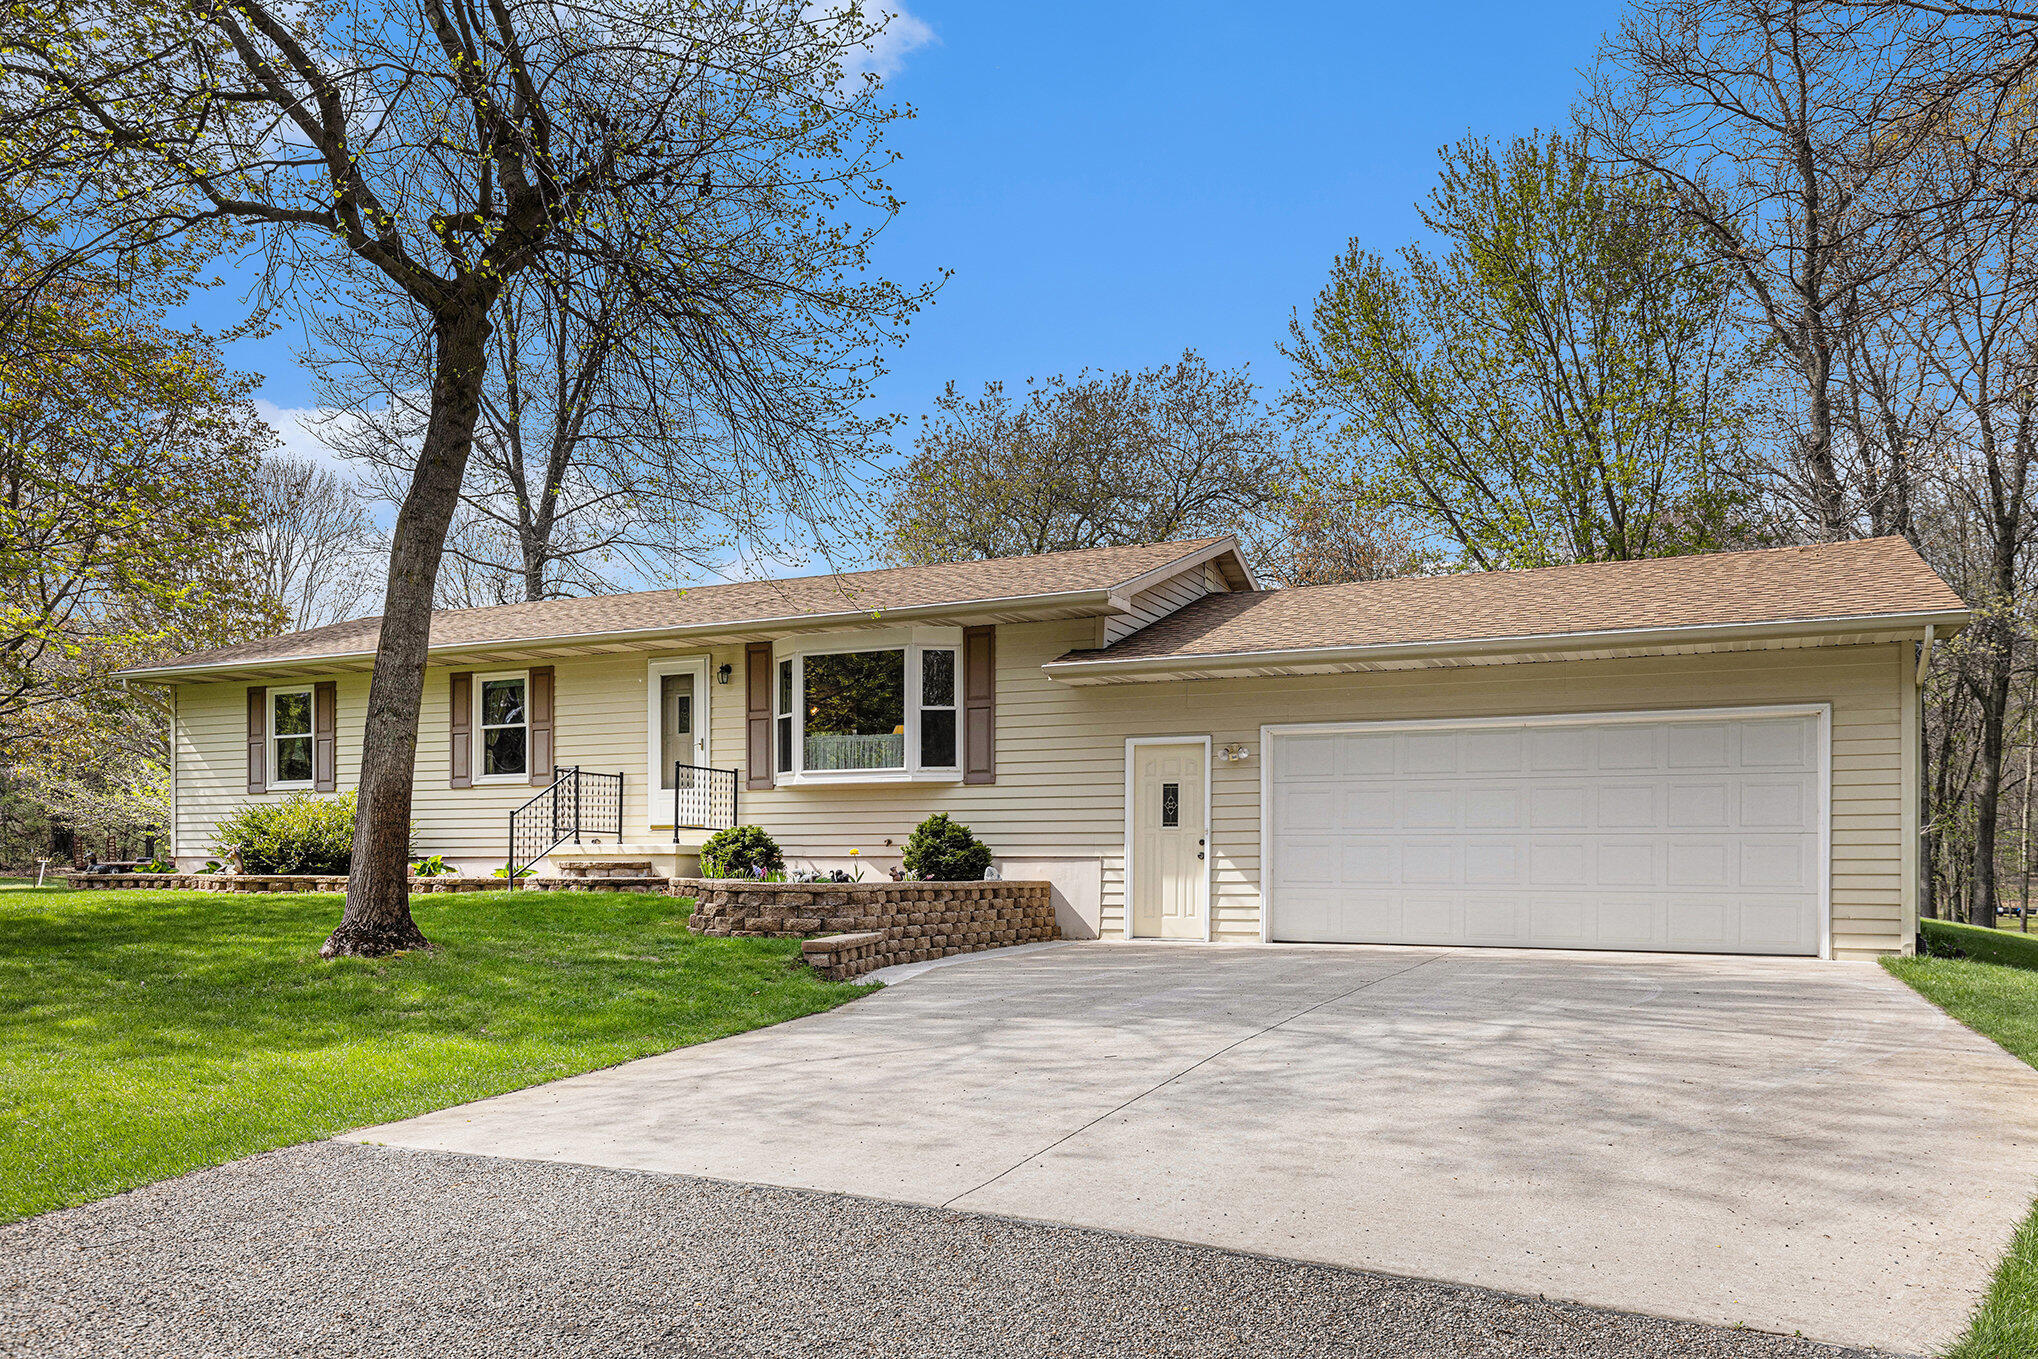
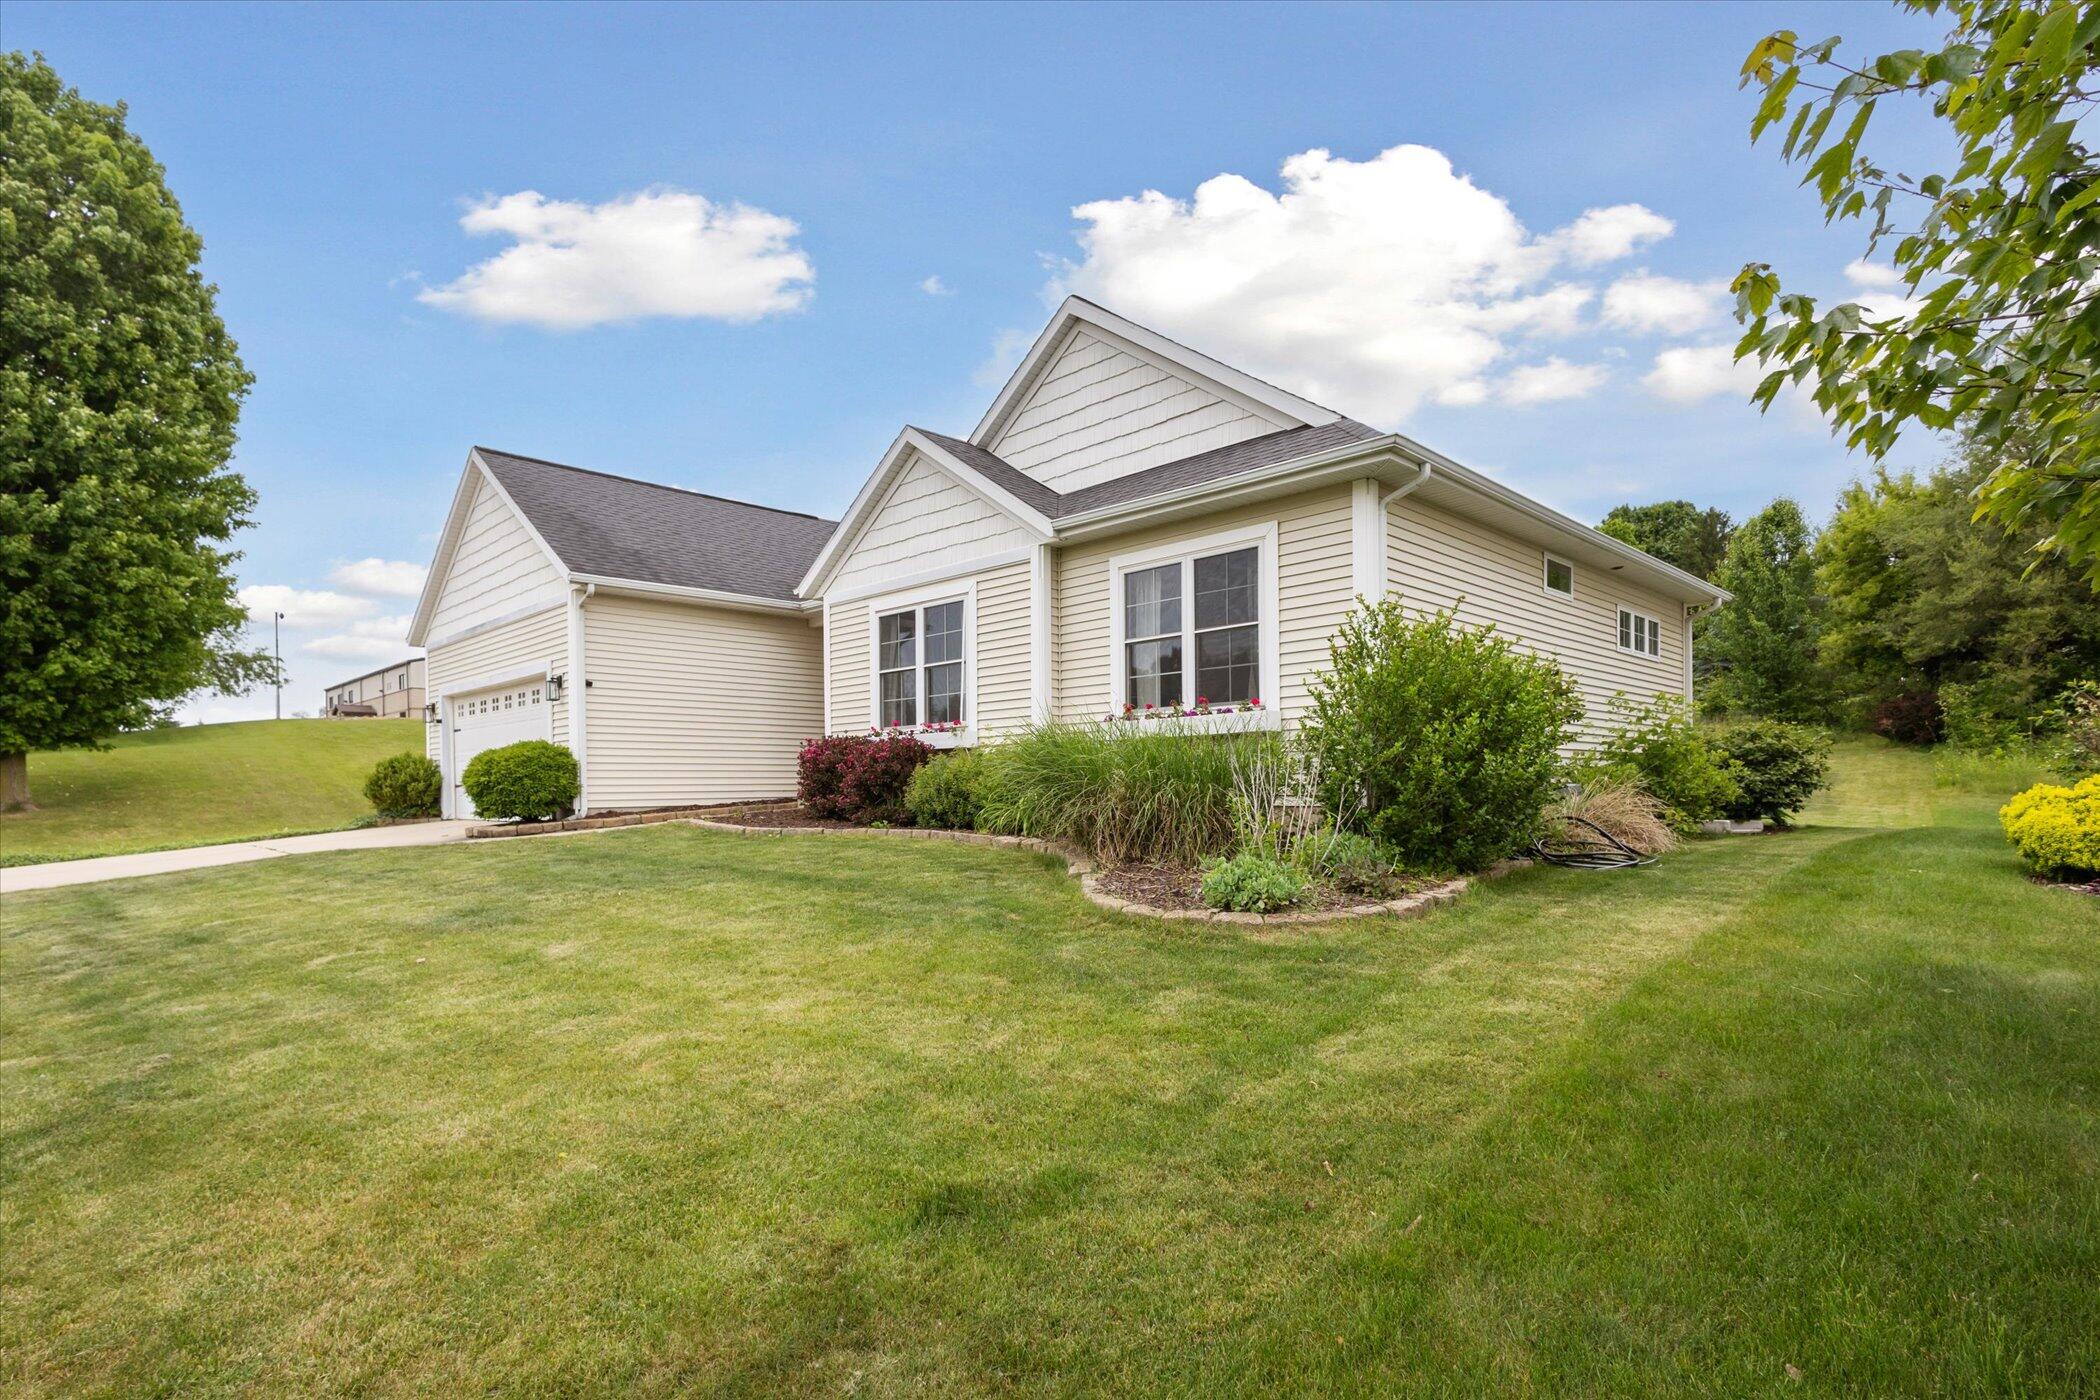
Active
$389,900
3
bds
|
2
ba
|
1,532
sqft
|
built
1980
12321 Stultz St NE, Rockford, MI 49341
$-636
Cash flow
-8.5%
Cash-on-Cash Return
4.2%
Cap rate
0.6%
Rent to Value Ratio
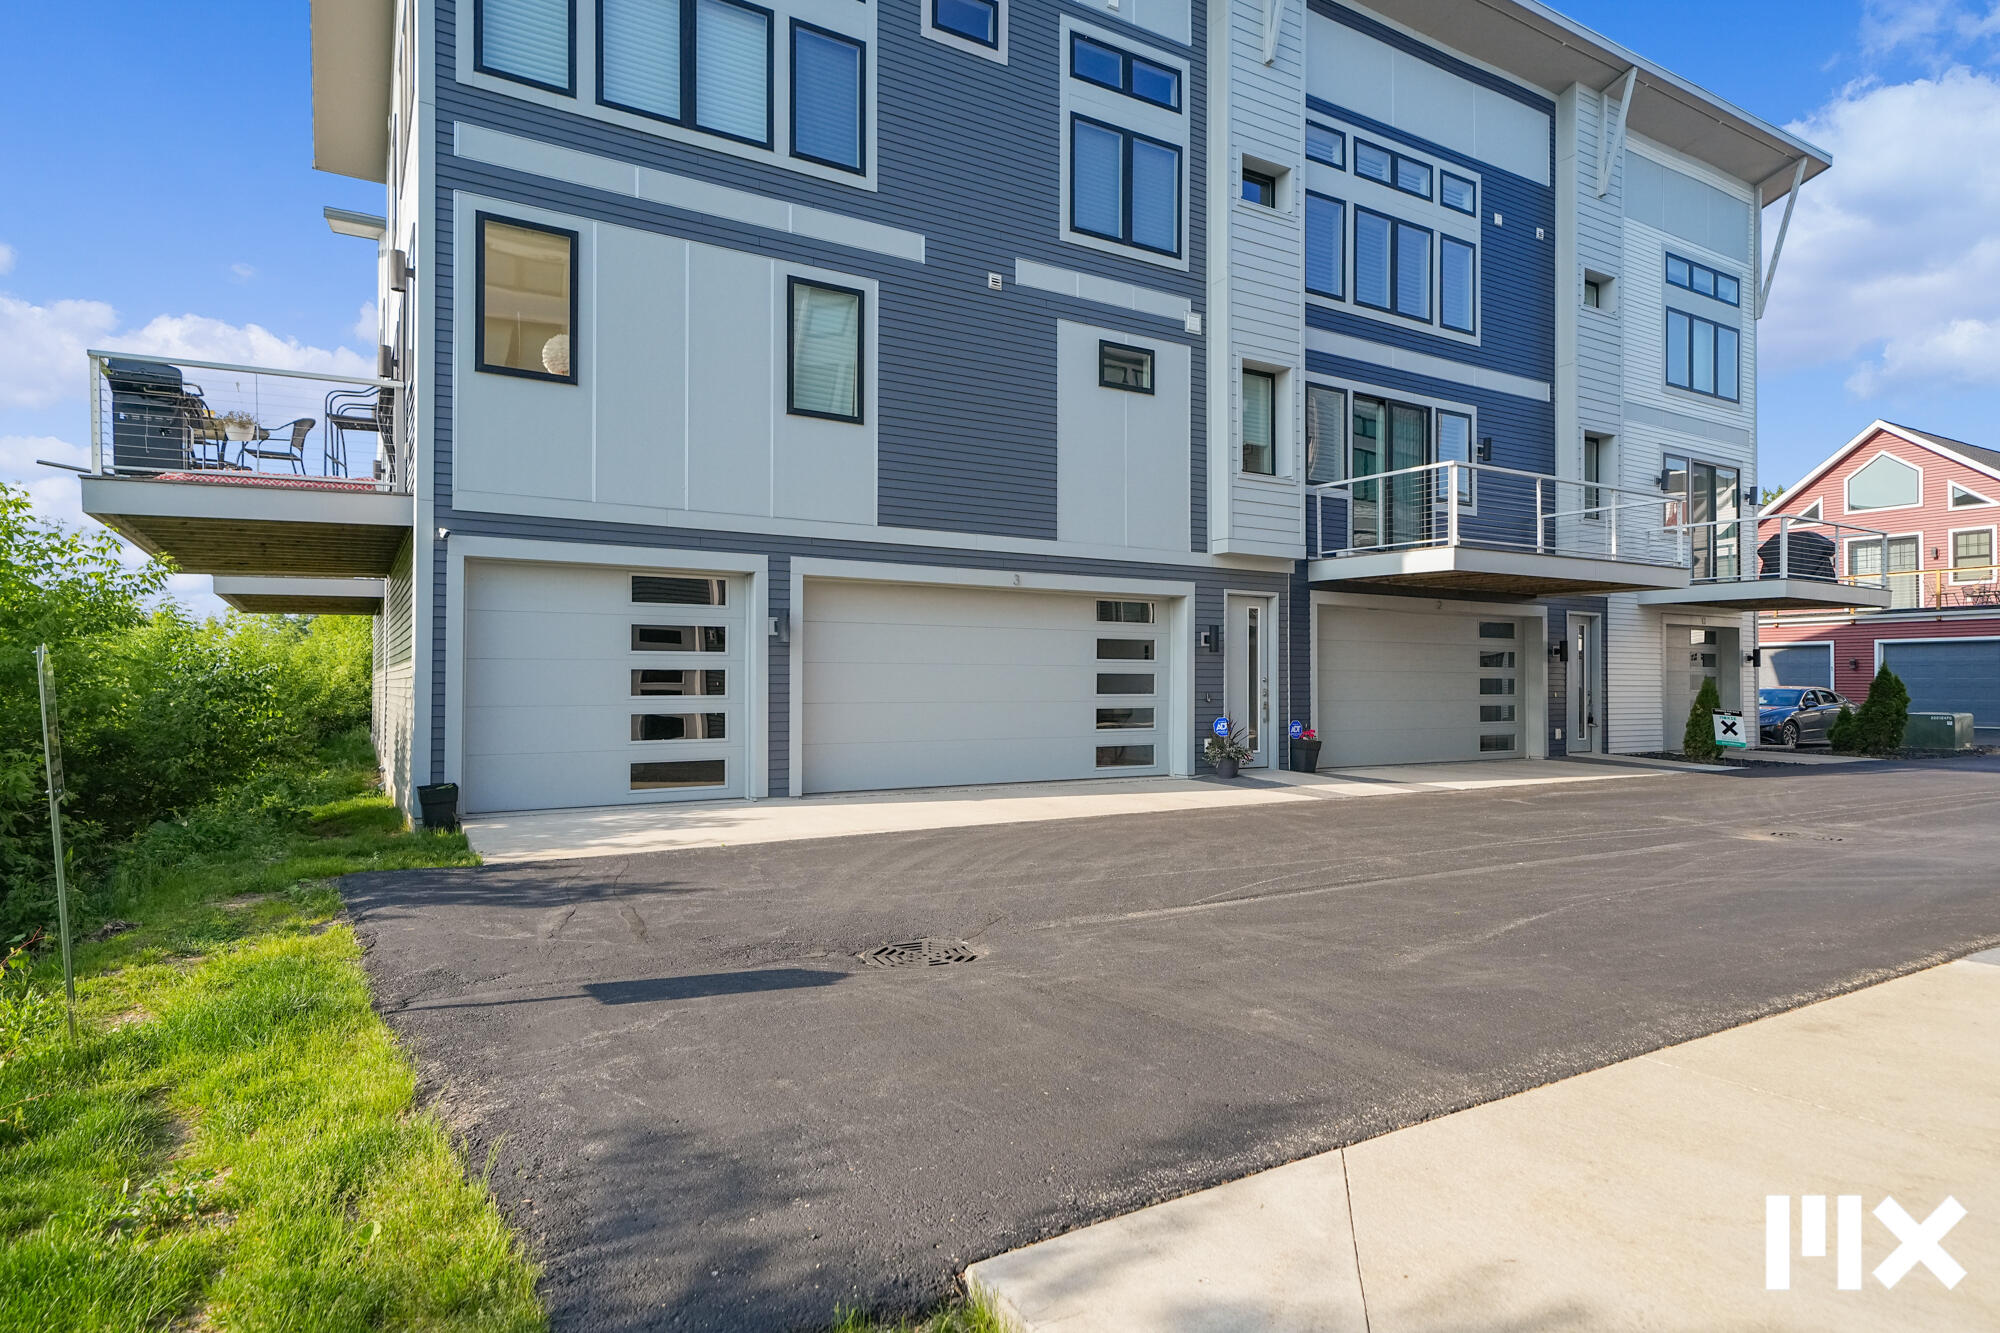
Active
$465,000
2
bds
|
3
ba
|
1,326
sqft
|
built
2019
627 Fairview Ave NE, Grand Rapids, MI 49503
$-1,212
Cash flow
-13.6%
Cash-on-Cash Return
3.0%
Cap rate
0.7%
Rent to Value Ratio
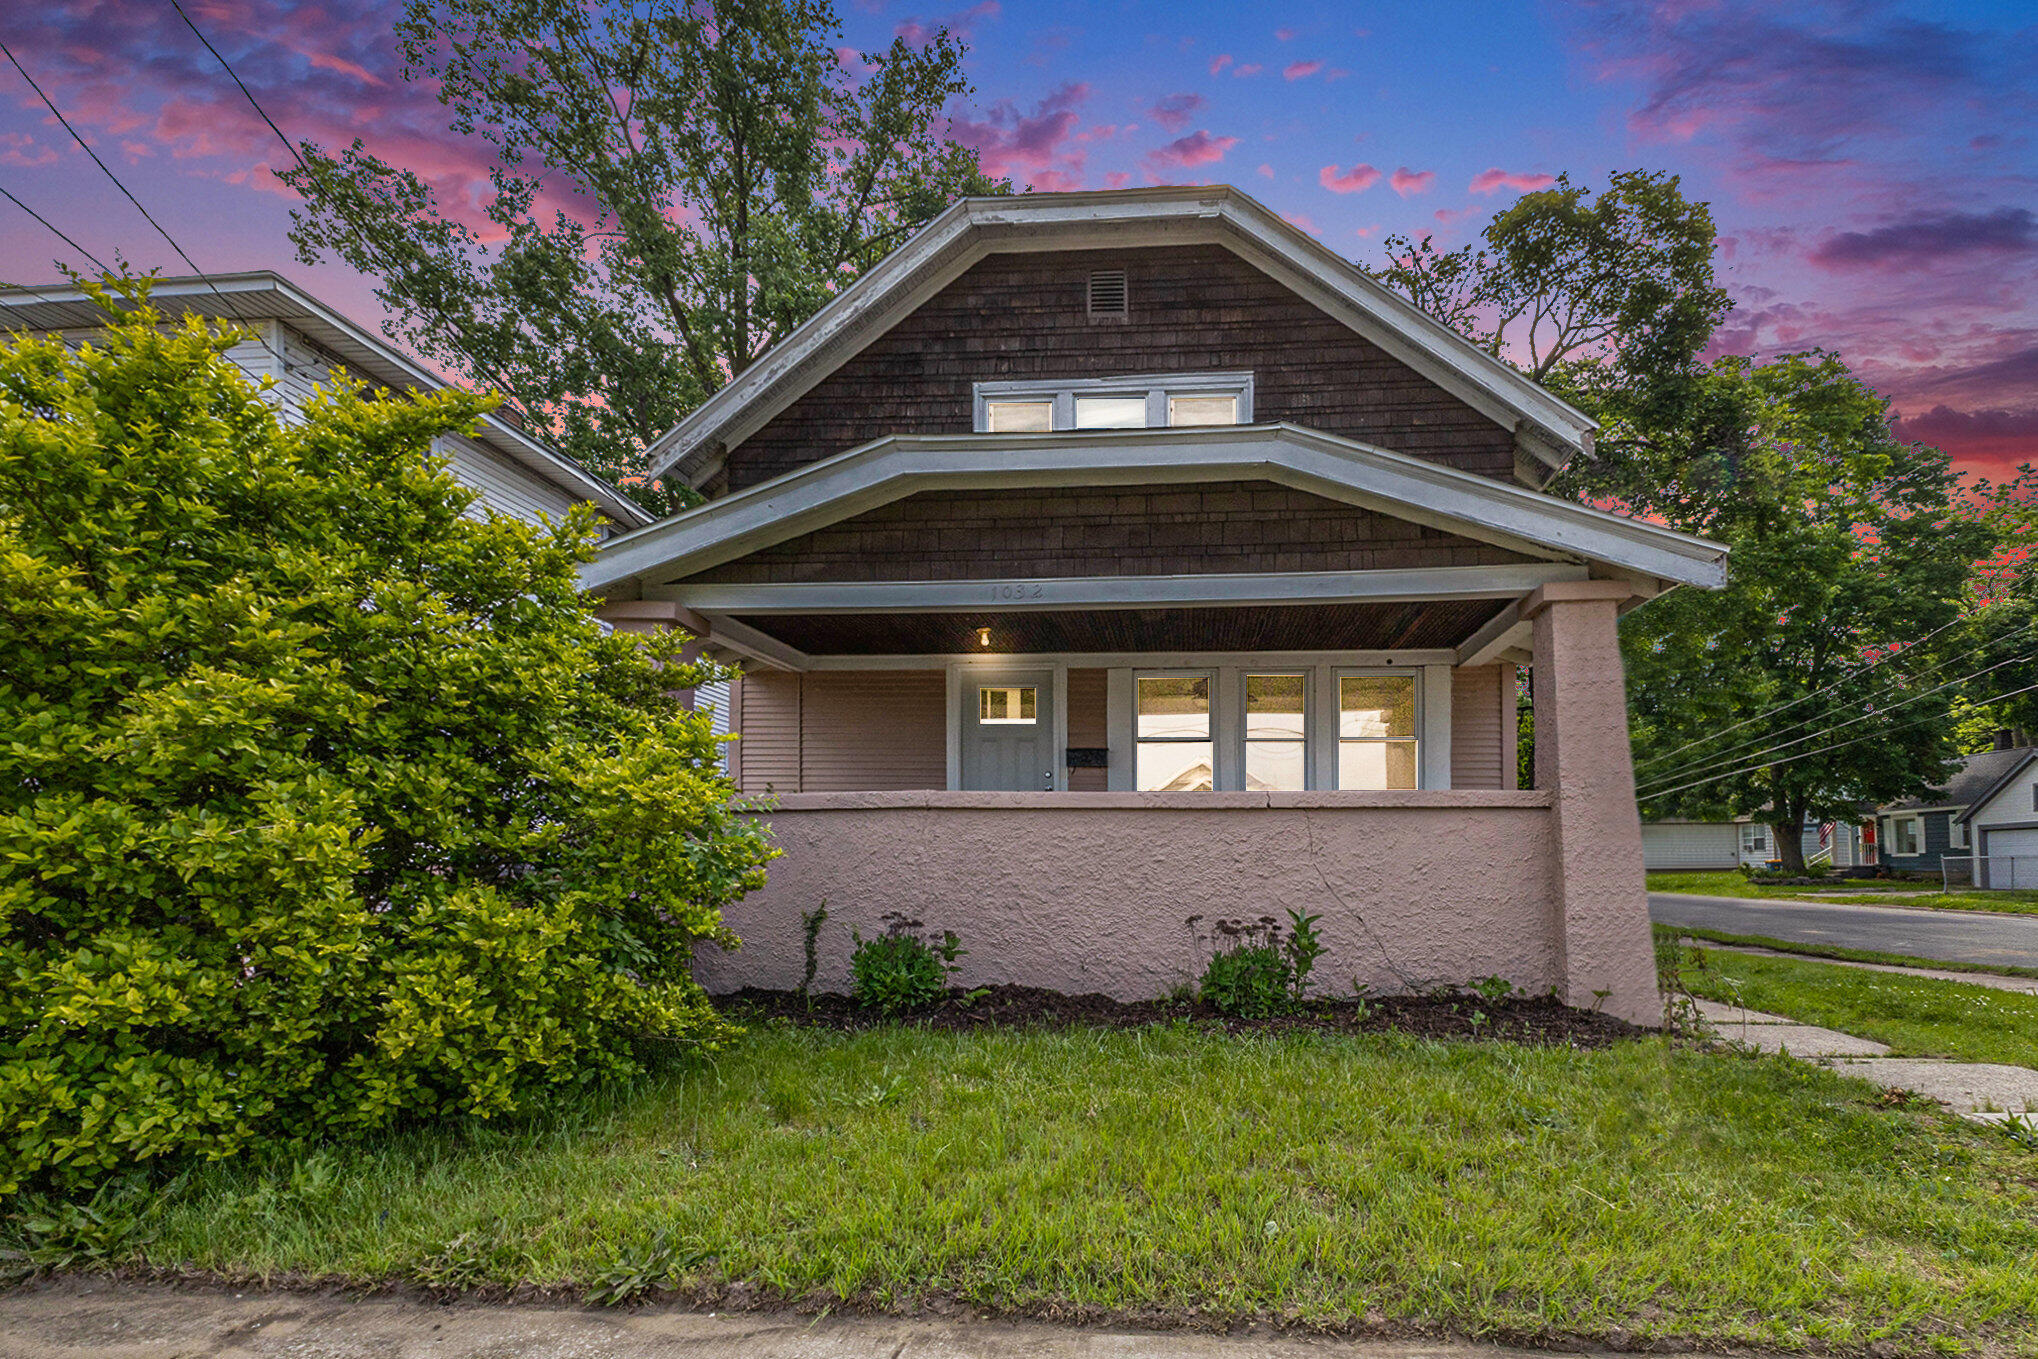
Active
$279,900
3
bds
|
2
ba
|
1,984
sqft
|
built
1923
1032 Lafayette Ave NE, Grand Rapids, MI 49503
$-305
Cash flow
-5.7%
Cash-on-Cash Return
4.8%
Cap rate
0.7%
Rent to Value Ratio
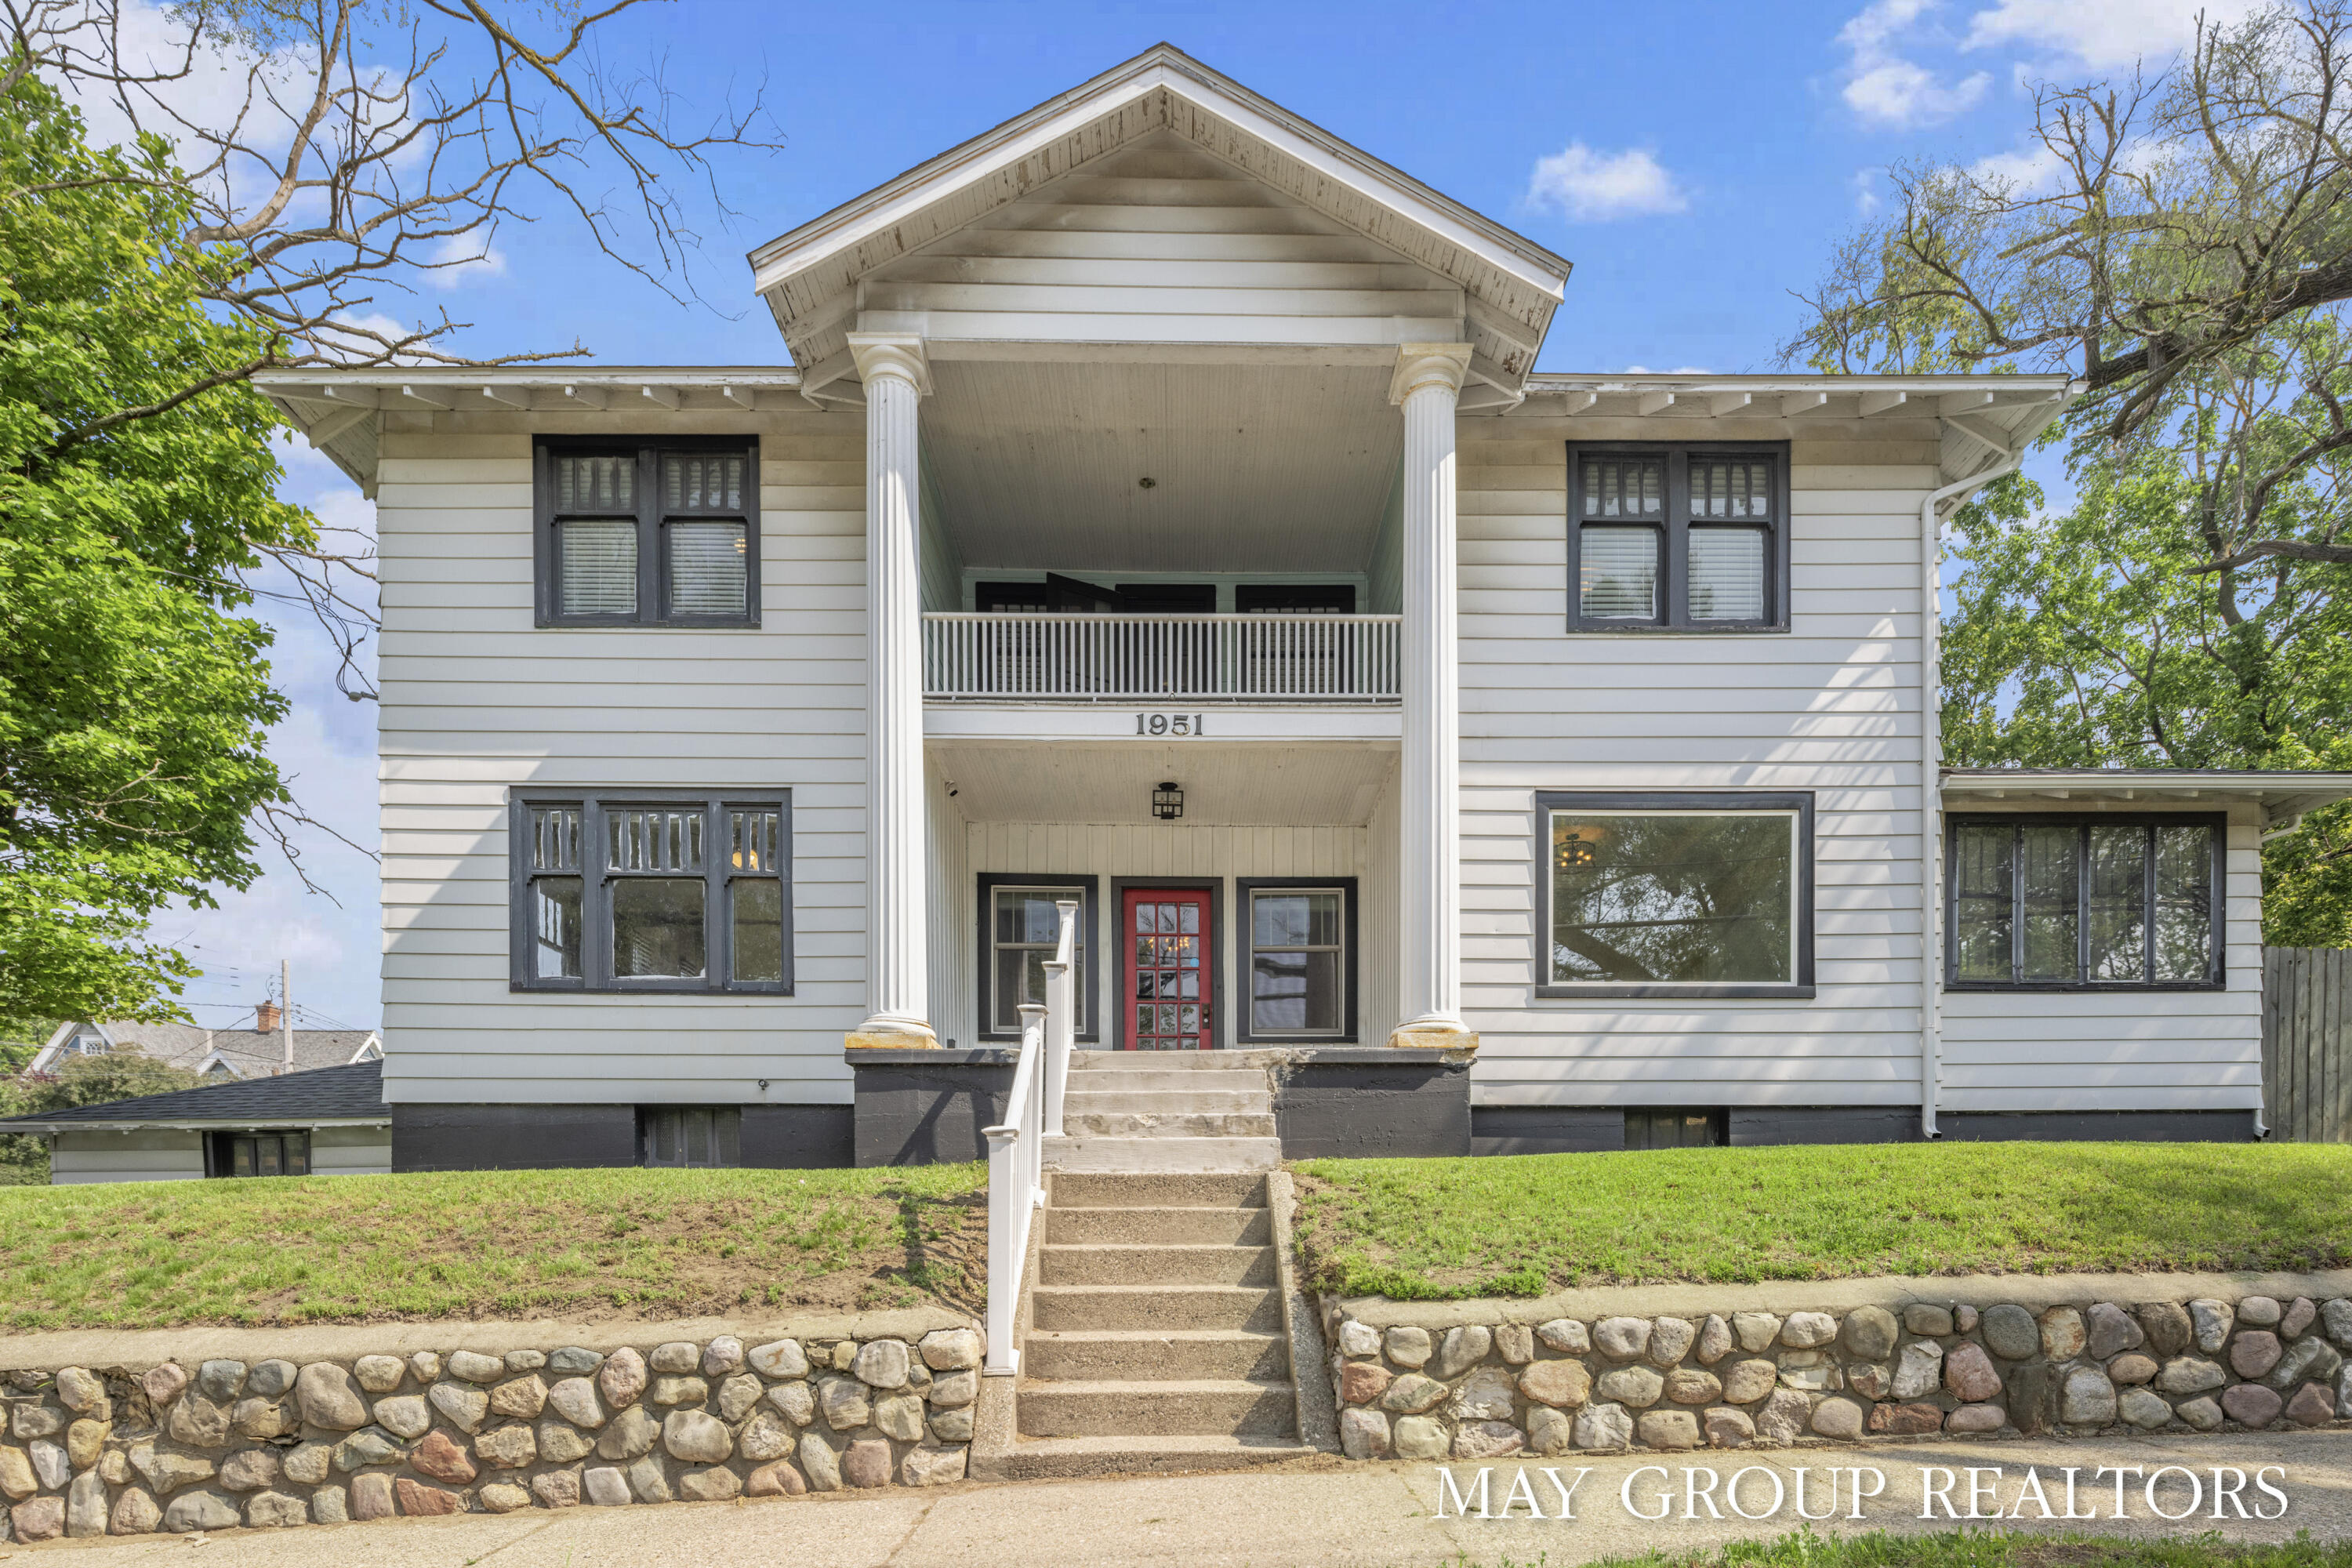
Active
$399,900
5
bds
|
4
ba
|
2,789
sqft
|
built
1911
1951 Leonard St NW, Grand Rapids, MI 49504
$-216
Cash flow
-2.8%
Cash-on-Cash Return
5.5%
Cap rate
0.8%
Rent to Value Ratio
Active
$334,900
3
bds
|
2
ba
|
1,540
sqft
|
built
1925
465 Kenwood St NE, Grand Rapids, MI 49505
$-430
Cash flow
-6.7%
Cash-on-Cash Return
4.6%
Cap rate
0.7%
Rent to Value Ratio
Active
$549,000
5
bds
|
4
ba
|
2,992
sqft
|
built
1974
7362 30th St SE, Ada, MI 49301
$-1,008
Cash flow
-9.6%
Cash-on-Cash Return
3.9%
Cap rate
0.6%
Rent to Value Ratio
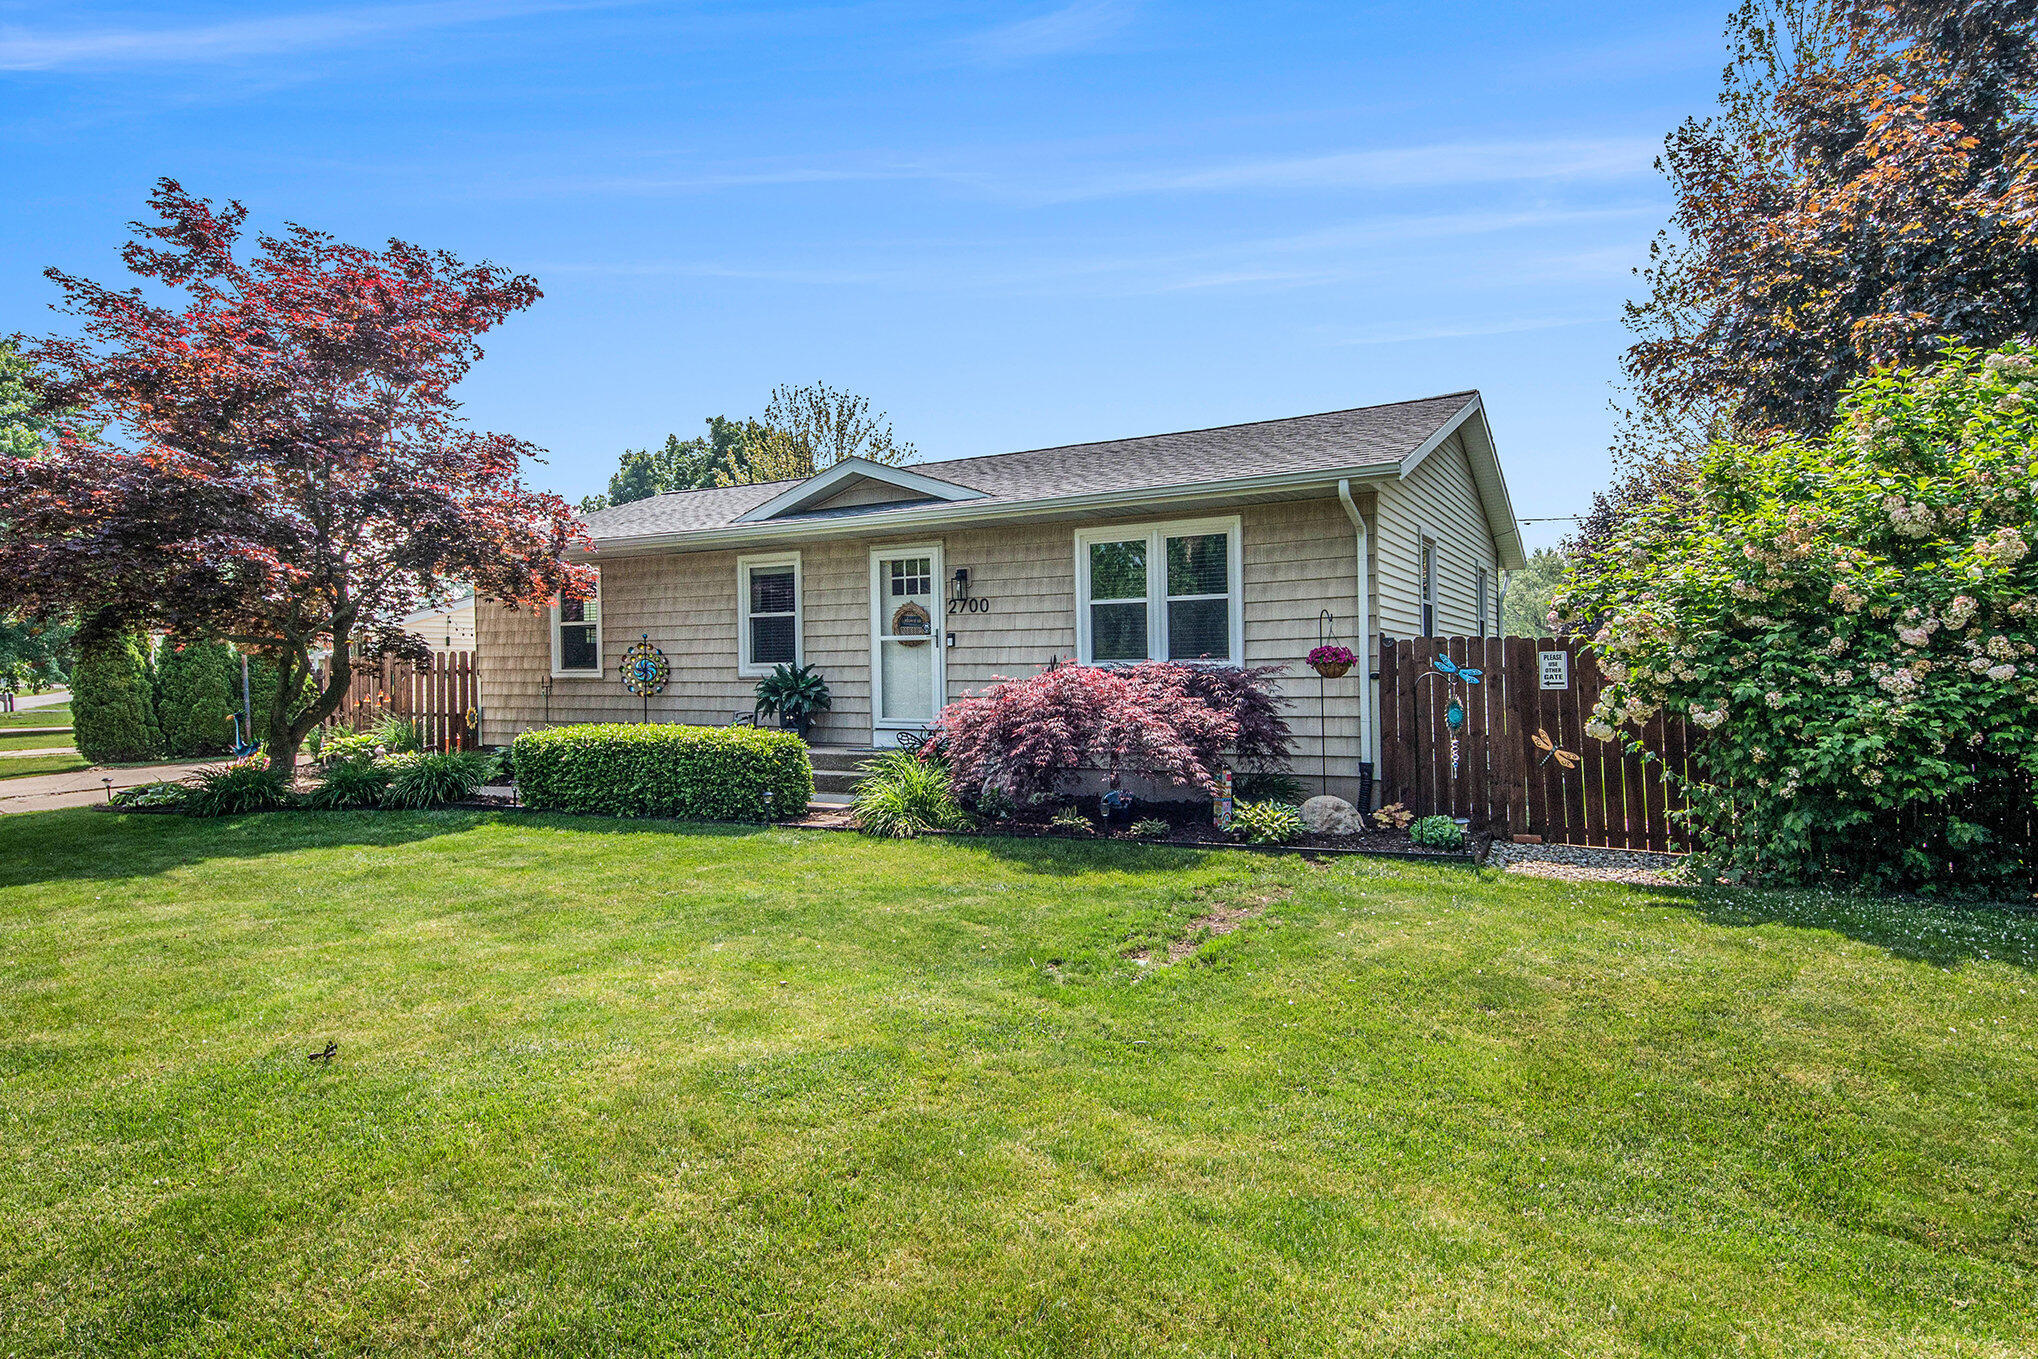
Pending
$350,000
3
bds
|
1
ba
|
1,456
sqft
|
built
1979
2700 Norfolk Rd SE, Grand Rapids, MI 49506
$-580
Cash flow
-8.6%
Cash-on-Cash Return
4.2%
Cap rate
0.6%
Rent to Value Ratio
Active
$835,000
3
bds
|
3
ba
|
1,891
sqft
|
built
2007
335 Bridge St NW, Grand Rapids, MI 49504
$-2,452
Cash flow
-15.3%
Cash-on-Cash Return
2.6%
Cap rate
0.7%
Rent to Value Ratio
Active
$374,900
4
bds
|
2
ba
|
1,896
sqft
|
built
1900
1237 Wealthy St SE, Grand Rapids, MI 49506
$-580
Cash flow
-8.1%
Cash-on-Cash Return
4.3%
Cap rate
0.7%
Rent to Value Ratio
Active
$309,500
1
bds
|
1
ba
|
926
sqft
|
built
1892
940 Monroe Ave NW, Grand Rapids, MI 49503
$-1,120
Cash flow
-18.9%
Cash-on-Cash Return
1.8%
Cap rate
0.5%
Rent to Value Ratio
Active
$575,000
3
bds
|
3
ba
|
2,085
sqft
|
built
1992
9057 Vergennes St SE, Ada, MI 49301
$-1,321
Cash flow
-12.0%
Cash-on-Cash Return
3.4%
Cap rate
0.5%
Rent to Value Ratio
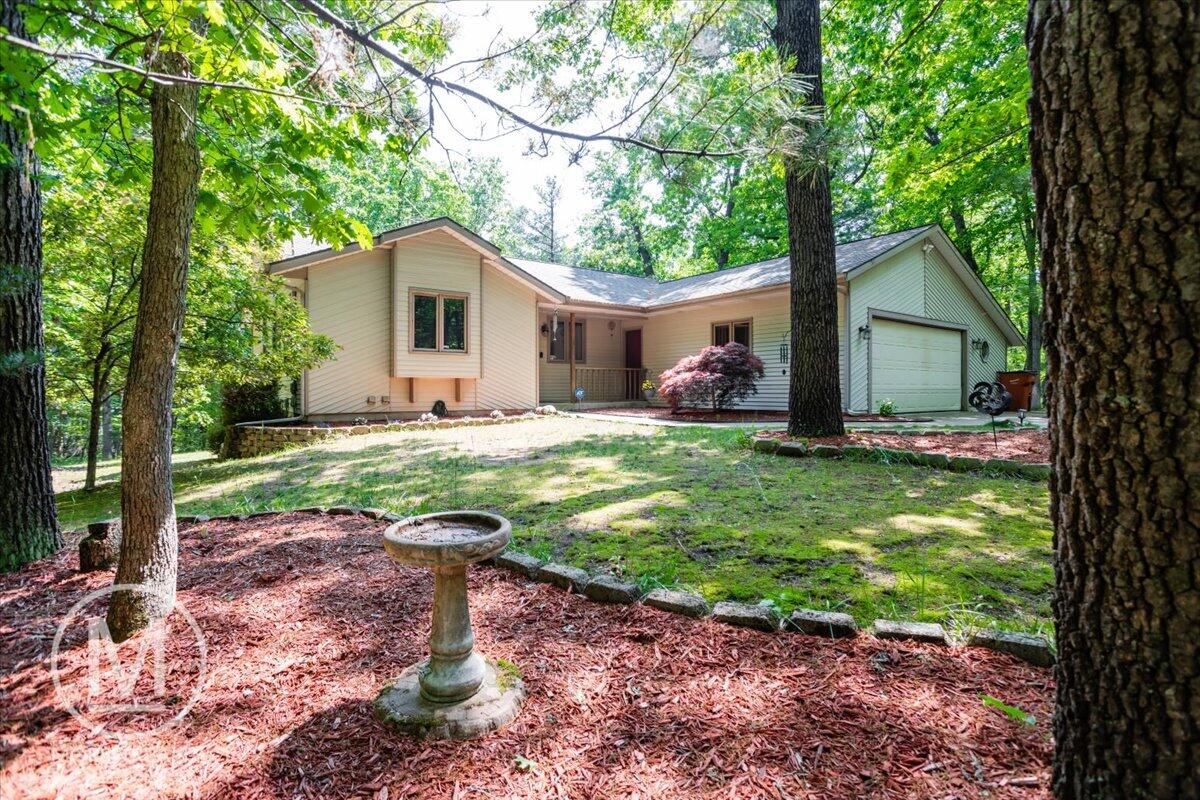
Active
$369,900
4
bds
|
5
ba
|
2,010
sqft
|
built
1930
1116 Covell Ave NW, Grand Rapids, MI 49504
$-503
Cash flow
-7.1%
Cash-on-Cash Return
4.5%
Cap rate
0.7%
Rent to Value Ratio
Active
$460,000
4
bds
|
4
ba
|
2,610
sqft
|
built
2003
552 N Creek Ct NE, Rockford, MI 49341
$-1,034
Cash flow
-11.7%
Cash-on-Cash Return
3.4%
Cap rate
0.6%
Rent to Value Ratio
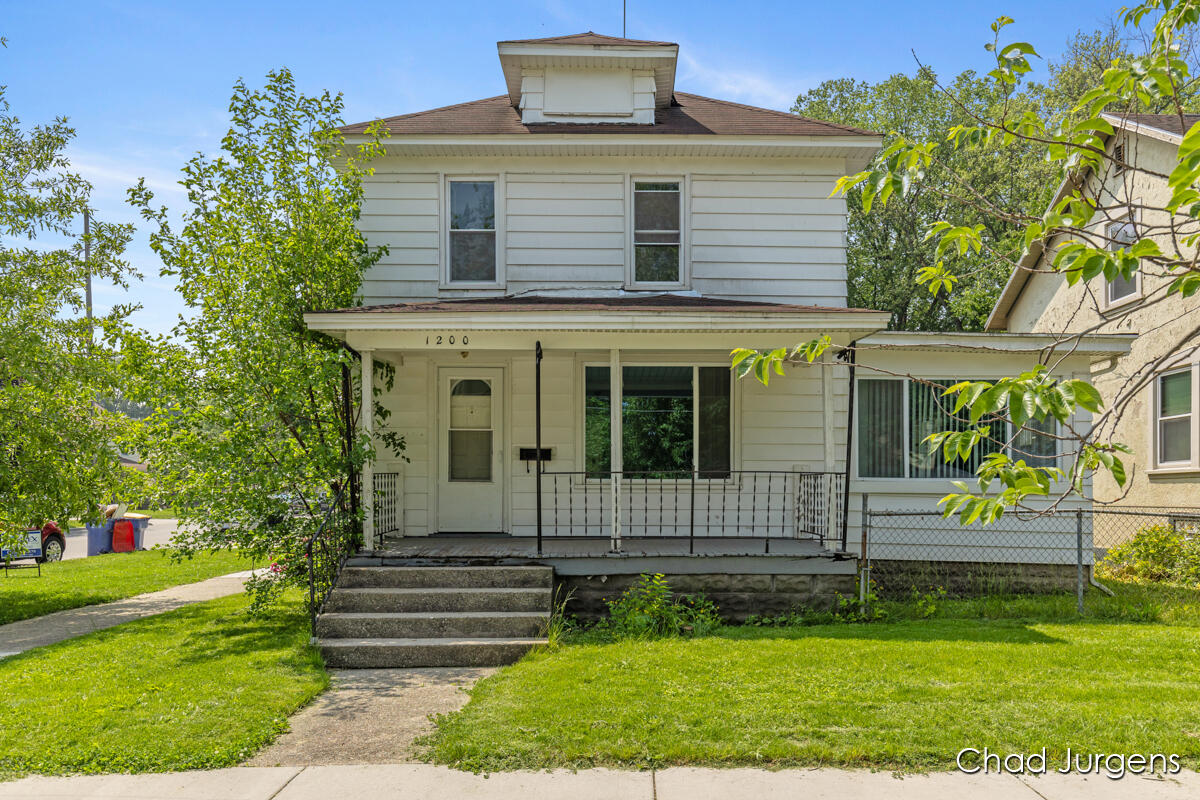
Active
$234,900
3
bds
|
2
ba
|
1,501
sqft
|
built
1919
1200 Jackson St NW, Grand Rapids, MI 49504
$-367
Cash flow
-8.2%
Cash-on-Cash Return
4.3%
Cap rate
0.8%
Rent to Value Ratio
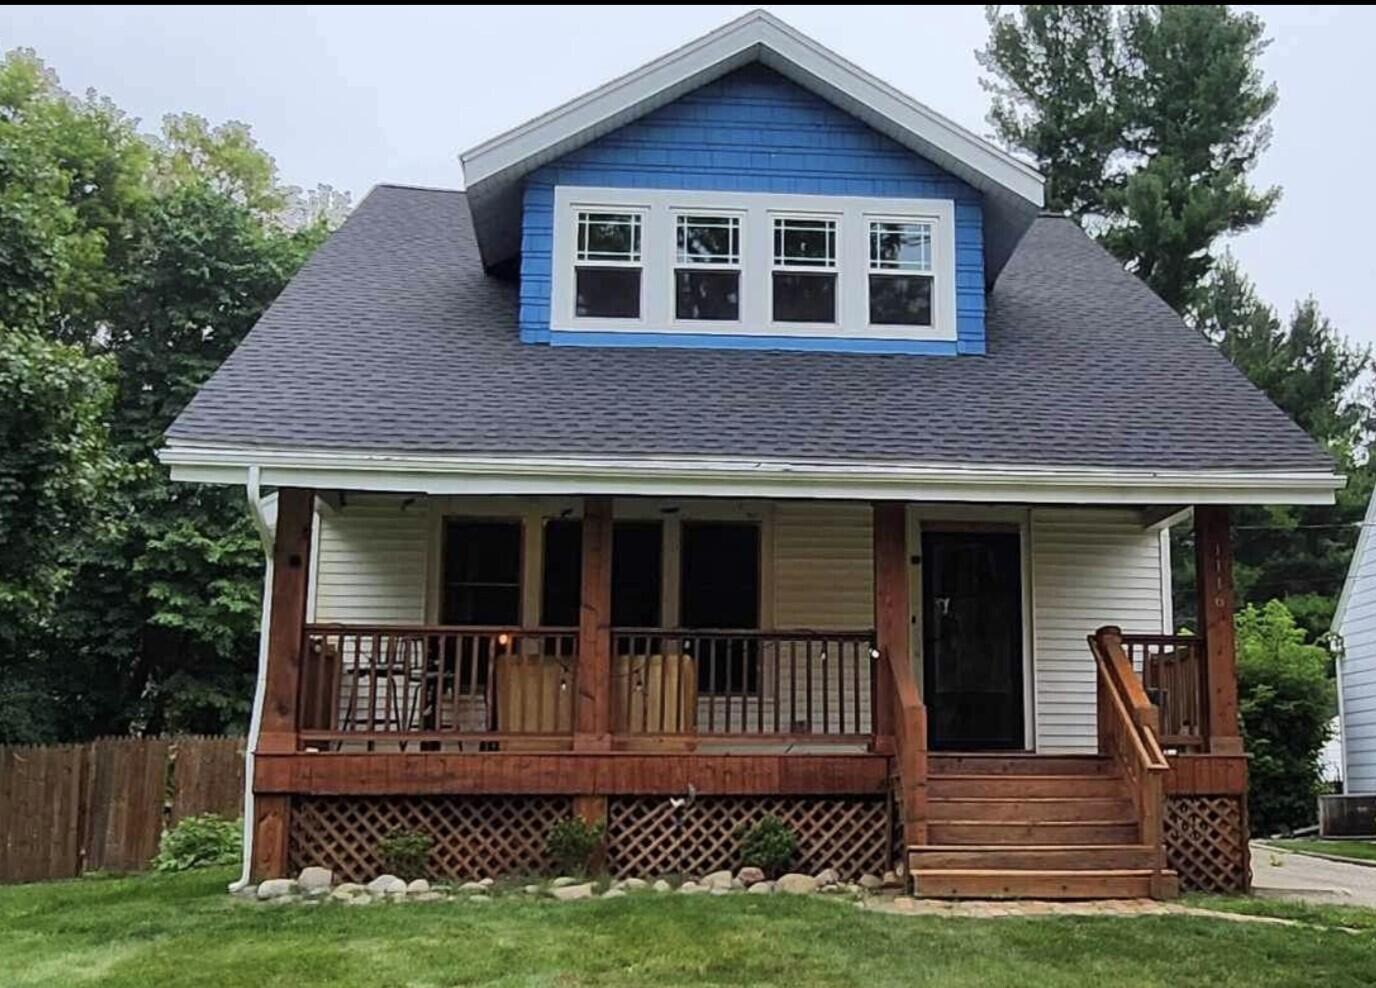
Pending
$285,000
4
bds
|
2
ba
|
1,806
sqft
|
built
1917
204 Lewis St, Rockford, MI 49341
$-339
Cash flow
-6.2%
Cash-on-Cash Return
4.7%
Cap rate
0.6%
Rent to Value Ratio

Active
$500,000
5
bds
|
2
ba
|
2,012
sqft
|
built
1950
3020 Cascade Rd SE, Grand Rapids, MI 49506
$-1,284
Cash flow
-13.4%
Cash-on-Cash Return
3.1%
Cap rate
0.5%
Rent to Value Ratio
Active
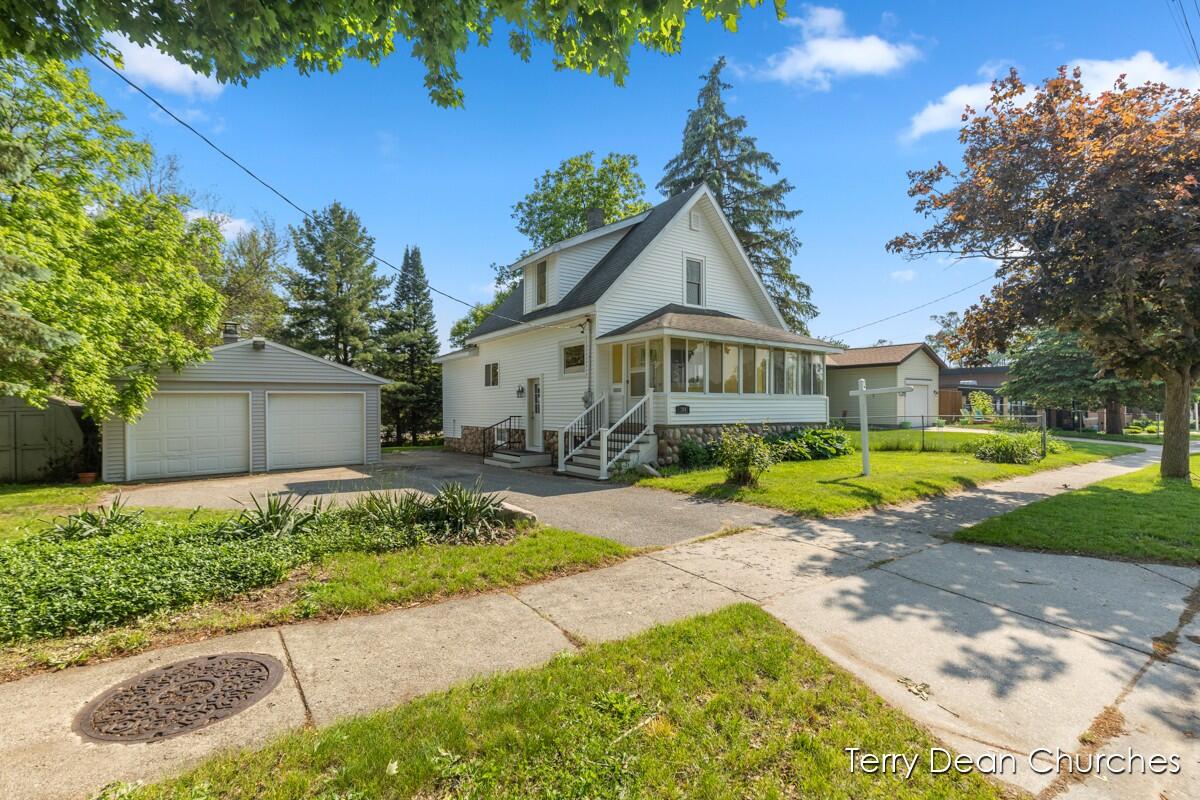
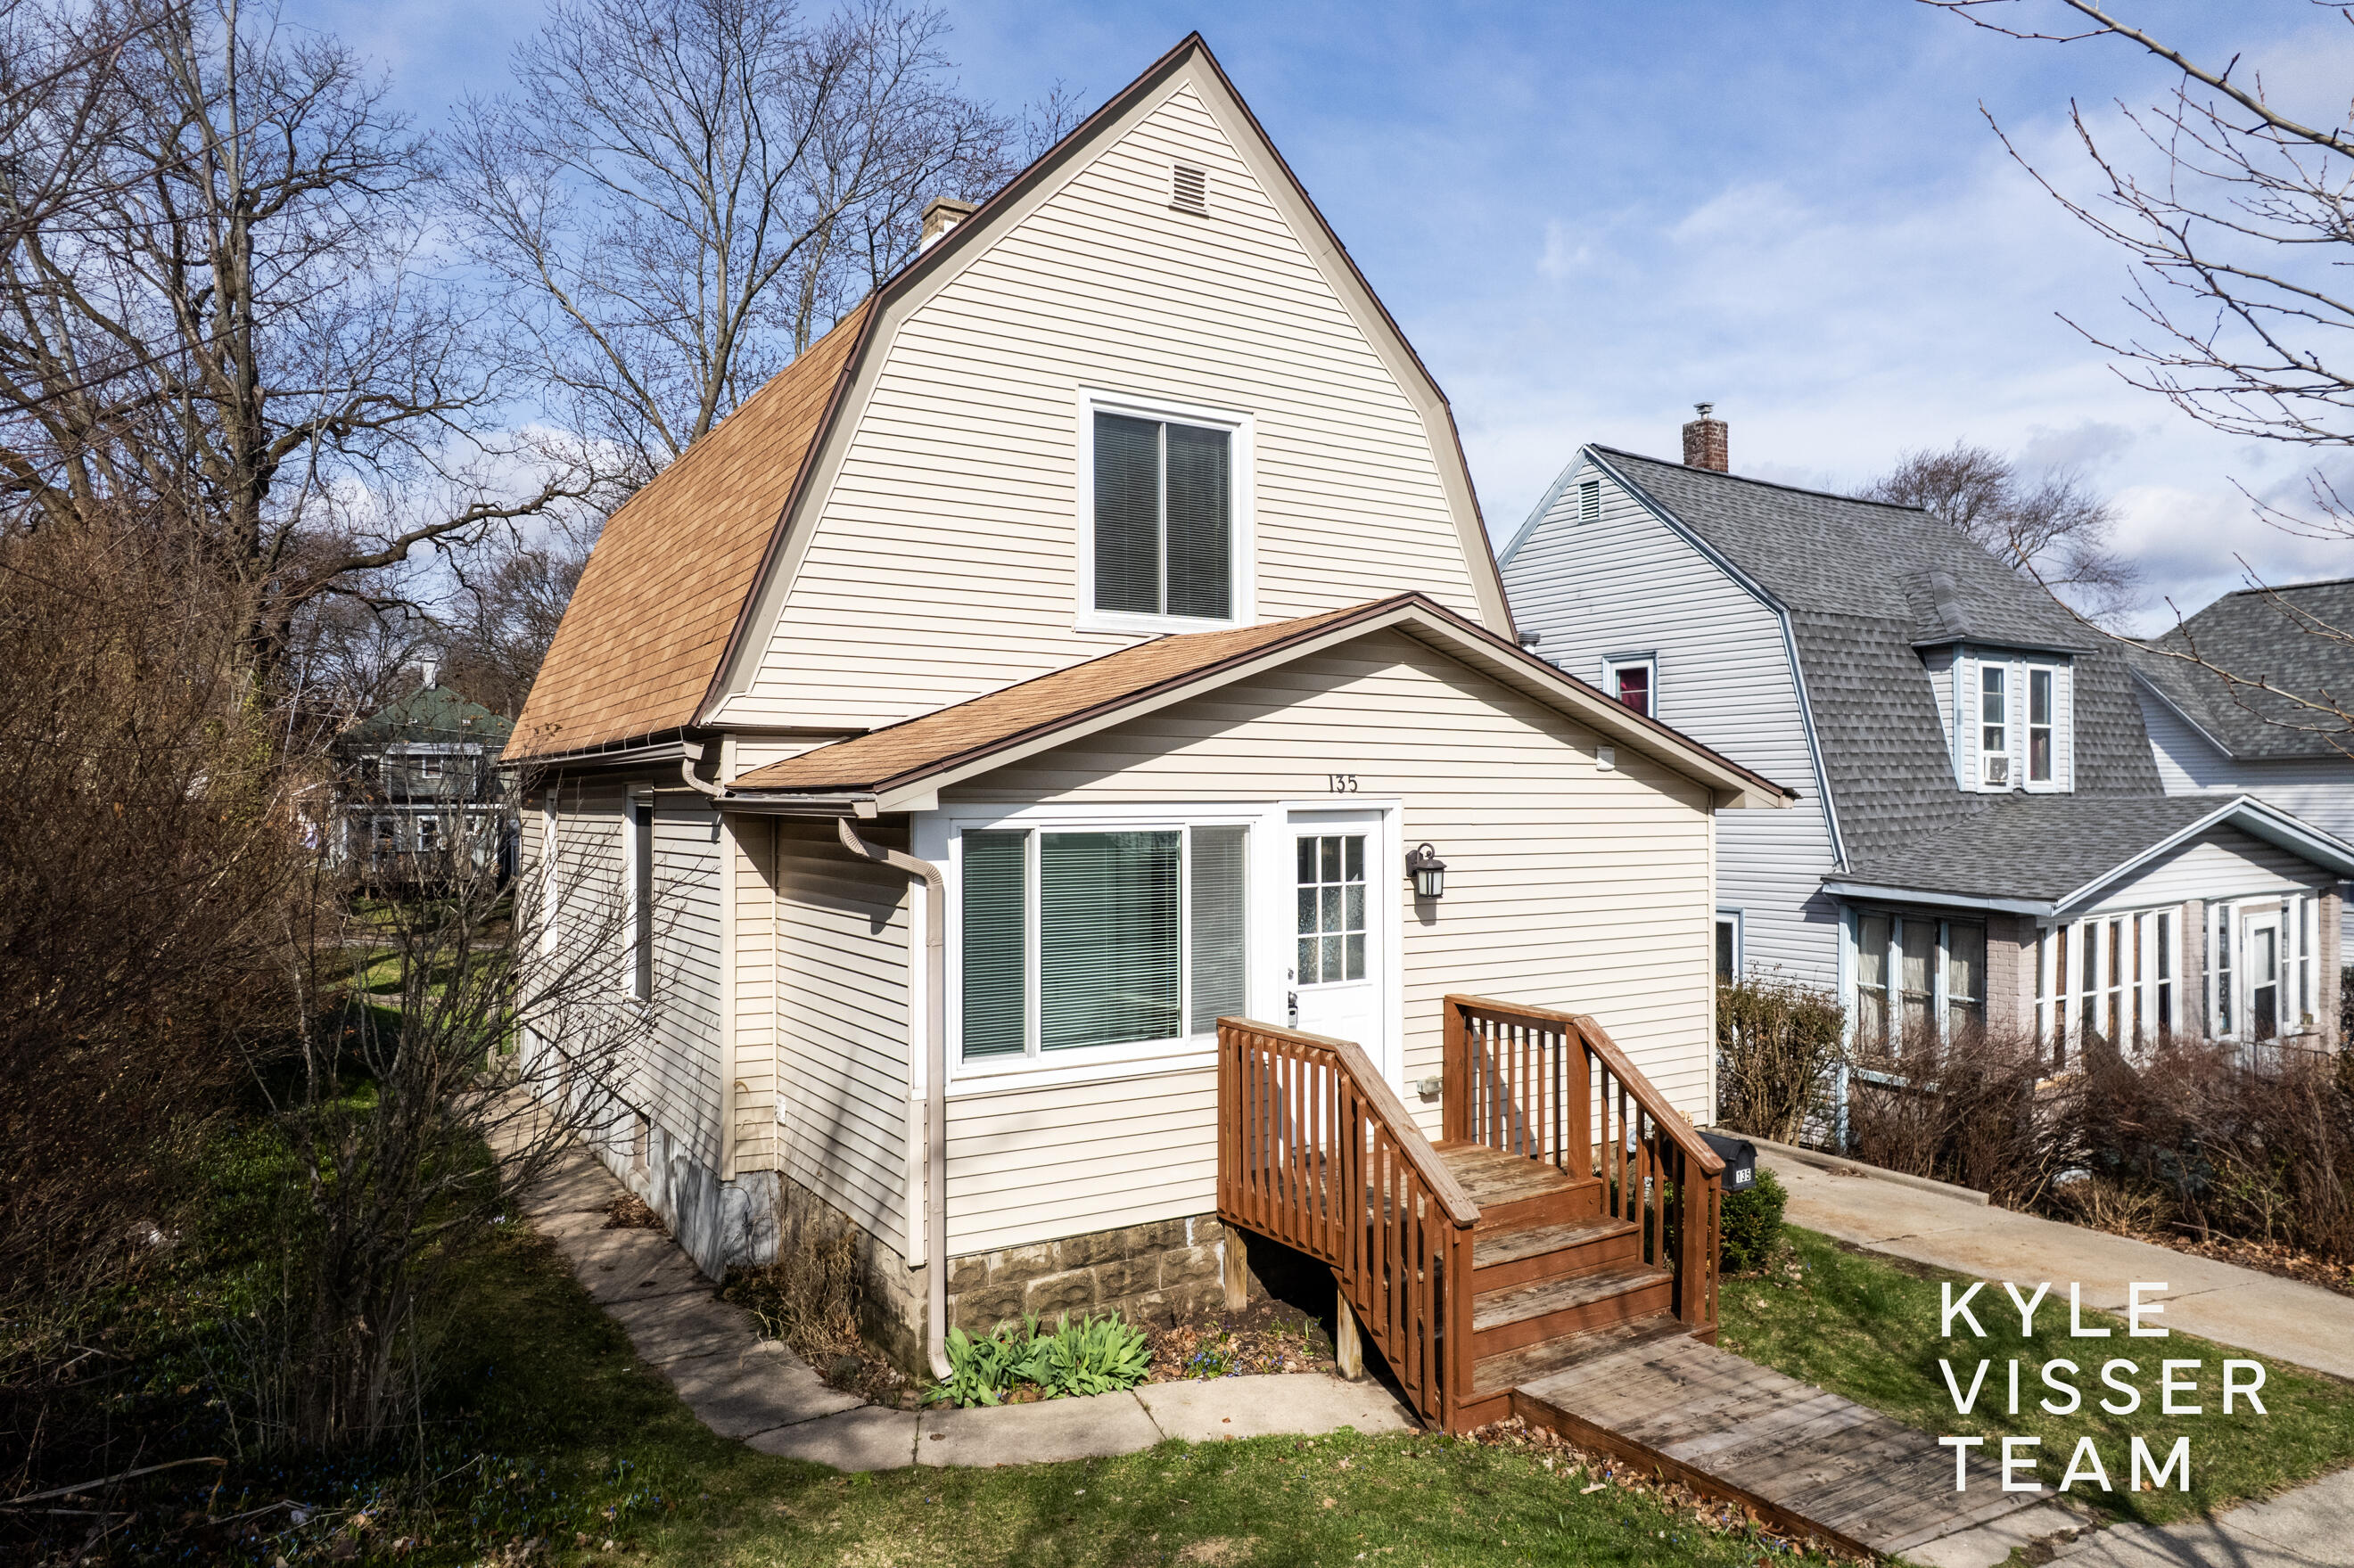
$285,000
3
bds
|
2
ba
|
1,218
sqft
|
built
1910
135 Houseman Ave NE, Grand Rapids, MI 49503
$-267
Cash flow
-4.9%
Cash-on-Cash Return
5.0%
Cap rate
0.8%
Rent to Value Ratio
Pending
$179,900
3
bds
|
1
ba
|
935
sqft
|
built
1840
335 Krakow Pl SW, Grand Rapids, MI 49504
$-60
Cash flow
-1.7%
Cash-on-Cash Return
5.7%
Cap rate
0.9%
Rent to Value Ratio
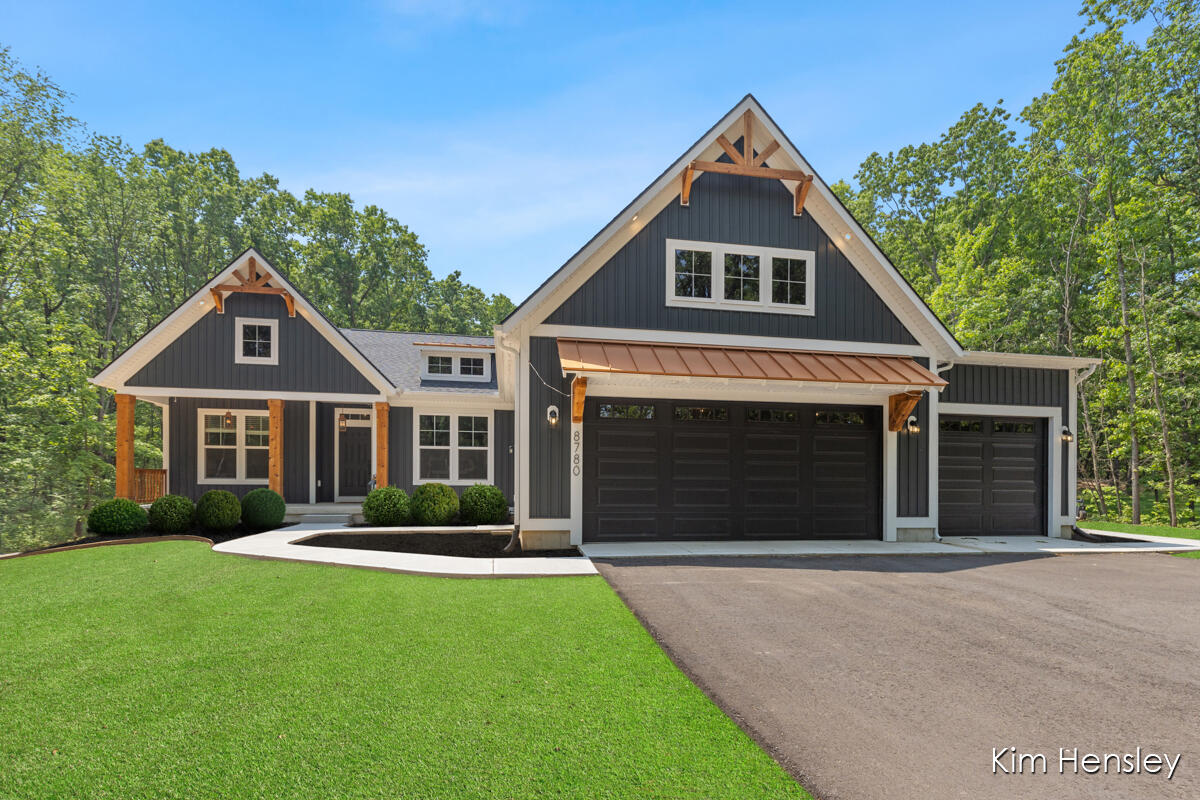
Active
$1,150,000
5
bds
|
4
ba
|
3,898
sqft
|
built
2024
8780 Bentham Ct, Rockford, MI 49341
$-2,942
Cash flow
-13.3%
Cash-on-Cash Return
3.1%
Cap rate
0.4%
Rent to Value Ratio

Active
$393,000
4
bds
|
2
ba
|
2,136
sqft
|
built
1997
11974 Myers Lake Ave NE, Cedar Springs, MI 49319
$-658
Cash flow
-8.7%
Cash-on-Cash Return
4.1%
Cap rate
0.6%
Rent to Value Ratio

Active
$315,000
1
bds
|
1
ba
|
731
sqft
|
built
1990
60 Campau Cir NW, Grand Rapids, MI 49503
$-1,083
Cash flow
-17.9%
Cash-on-Cash Return
2.0%
Cap rate
0.7%
Rent to Value Ratio
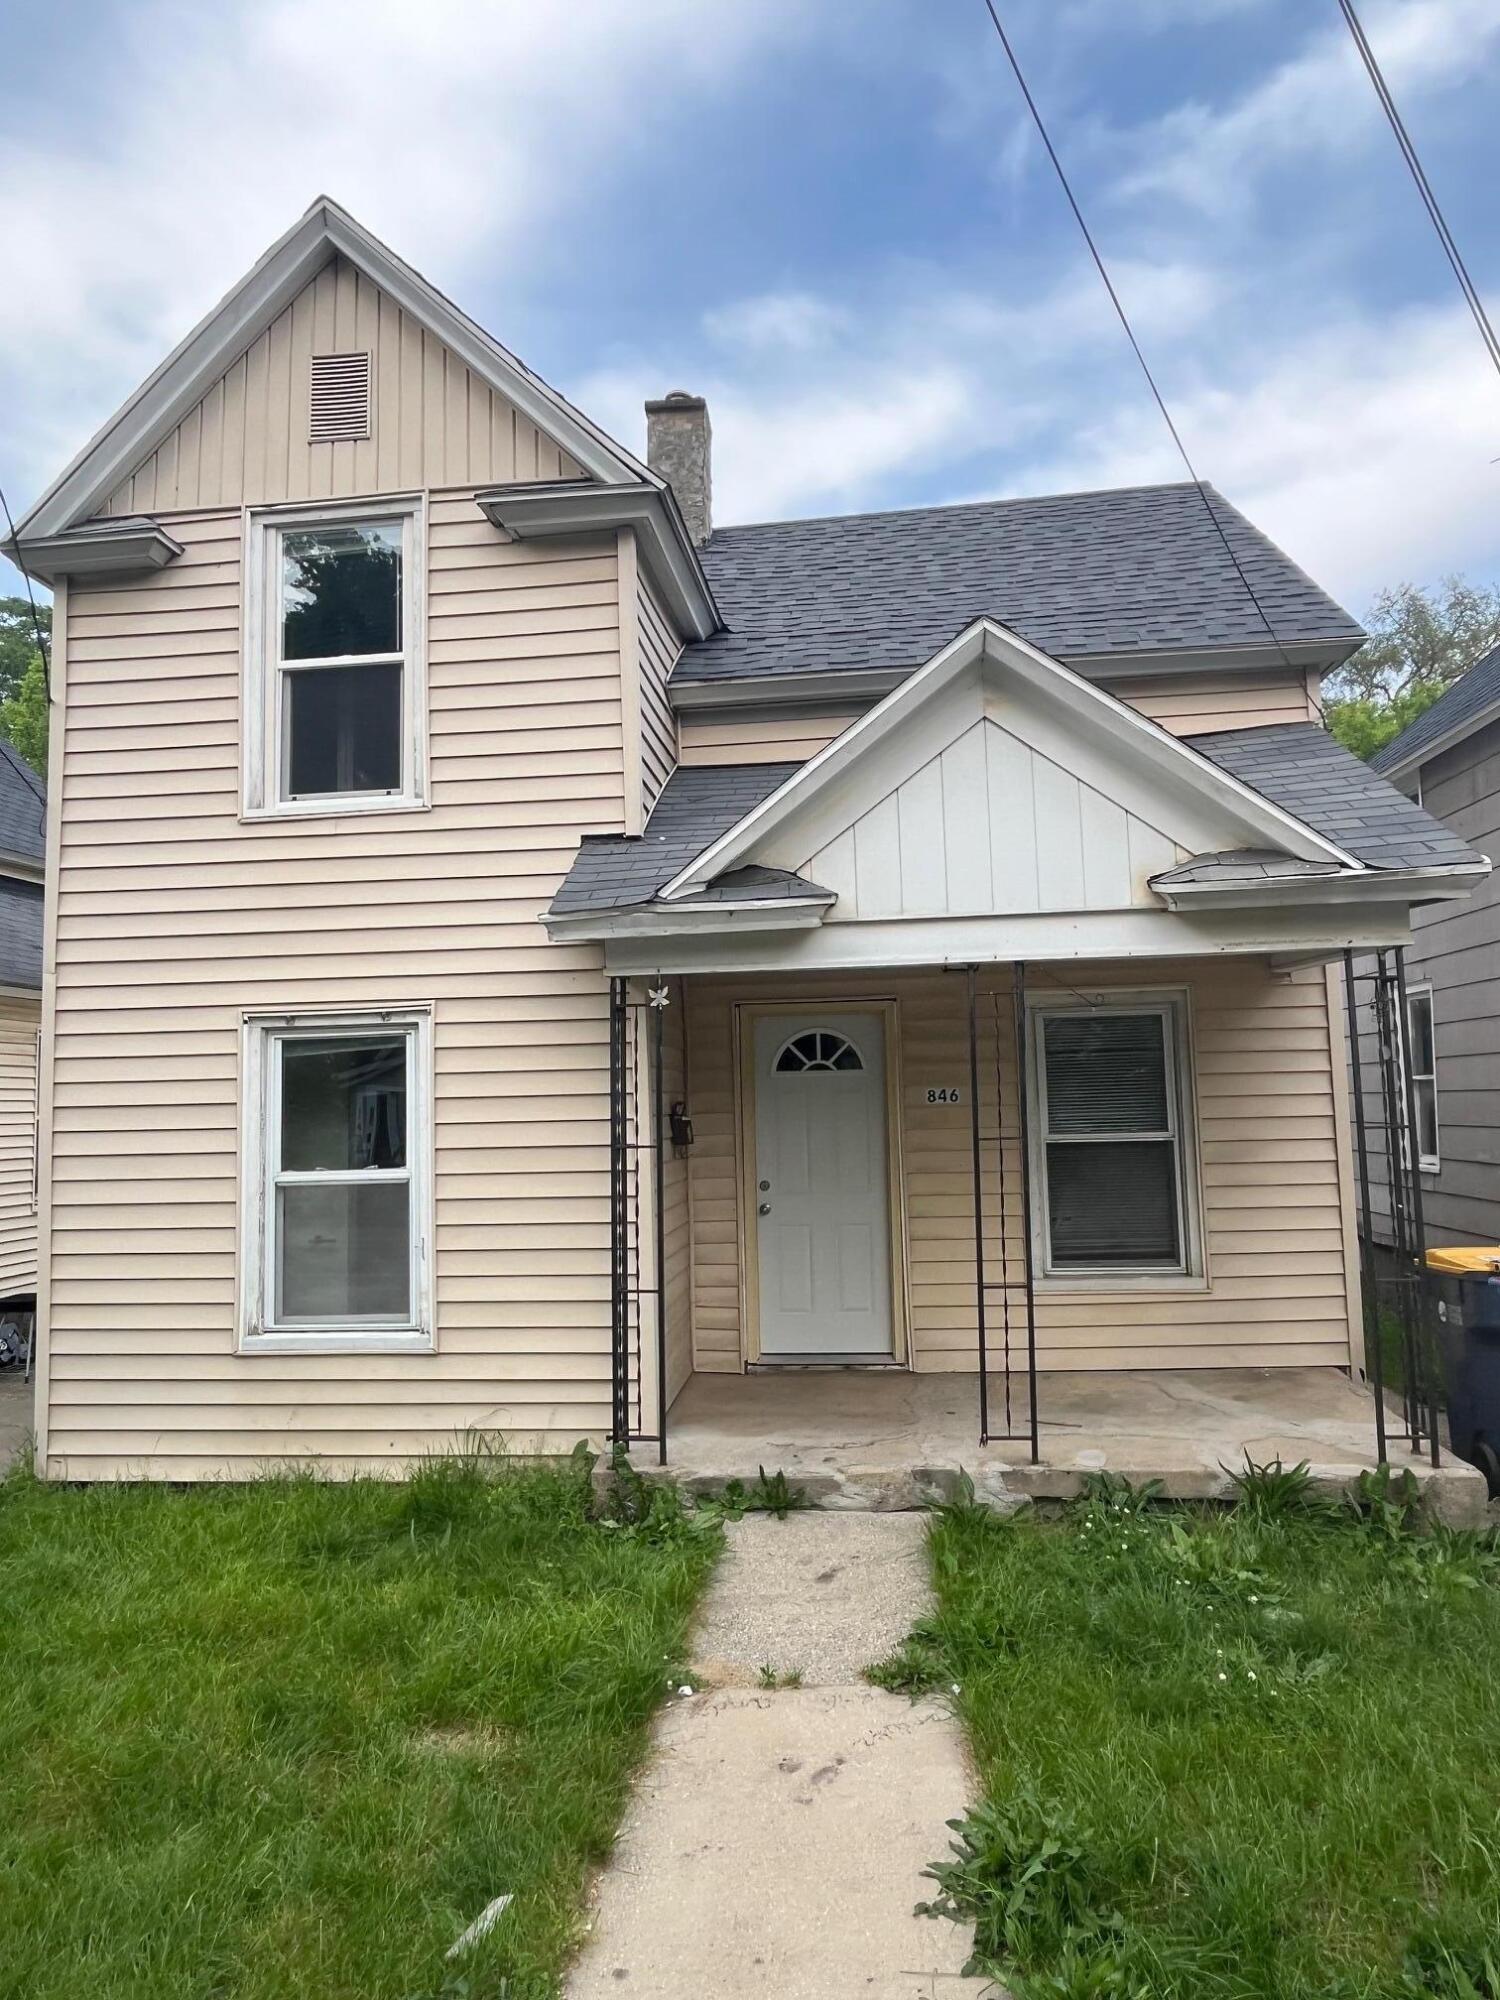
Active
$214,900
4
bds
|
1
ba
|
1,198
sqft
|
built
1880
846 Lafayette Ave NE, Grand Rapids, MI 49503
$-130
Cash flow
-3.2%
Cash-on-Cash Return
5.4%
Cap rate
0.8%
Rent to Value Ratio
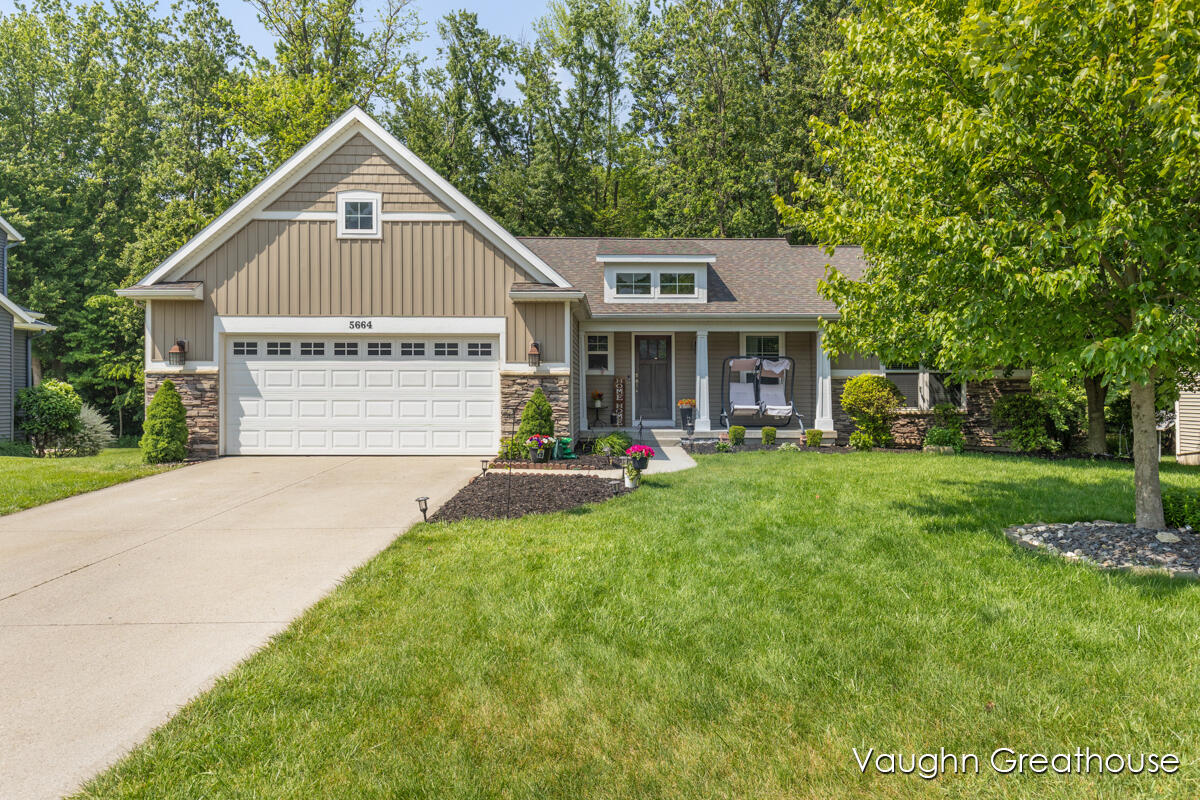
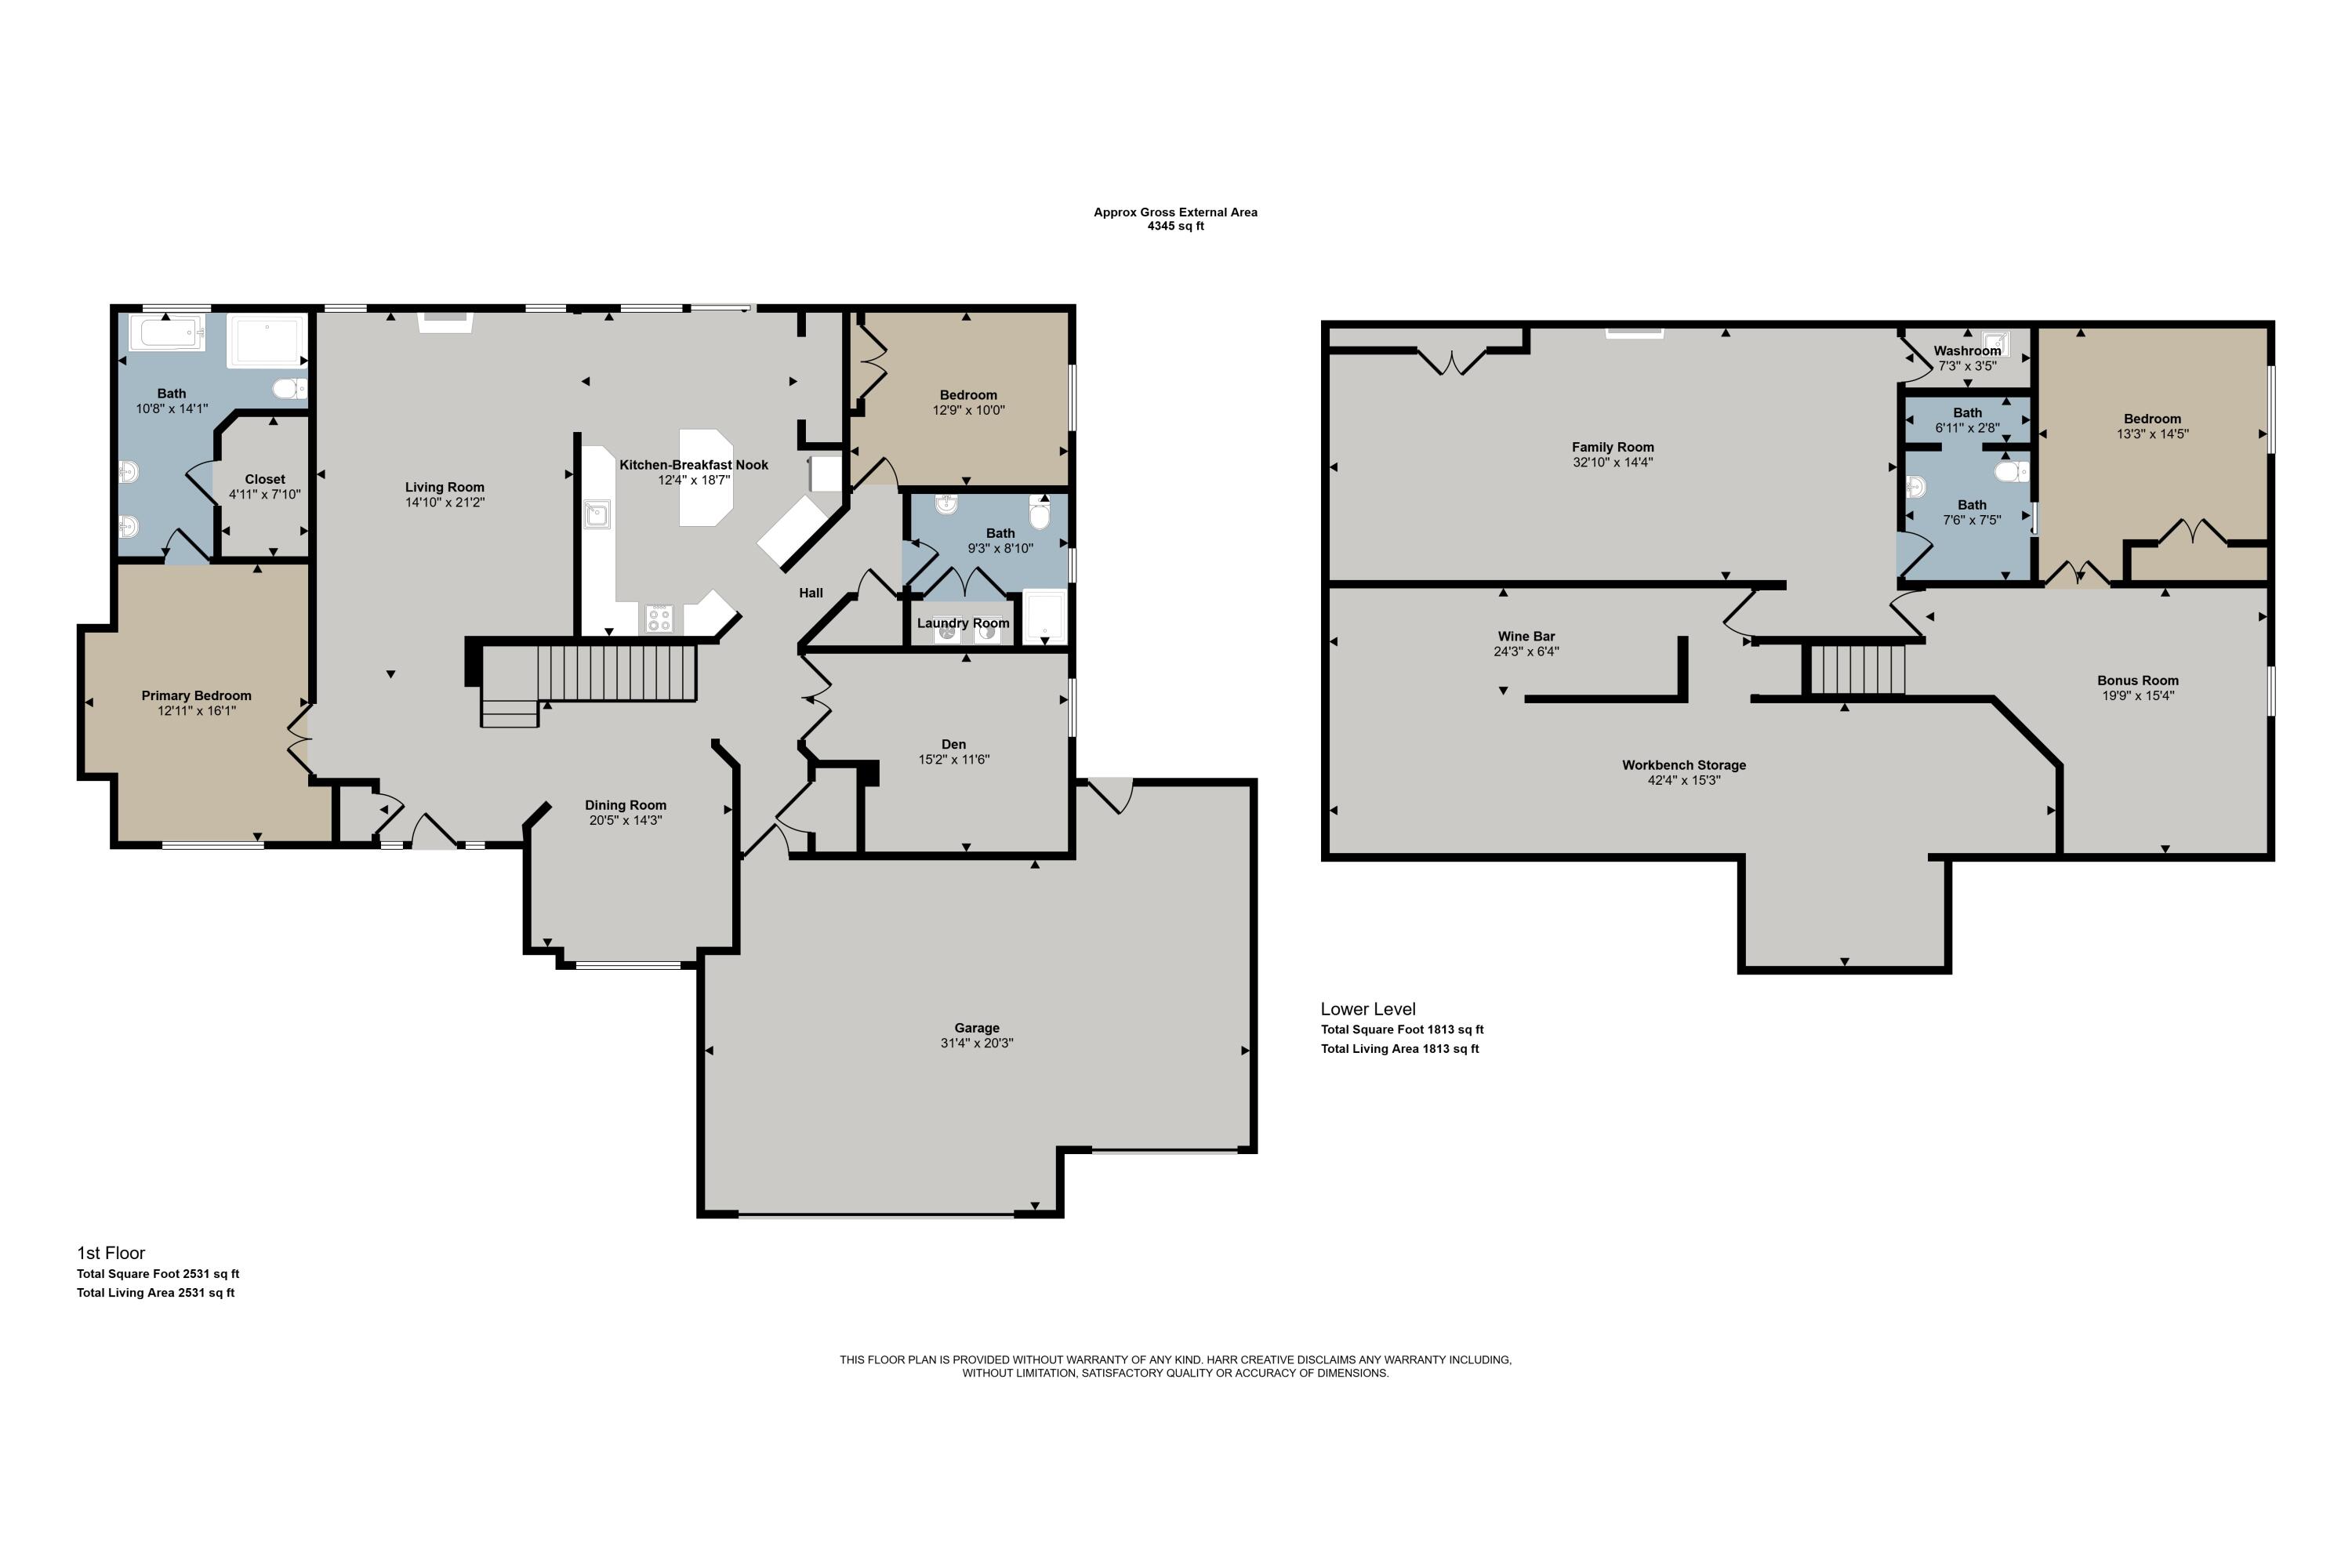
Active
$515,000
4
bds
|
3
ba
|
2,768
sqft
|
built
2010
5664 Kenstyn Dr SW, Wyoming, MI 49418
$-1,153
Cash flow
-11.7%
Cash-on-Cash Return
3.5%
Cap rate
0.6%
Rent to Value Ratio
Active
$748,900
4
bds
|
3
ba
|
3,164
sqft
|
built
1996
6350 Egypt Valley Ct NE, Ada, MI 49301
$-2,115
Cash flow
-14.7%
Cash-on-Cash Return
2.8%
Cap rate
0.4%
Rent to Value Ratio
Pending
$209,900
3
bds
|
1
ba
|
1,152
sqft
|
built
1948
36 Peony St SW, Grand Rapids, MI 49548
$184
Cash flow
4.6%
Cash-on-Cash Return
7.2%
Cap rate
1.0%
Rent to Value Ratio
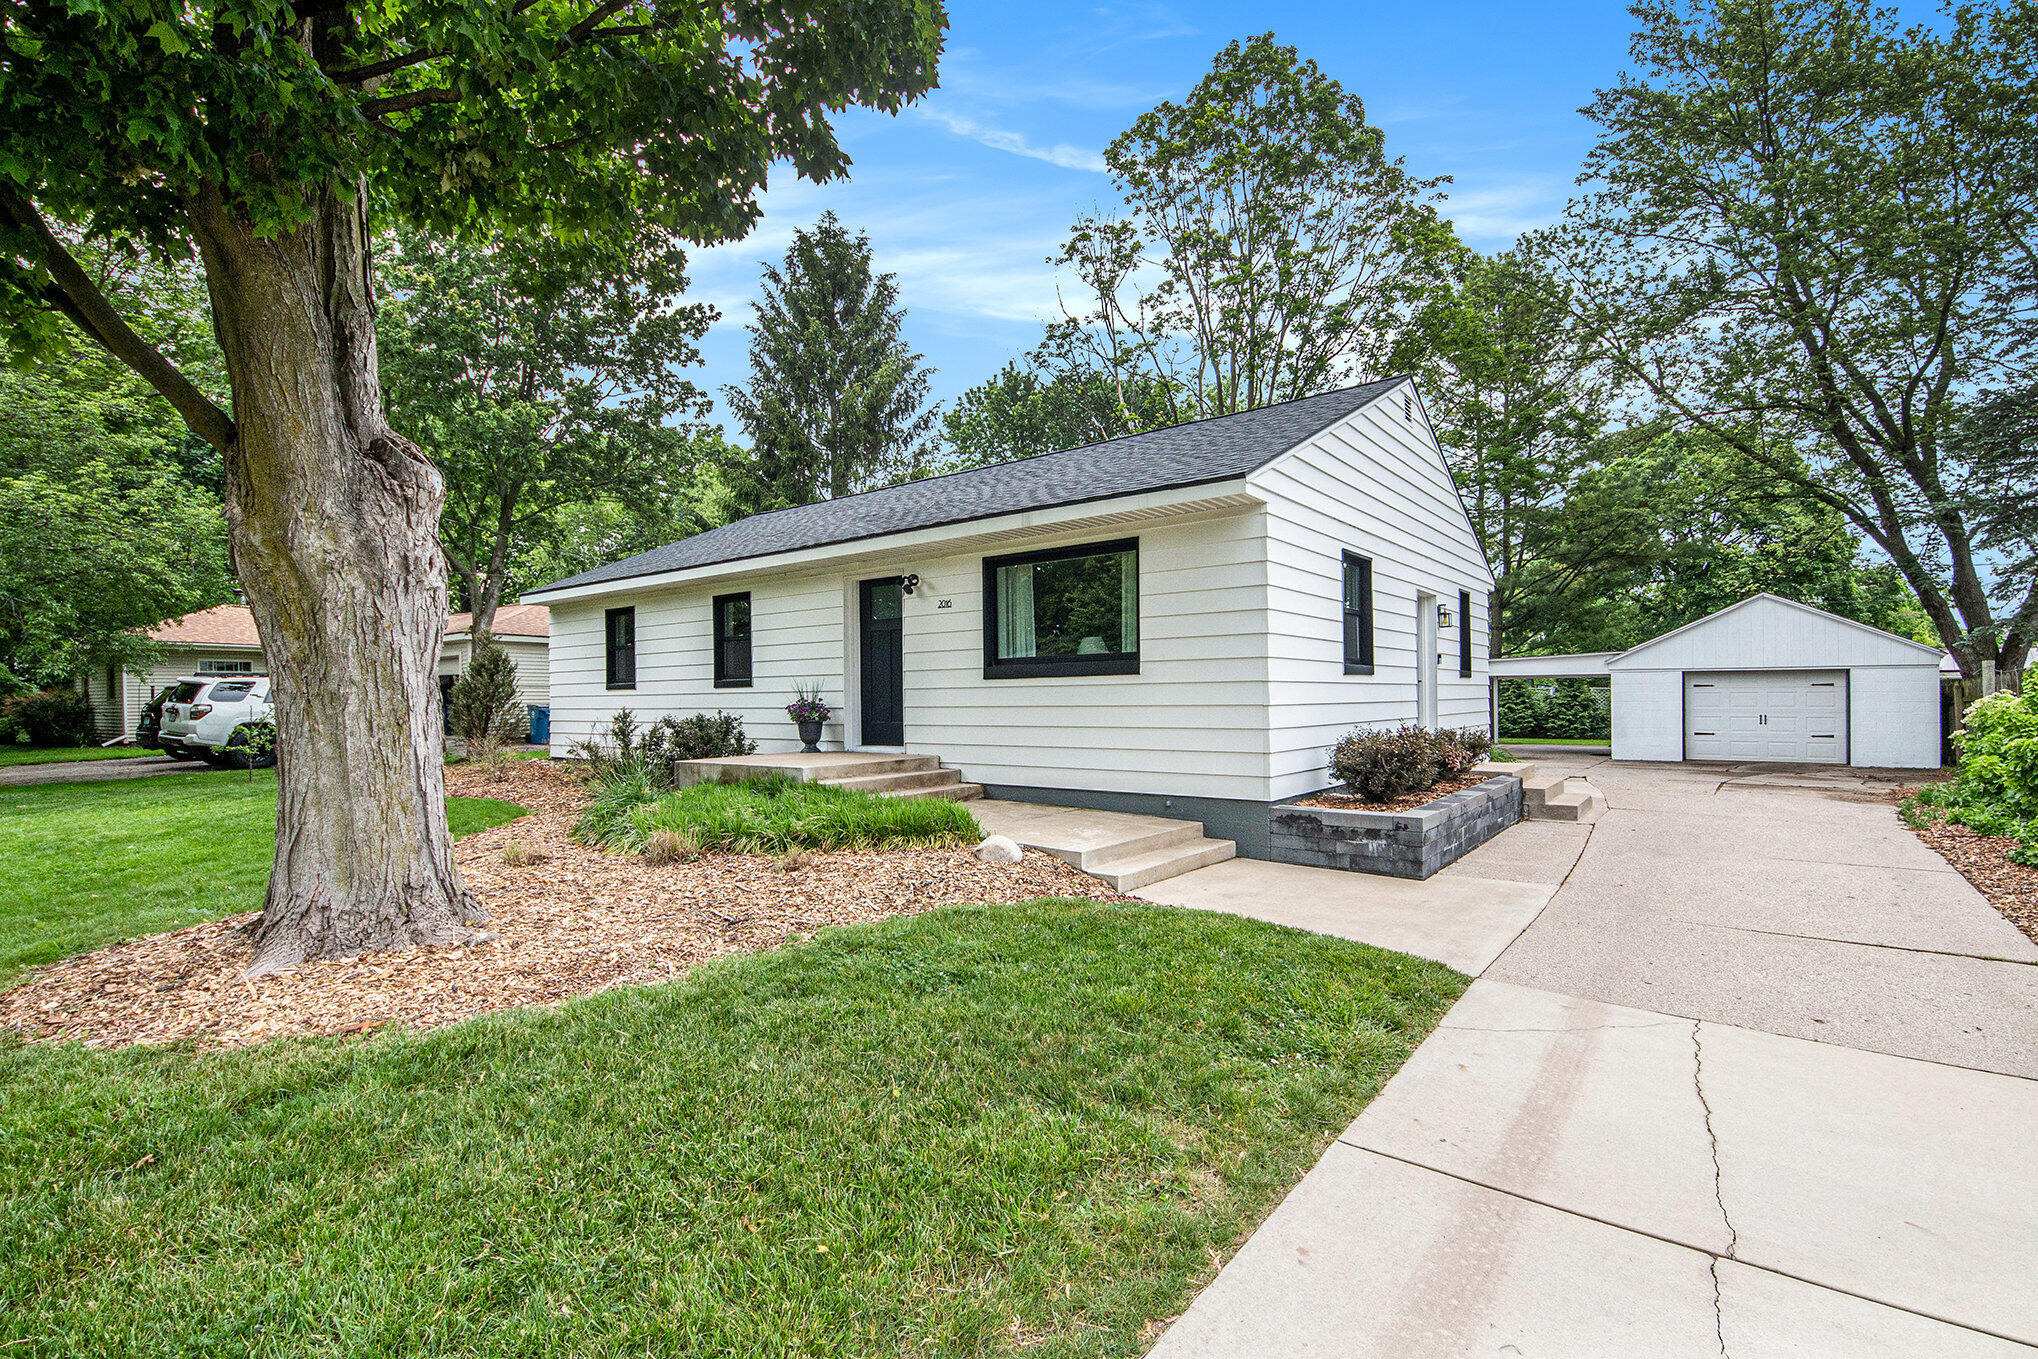
Pending
$424,900
3
bds
|
2
ba
|
2,372
sqft
|
built
1955
2016 Engleside Dr SE, Grand Rapids, MI 49546
$-1,131
Cash flow
-13.9%
Cash-on-Cash Return
3.0%
Cap rate
0.5%
Rent to Value Ratio

Active
$219,900
2
bds
|
1
ba
|
864
sqft
|
built
1927
1835 Thelma Ave SE, Grand Rapids, MI 49507
$-240
Cash flow
-5.7%
Cash-on-Cash Return
4.8%
Cap rate
0.7%
Rent to Value Ratio

Pending
$335,000
3
bds
|
2
ba
|
1,619
sqft
|
built
1954
740 Halena St NE, Grand Rapids, MI 49505
$-400
Cash flow
-6.2%
Cash-on-Cash Return
4.7%
Cap rate
0.7%
Rent to Value Ratio

Active
$470,000
5
bds
|
4
ba
|
3,296
sqft
|
built
1997
2567 Golfbury Dr SW, Wyoming, MI 49519
$-615
Cash flow
-6.8%
Cash-on-Cash Return
4.6%
Cap rate
0.7%
Rent to Value Ratio
Active
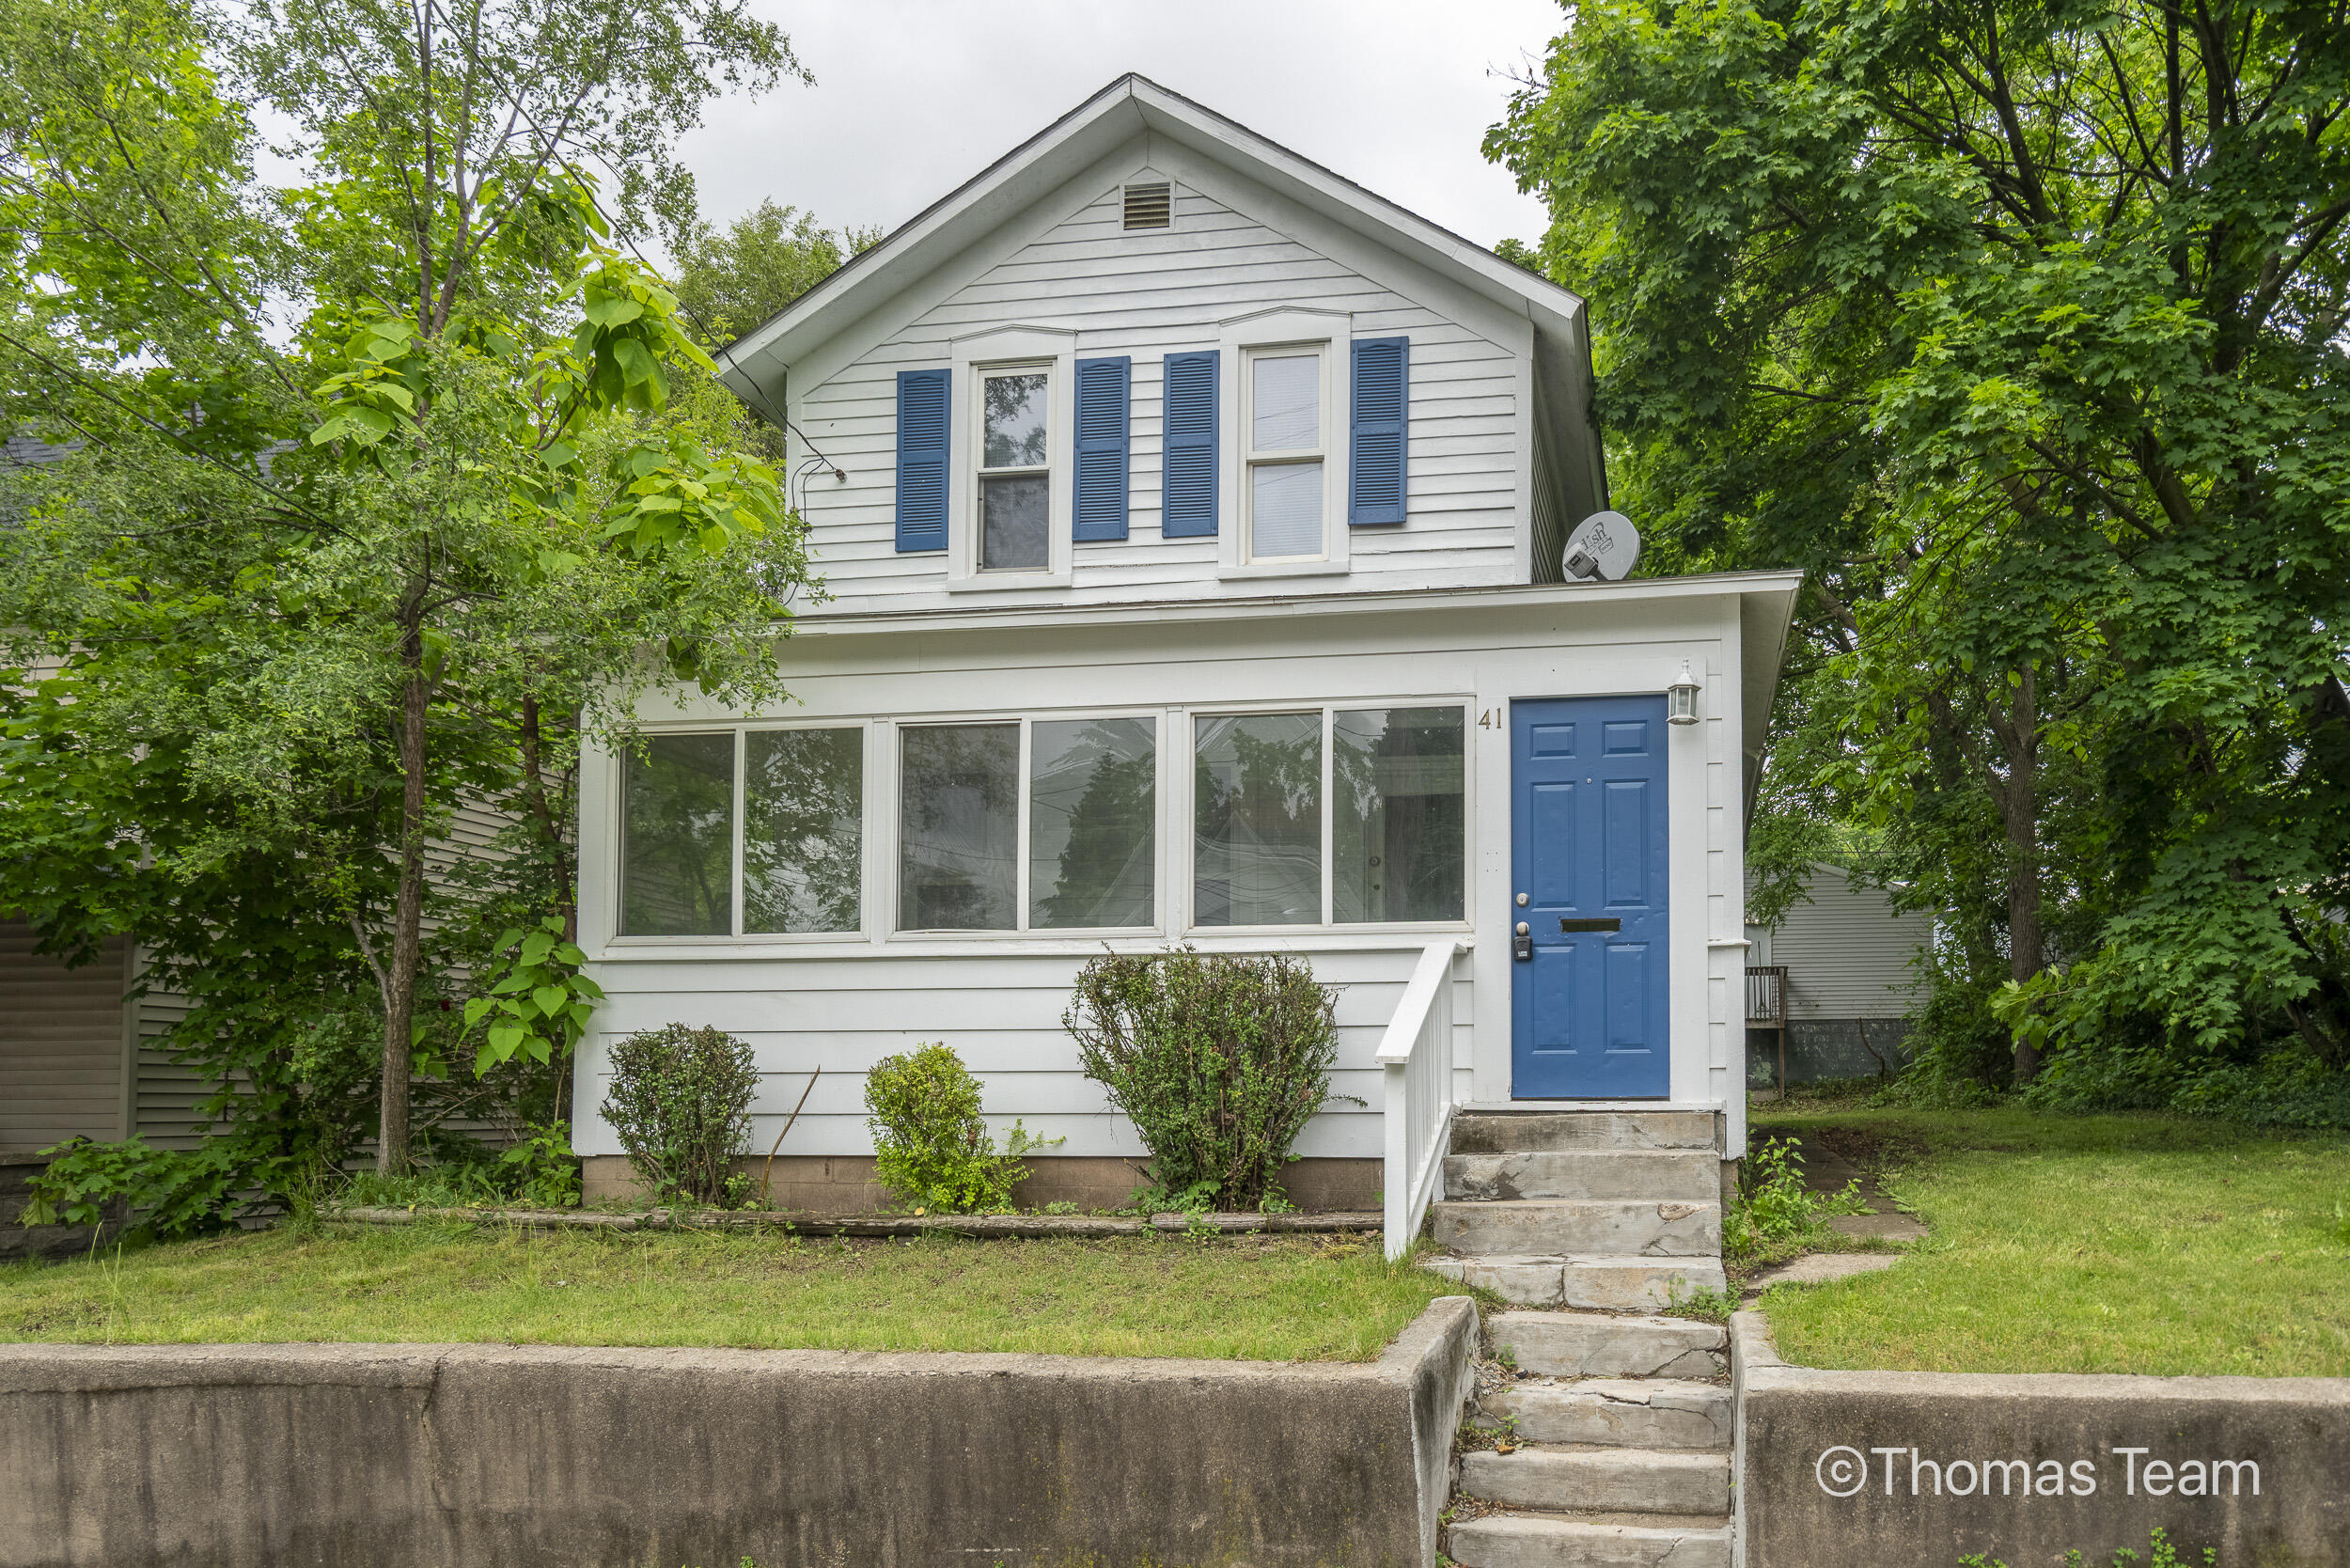
$229,900
3
bds
|
1
ba
|
1,144
sqft
|
built
1885
41 Grove St NE, Grand Rapids, MI 49505
$-72
Cash flow
-1.6%
Cash-on-Cash Return
5.8%
Cap rate
0.8%
Rent to Value Ratio

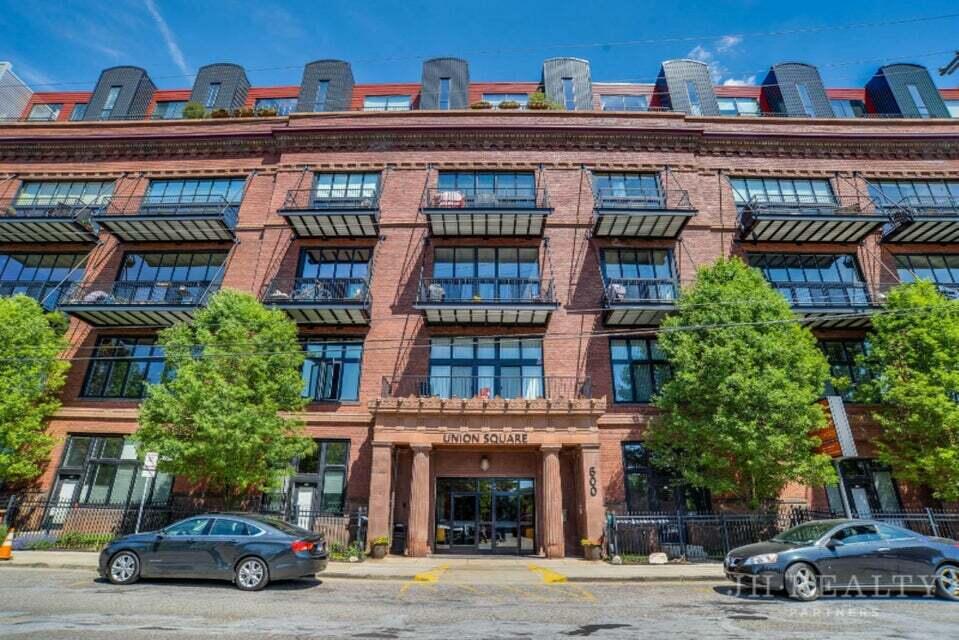
Active
$199,000
1
bds
|
1
ba
|
559
sqft
|
built
2014
600 Douglas St NW, Grand Rapids, MI 49504
$-604
Cash flow
-15.8%
Cash-on-Cash Return
2.5%
Cap rate
0.7%
Rent to Value Ratio

Active
$625,000
5
bds
|
3
ba
|
3,457
sqft
|
built
1968
8680 Bennett St SE, Ada, MI 49301
$-1,173
Cash flow
-9.8%
Cash-on-Cash Return
3.9%
Cap rate
0.6%
Rent to Value Ratio
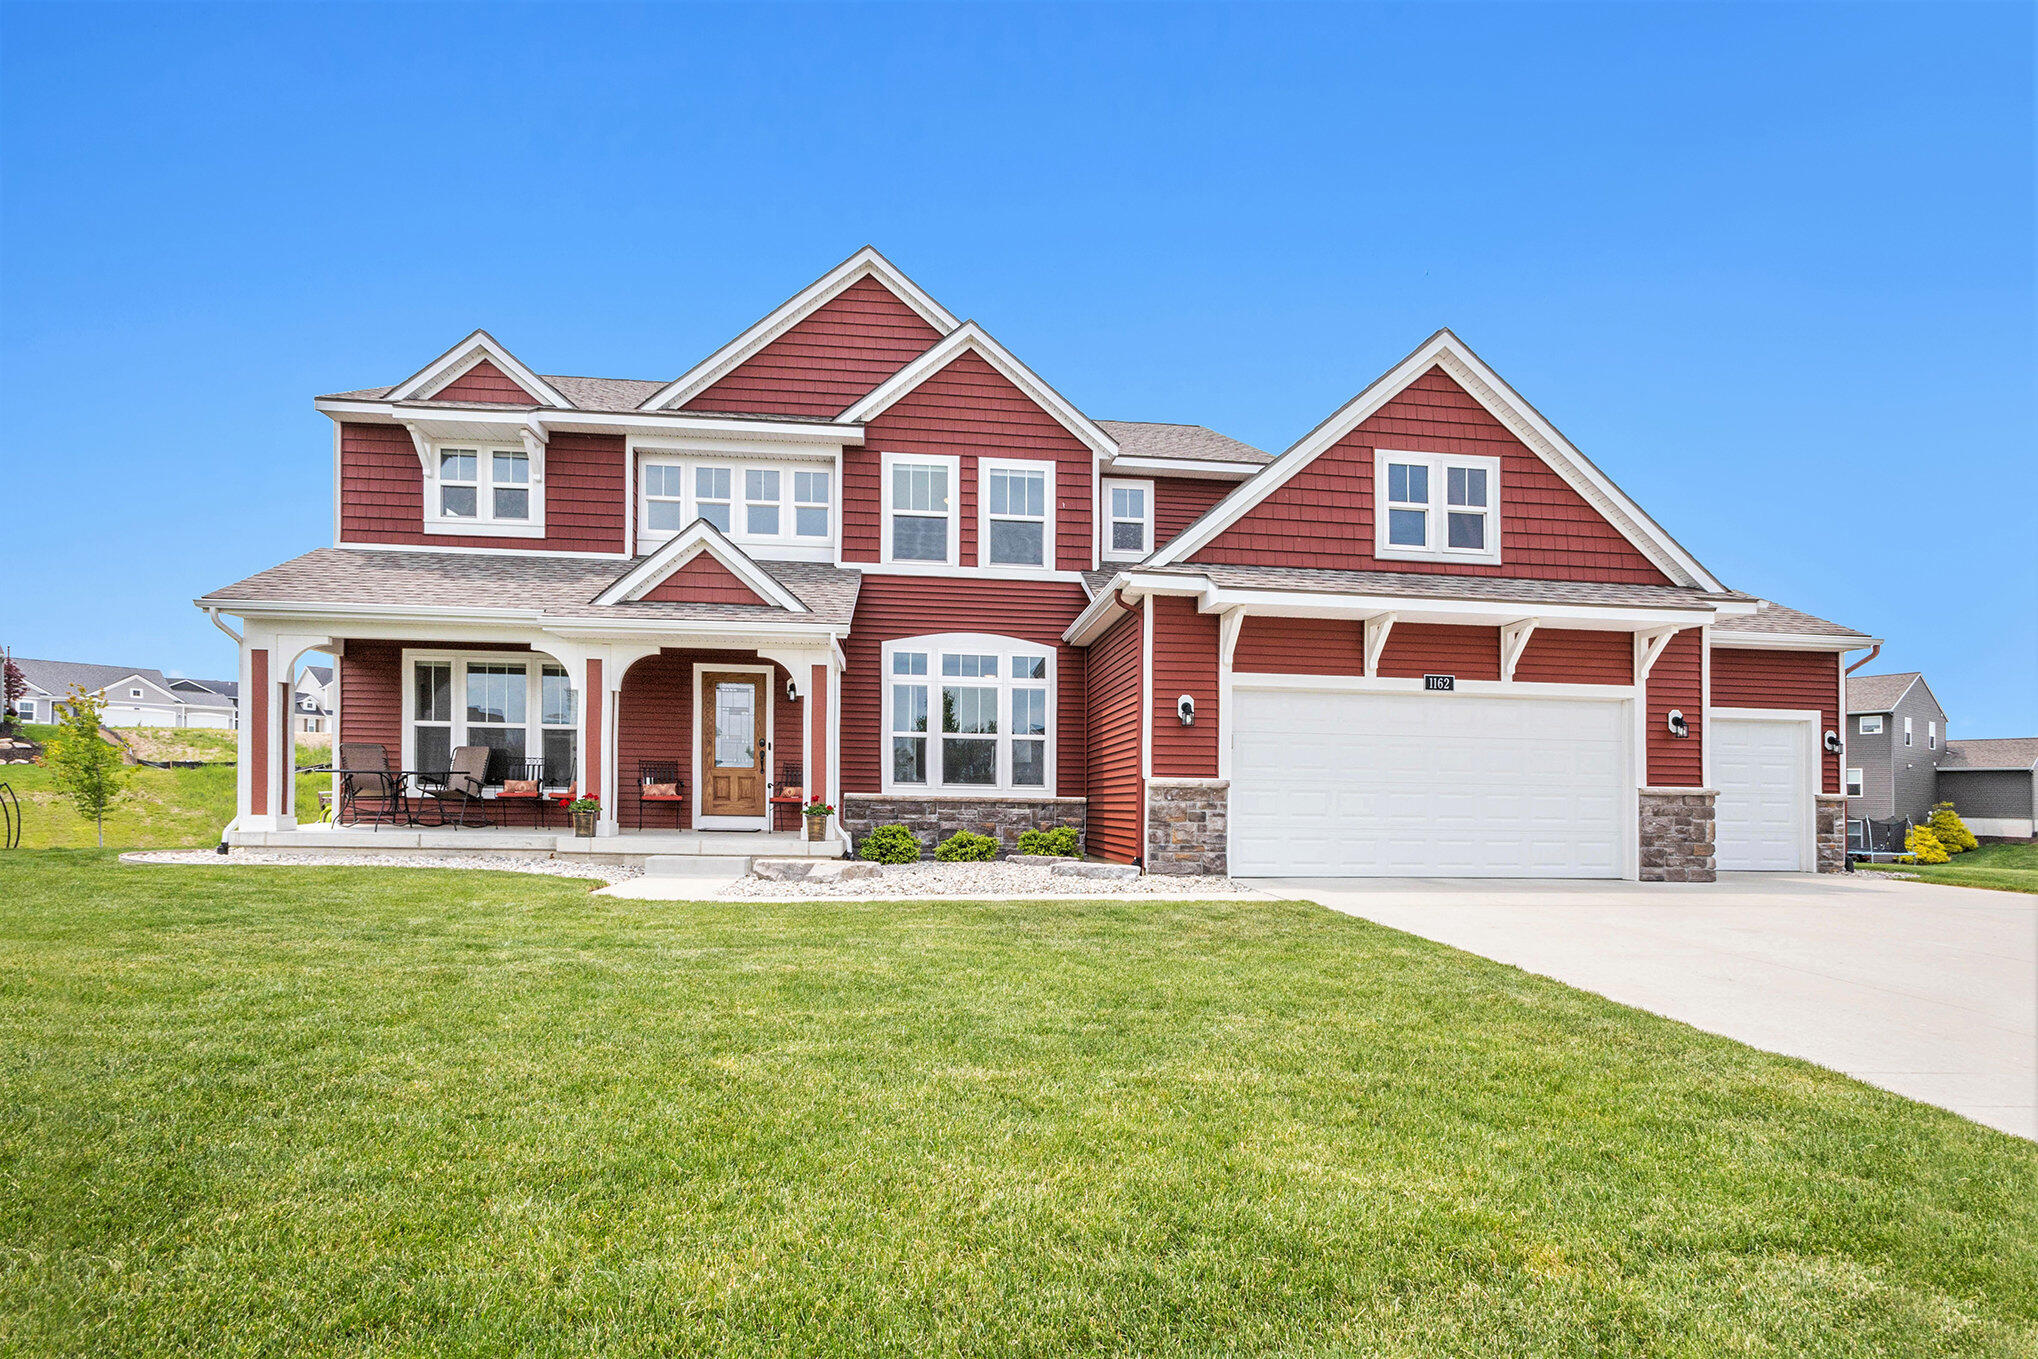
Active
$649,900
5
bds
|
3
ba
|
3,806
sqft
|
built
2021
1162 Cooks Corner Ct, Byron Center, MI 49315
$-1,874
Cash flow
-15.0%
Cash-on-Cash Return
2.7%
Cap rate
0.5%
Rent to Value Ratio
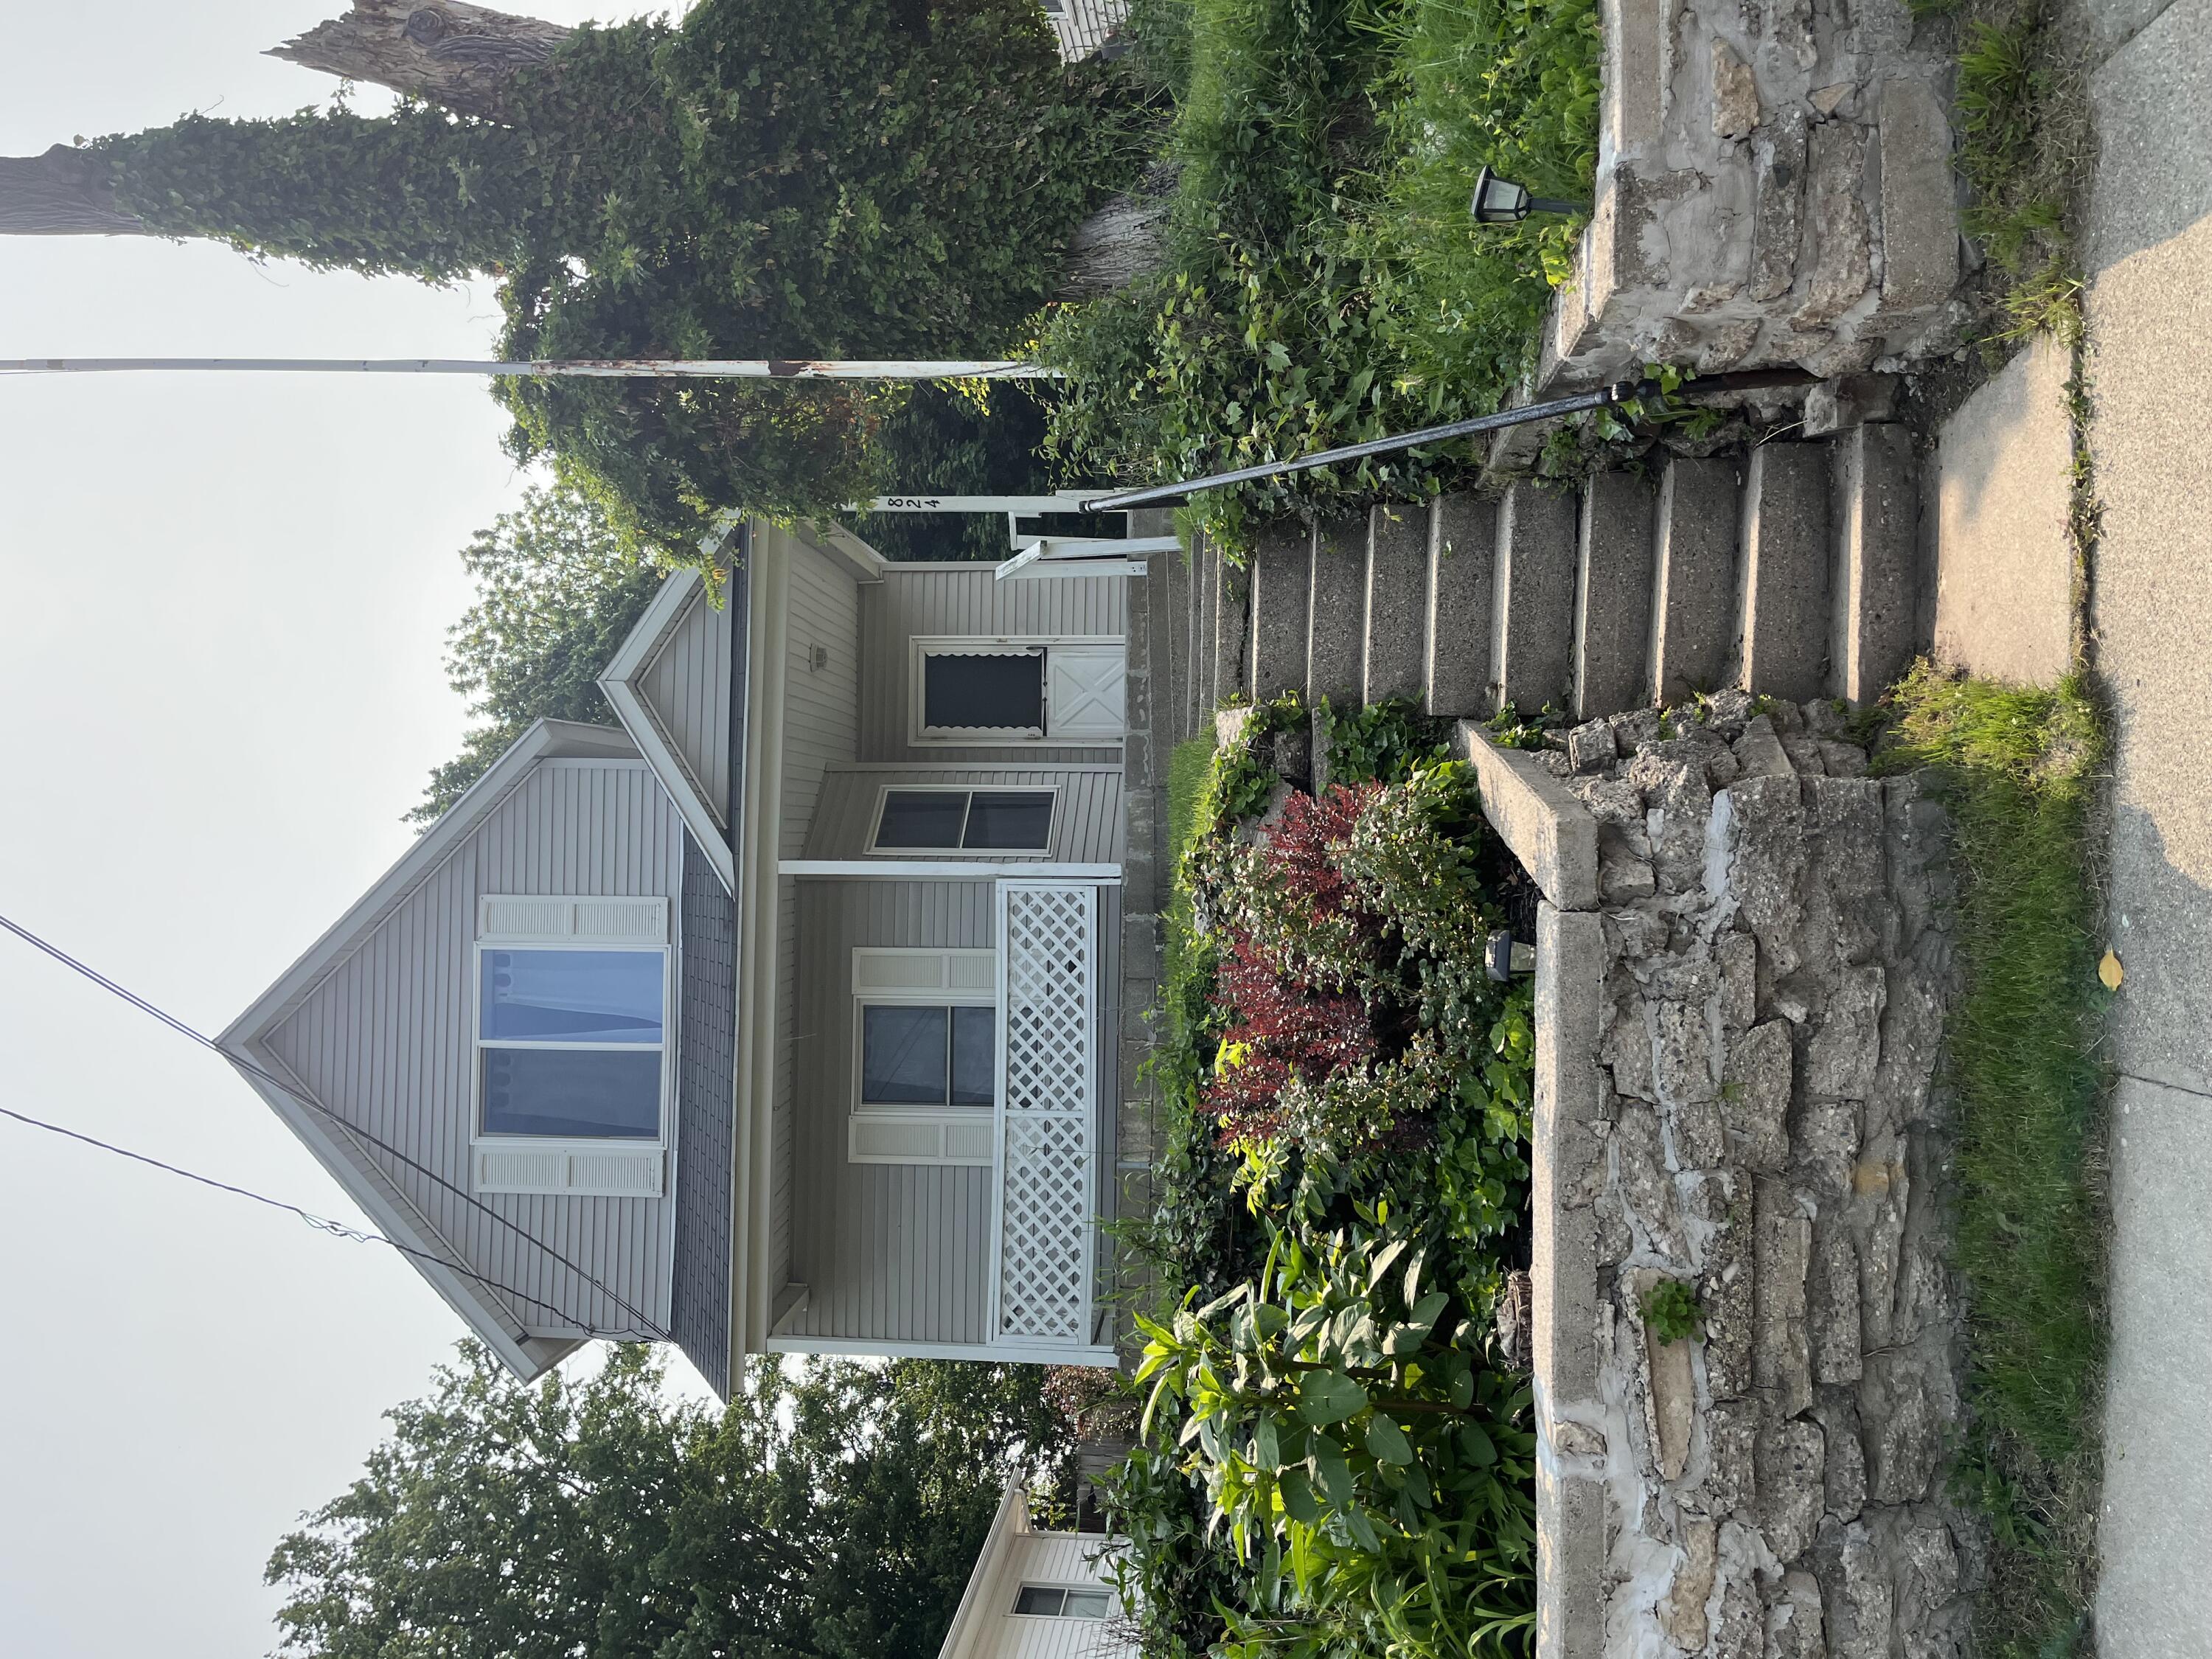
Active
$269,000
3
bds
|
1
ba
|
1,054
sqft
|
built
1880
824 Emerald Ave NE, Grand Rapids, MI 49503
$-604
Cash flow
-11.7%
Cash-on-Cash Return
3.5%
Cap rate
0.6%
Rent to Value Ratio

Active
$564,900
5
bds
|
4
ba
|
2,838
sqft
|
built
2023
623 Elstar Dr, Rockford, MI 49341
$-1,720
Cash flow
-15.9%
Cash-on-Cash Return
2.5%
Cap rate
0.5%
Rent to Value Ratio
Active
$299,000
2
bds
|
2
ba
|
0
sqft
|
built
1900
600 Broadway Ave NW, Grand Rapids, MI 49504
$-1,288
Cash flow
-22.5%
Cash-on-Cash Return
1.0%
Cap rate
0.7%
Rent to Value Ratio
Active
$750,000
4
bds
|
3
ba
|
2,750
sqft
|
built
1993
240 Pettis Ave NE, Ada, MI 49301
$-2,185
Cash flow
-15.2%
Cash-on-Cash Return
2.7%
Cap rate
0.4%
Rent to Value Ratio
Active
$925,000
4
bds
|
4
ba
|
3,890
sqft
|
built
1989
2409 Ridgecroft Ave SE, Grand Rapids, MI 49546
$-2,620
Cash flow
-14.8%
Cash-on-Cash Return
2.7%
Cap rate
0.4%
Rent to Value Ratio