Kent County Investment Properties for Sale
Browse homes for sale and investment properties in Kent County. Refine your search by price, property type, or more.
Best cash flowing properties in Kent County
Active
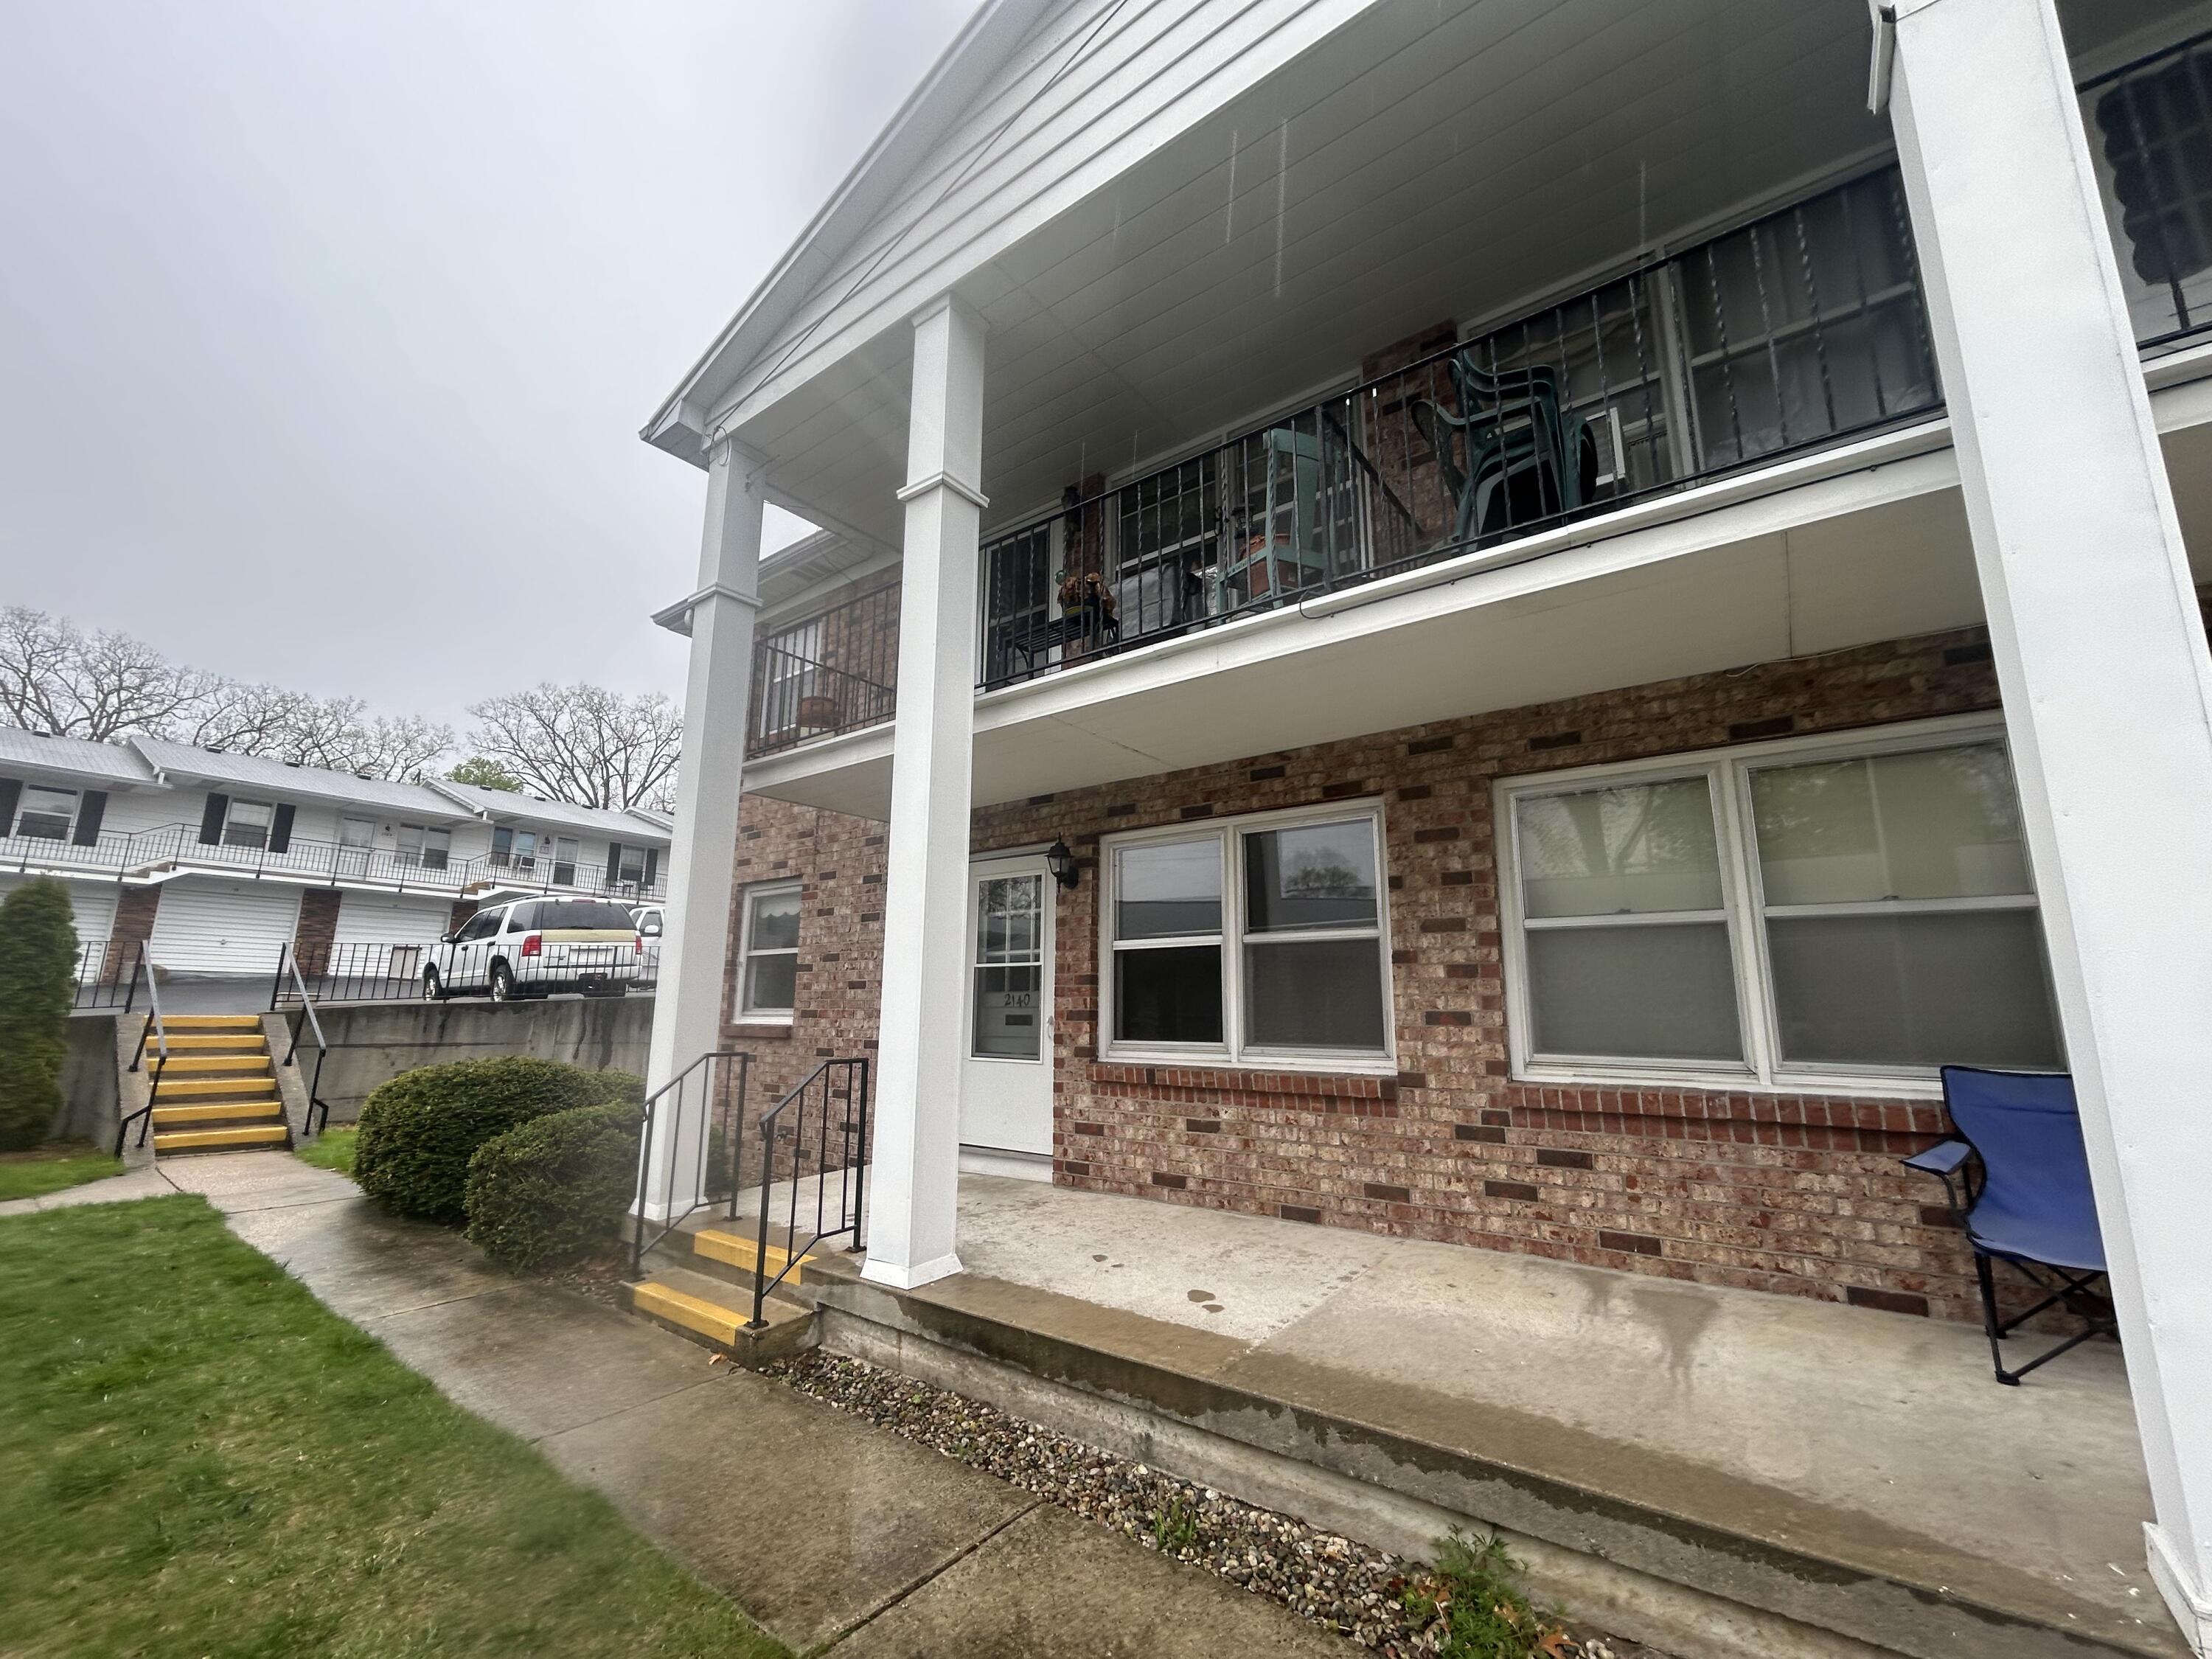
$65,000
1
bds
|
1
ba
|
600
sqft
|
built
1968
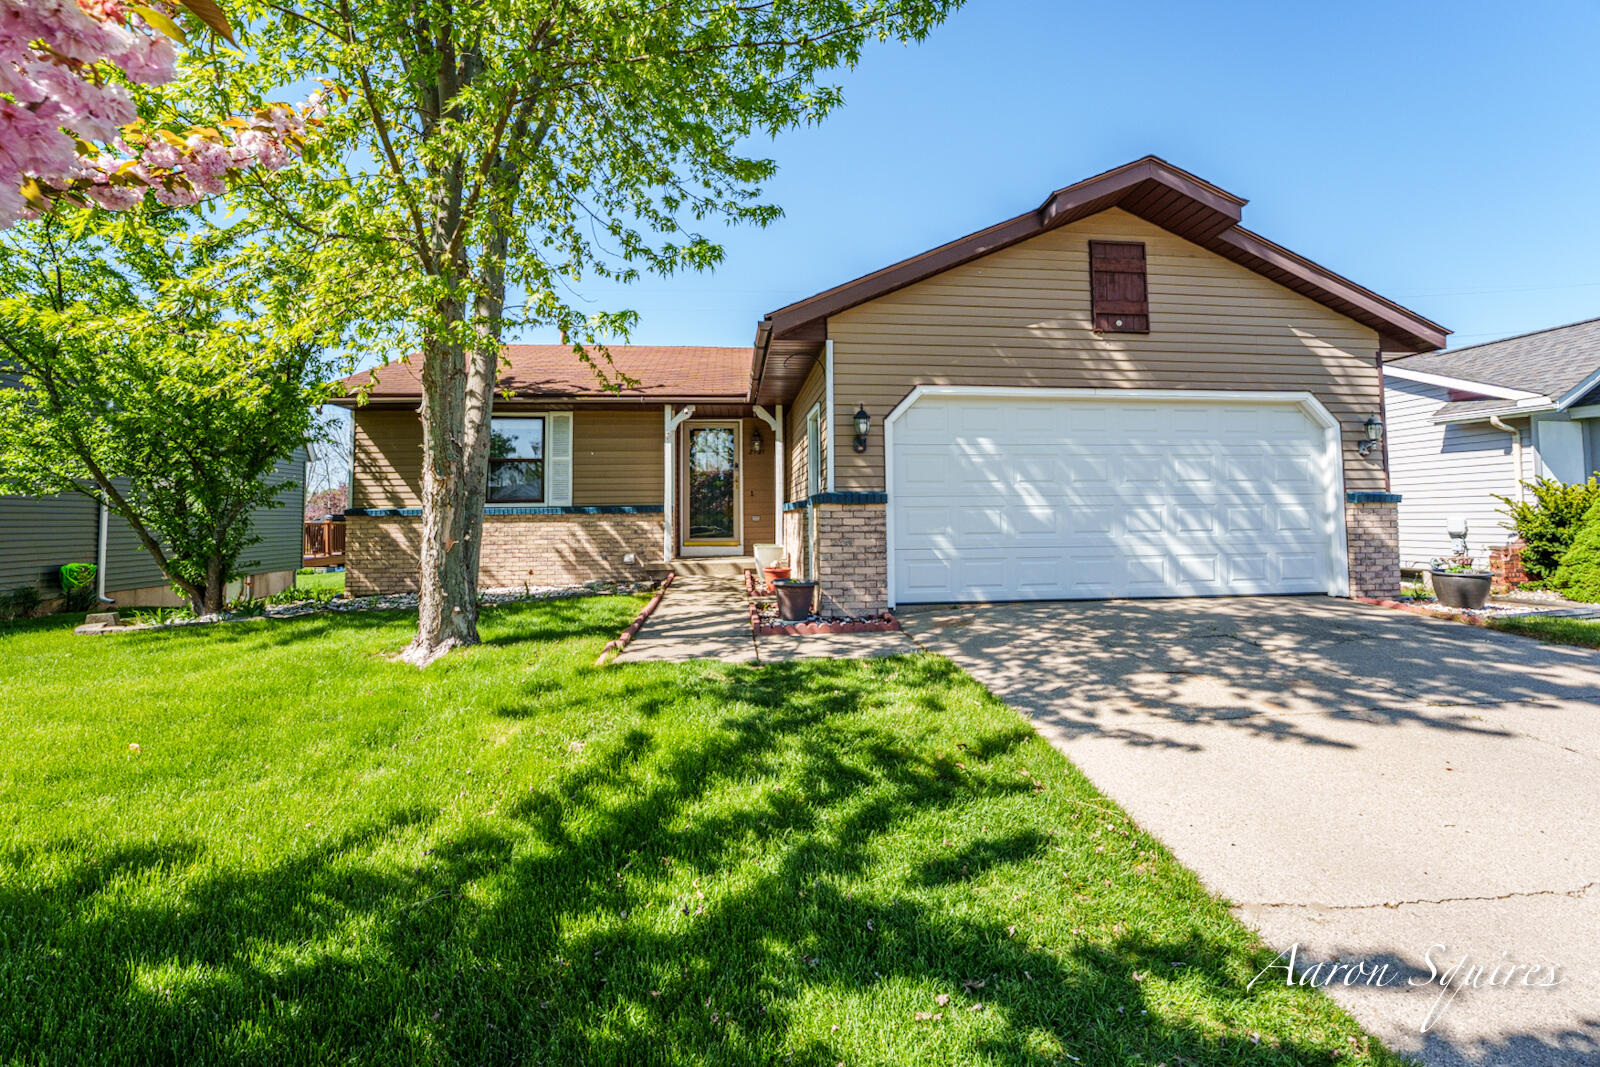
2140 Banner Dr SW, Wyoming, MI 49509
$322
Cash flow
5.8%
Cash-on-Cash Return
5.9%
Cap rate
2.0%
Rent to Value Ratio
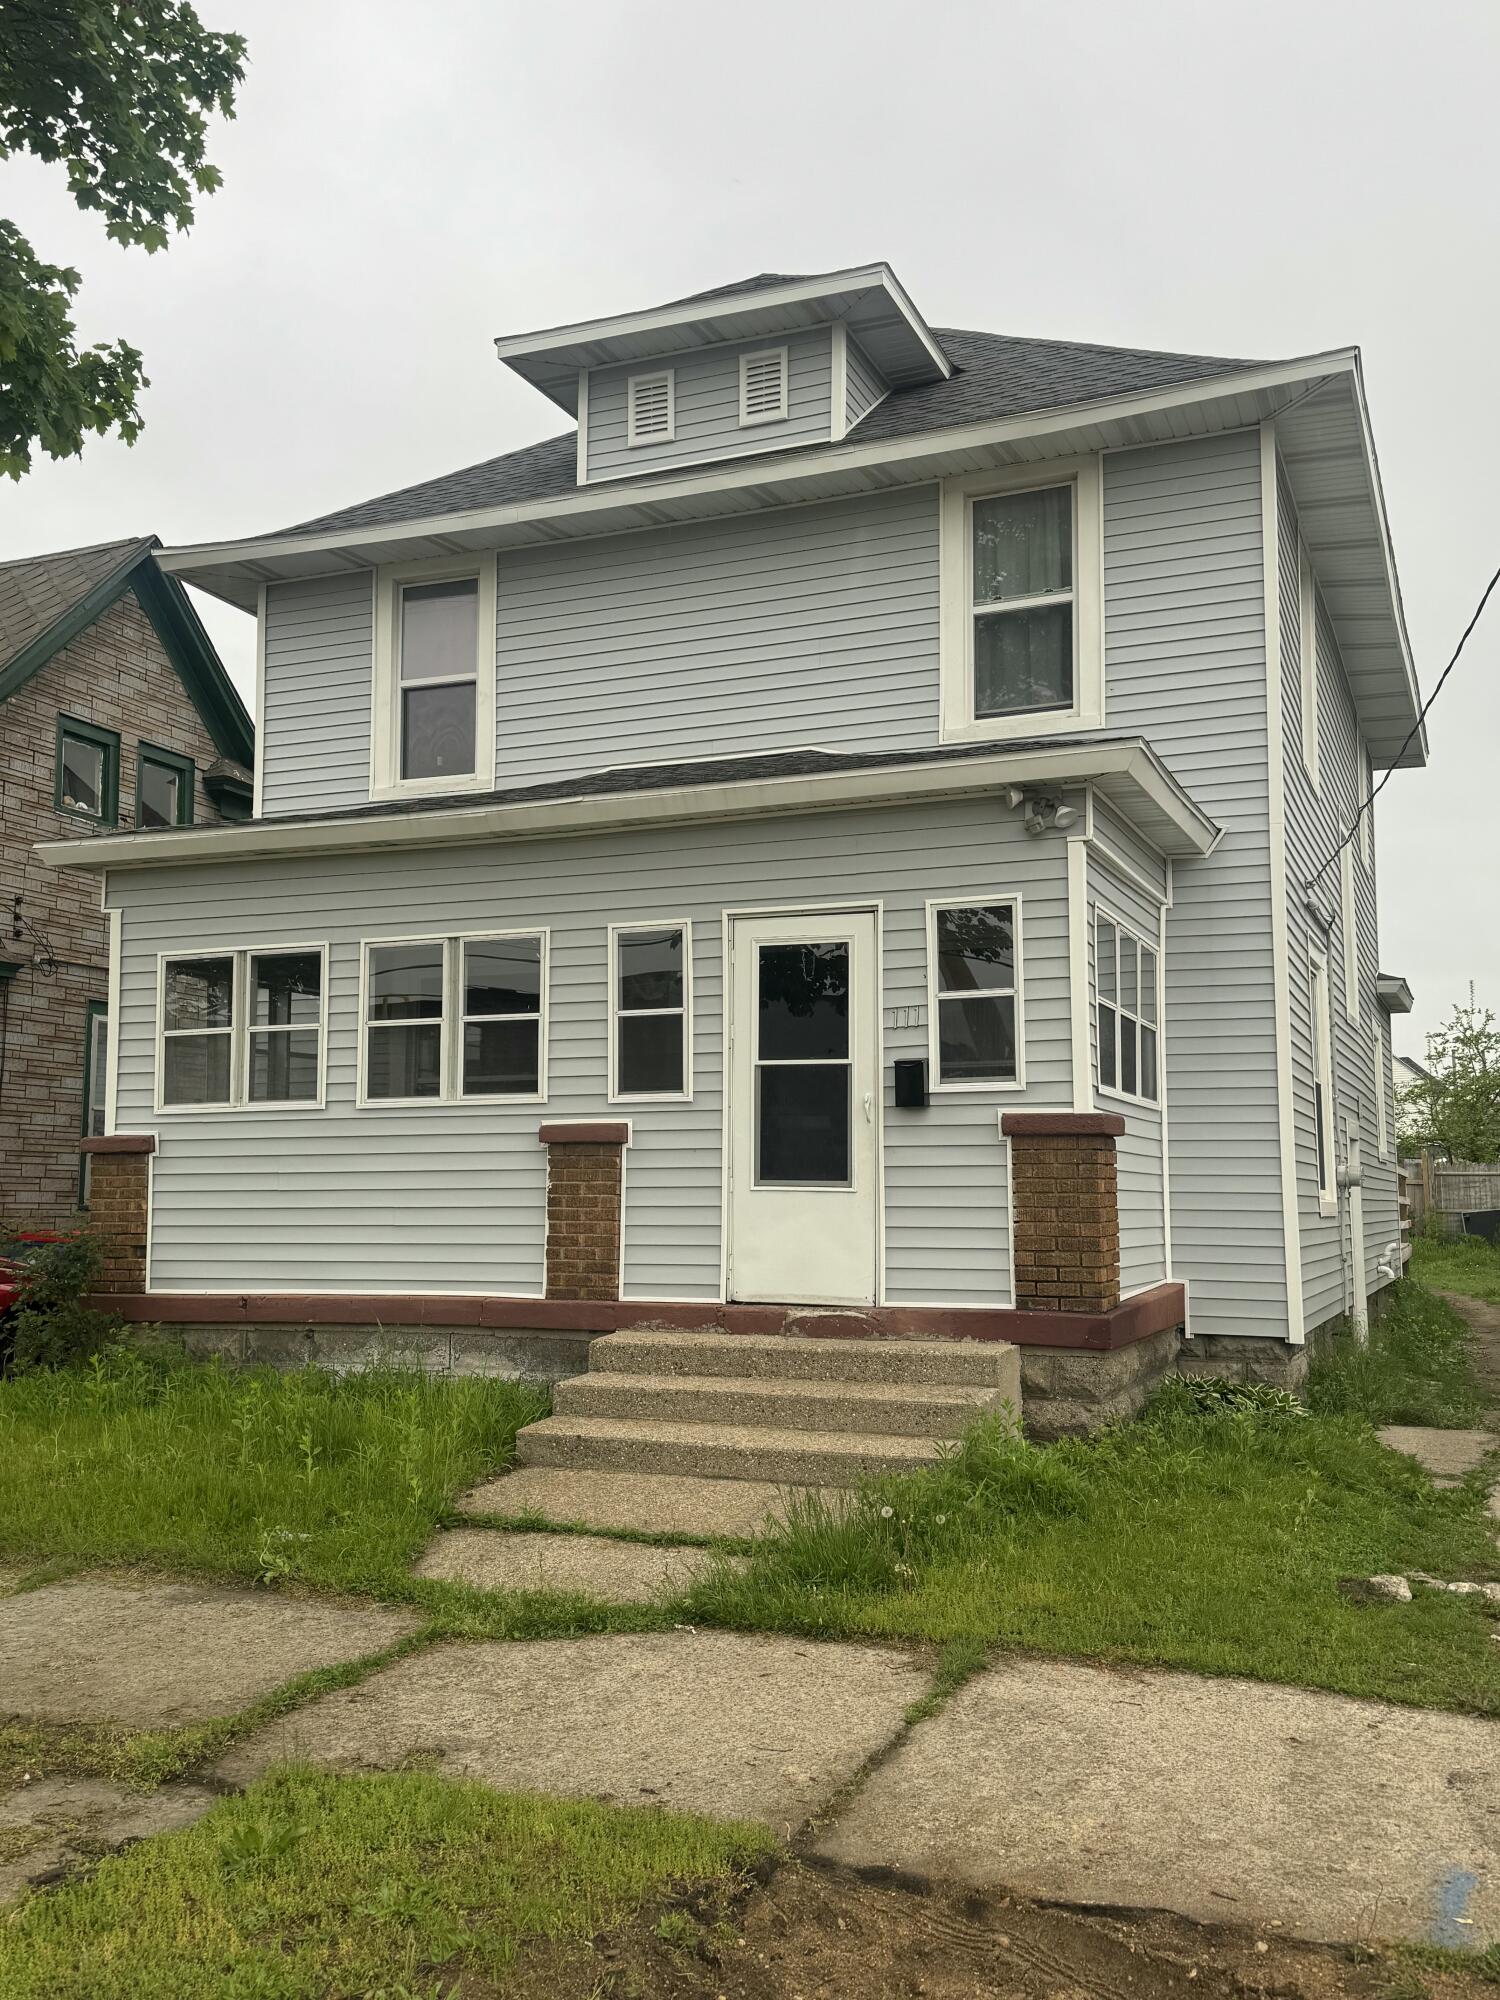
Active
$220,000
3
bds
|
2
ba
|
1,464
sqft
|
built
1910
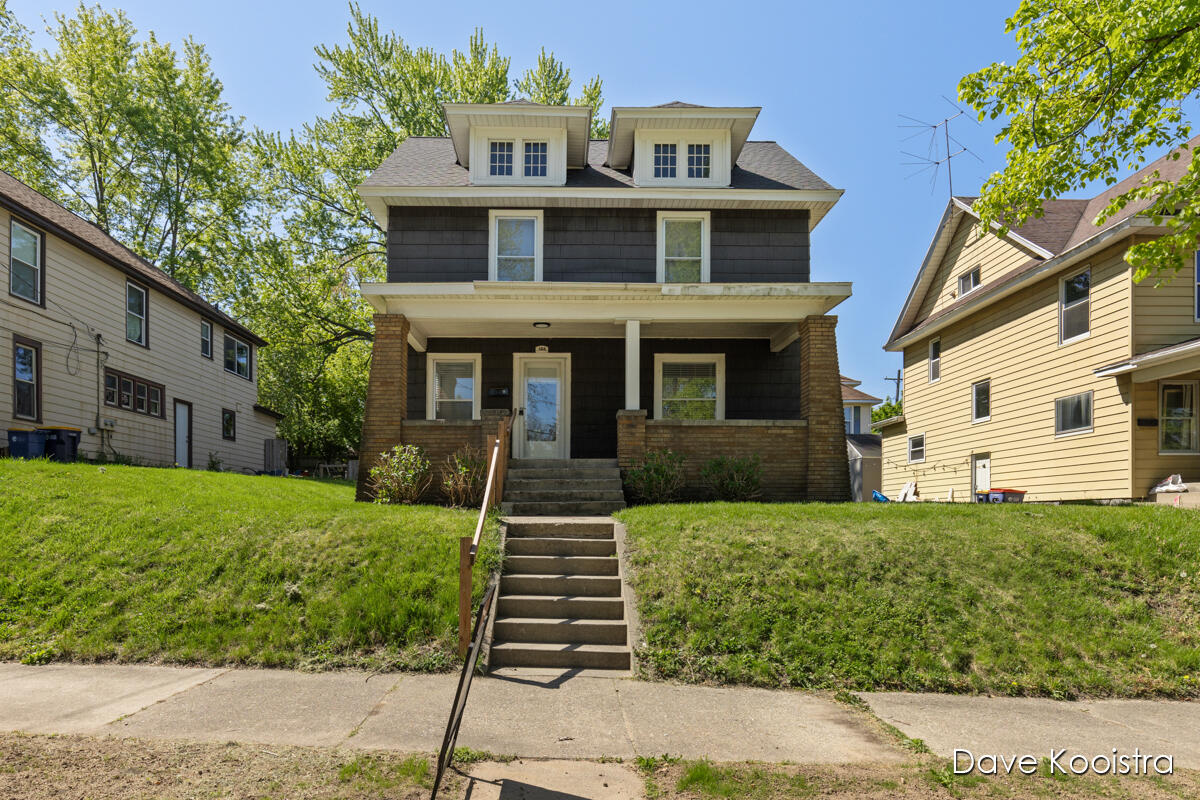
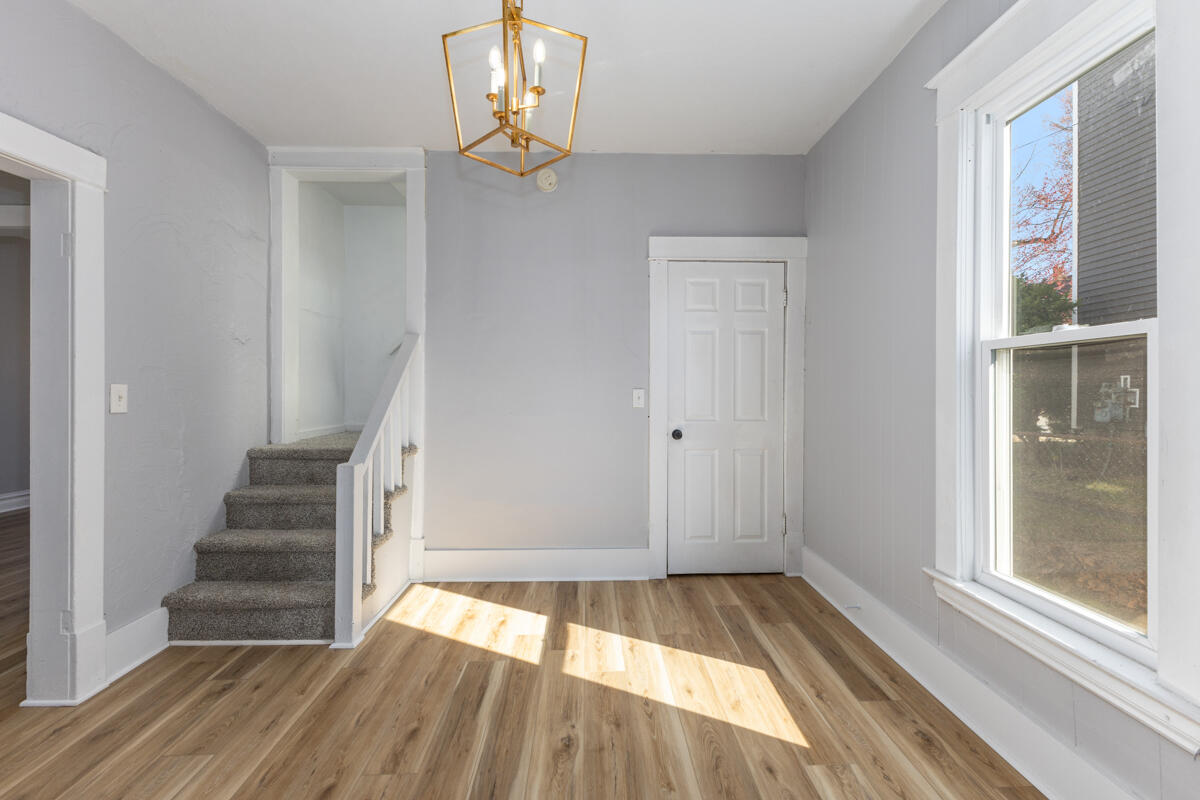
111 Fair St SE, Grand Rapids, MI 49507
$-32
Cash flow
-0.8%
Cash-on-Cash Return
6.1%
Cap rate
0.8%
Rent to Value Ratio
479 out of 649 properties for sale in Kent County
Limited Results Shown
Create a free account, or log in to reveal all property listings and enjoy the complete experience.
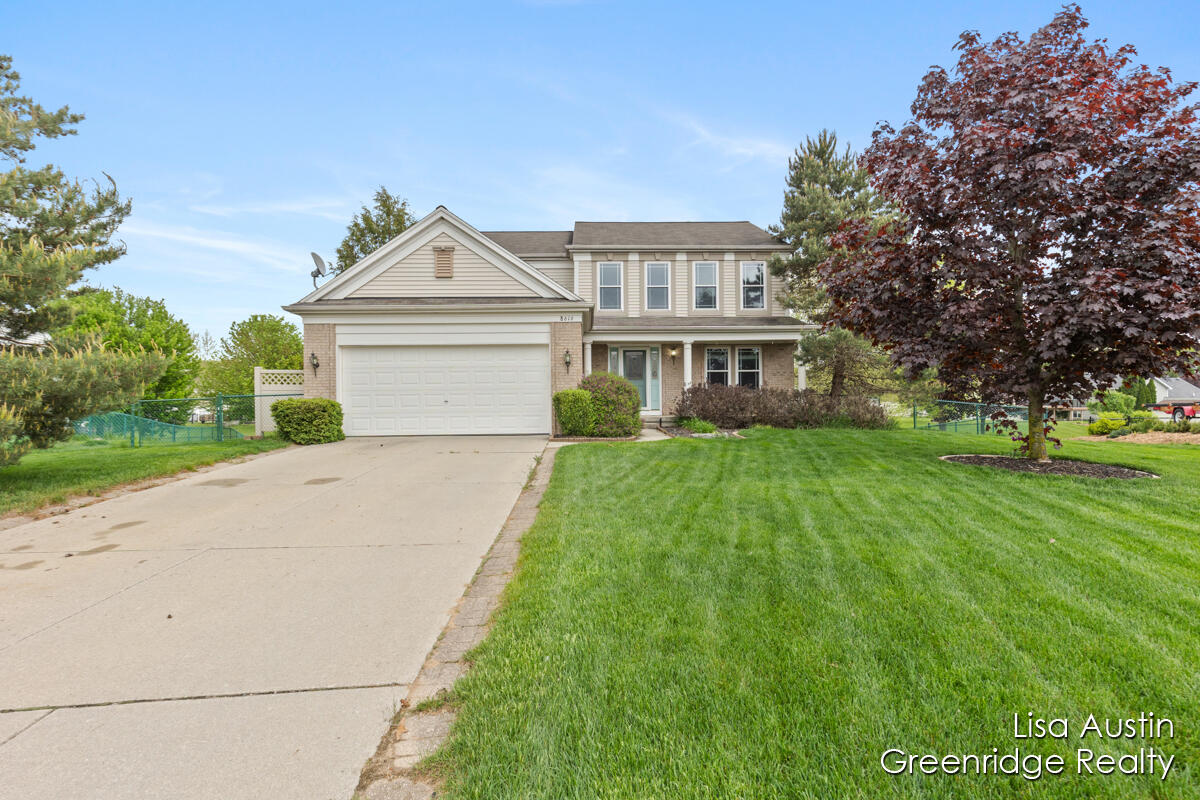
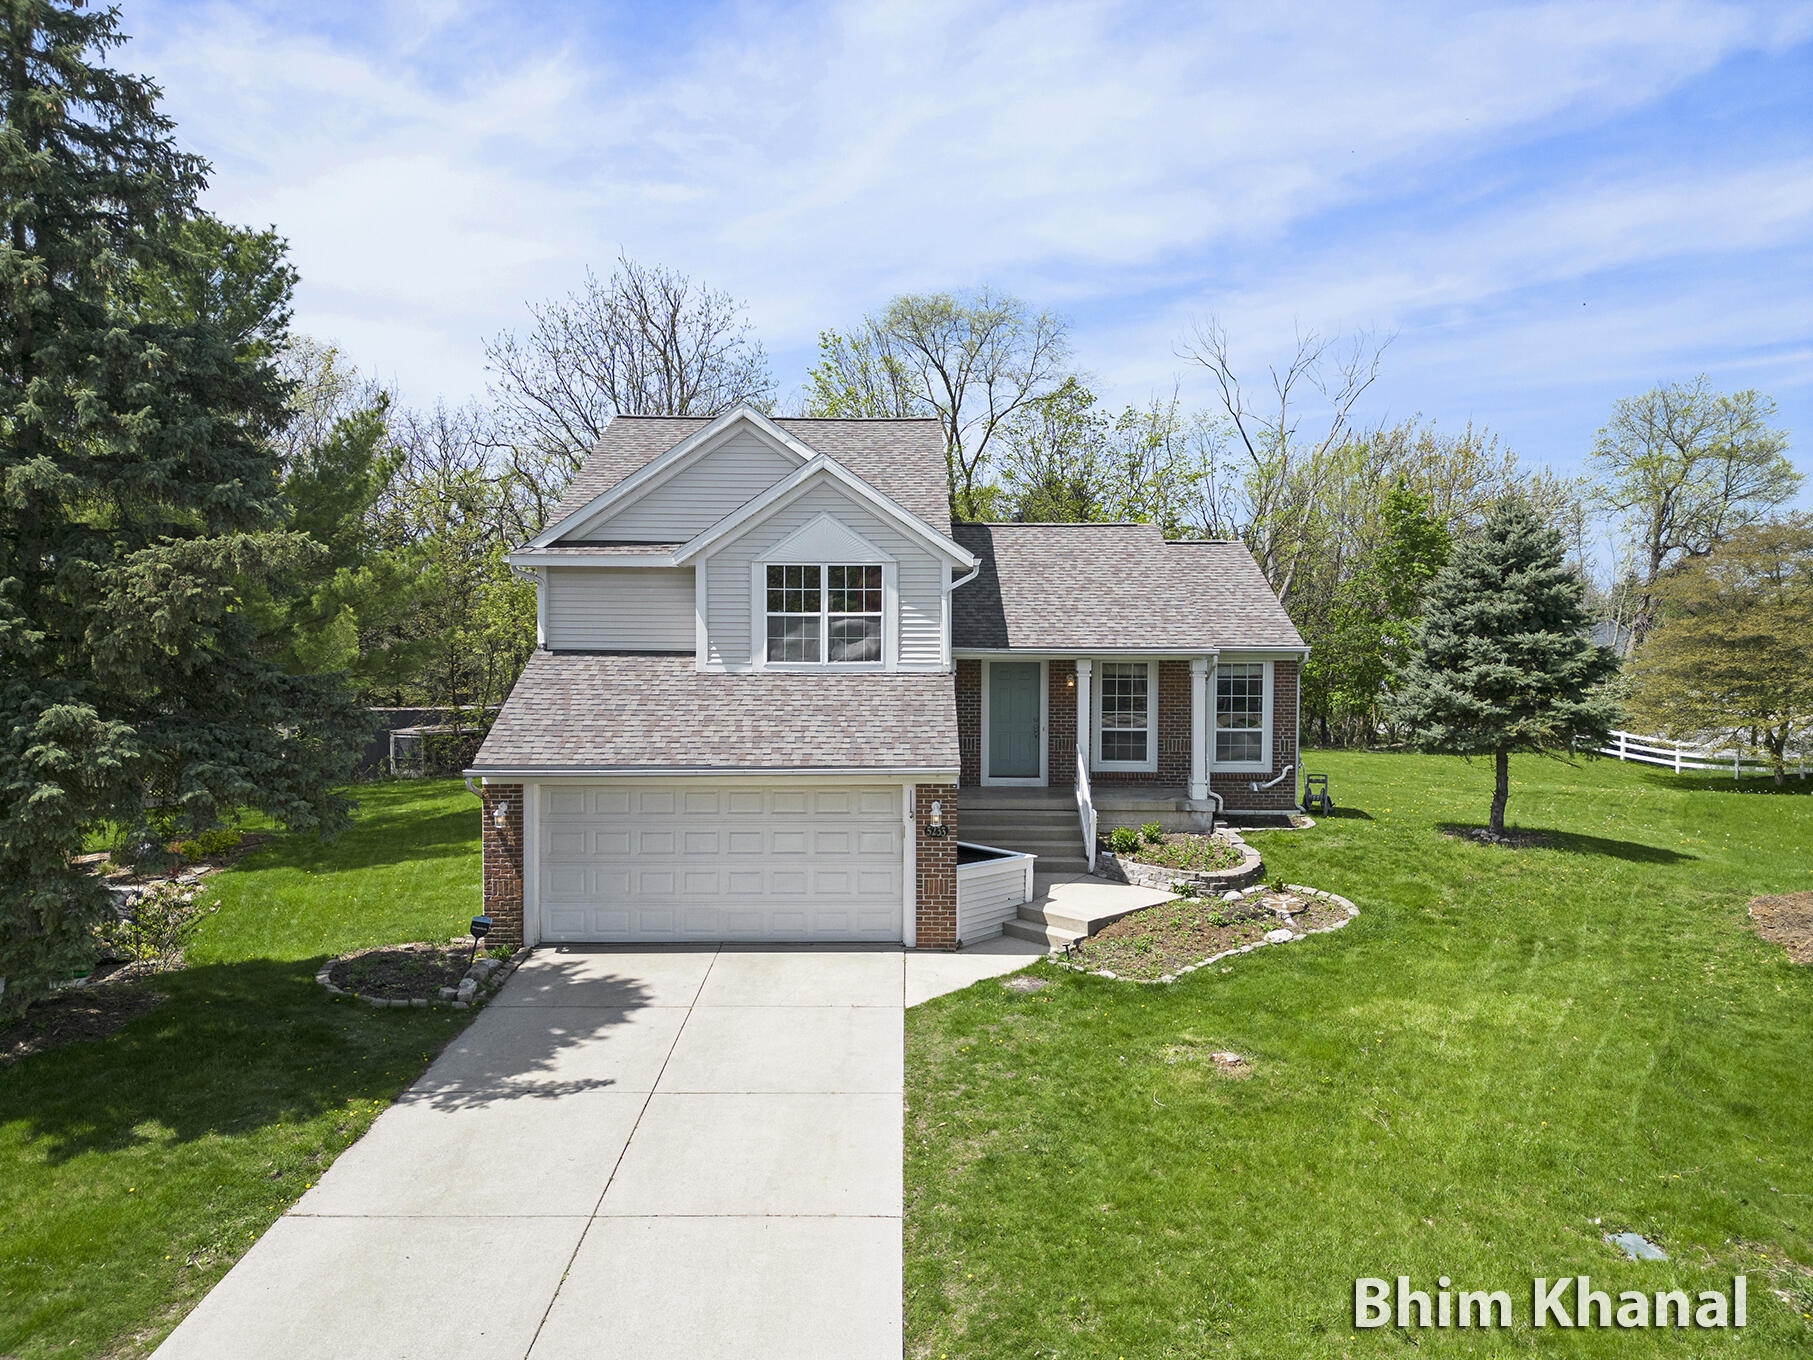
Active
$439,000
4
bds
|
4
ba
|
3,012
sqft
|
built
2004
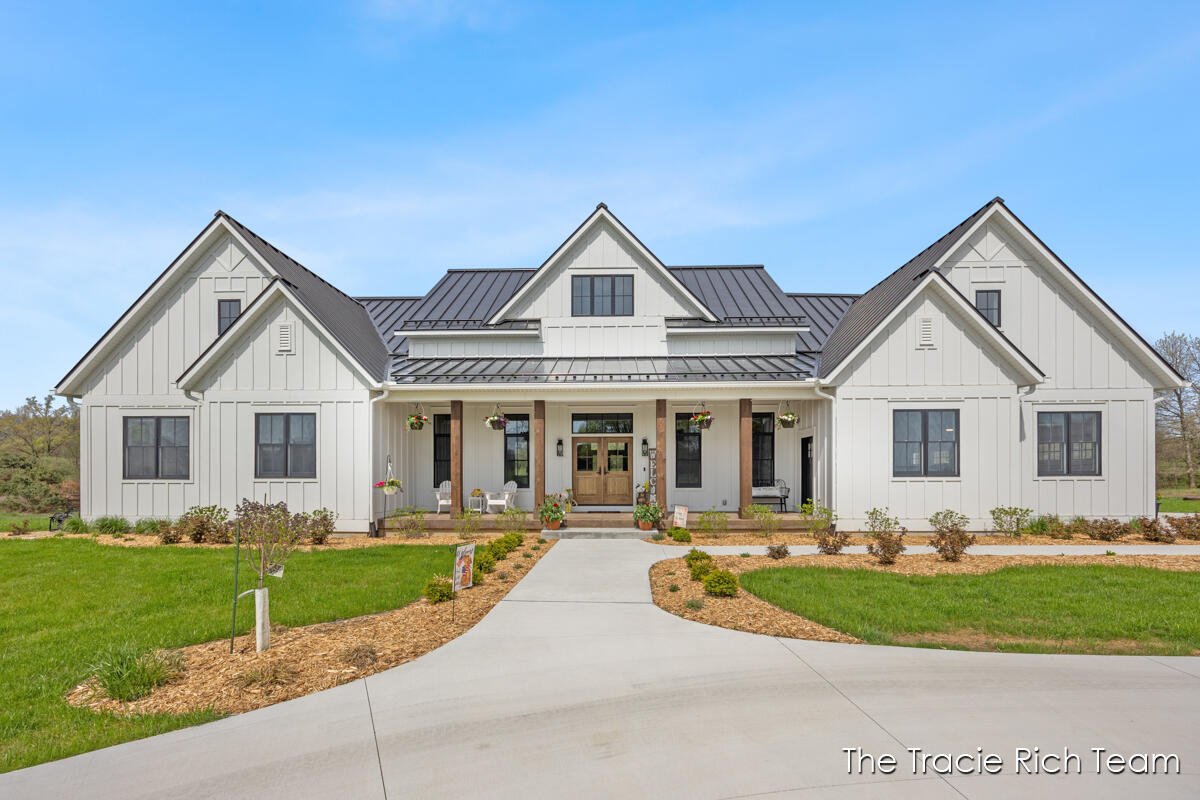
8616 Haystack Rd SE, Caledonia, MI 49316
$-709
Cash flow
-8.4%
Cash-on-Cash Return
4.3%
Cap rate
0.7%
Rent to Value Ratio

Active
$1,350,000
3
bds
|
4
ba
|
4,051
sqft
|
built
2015
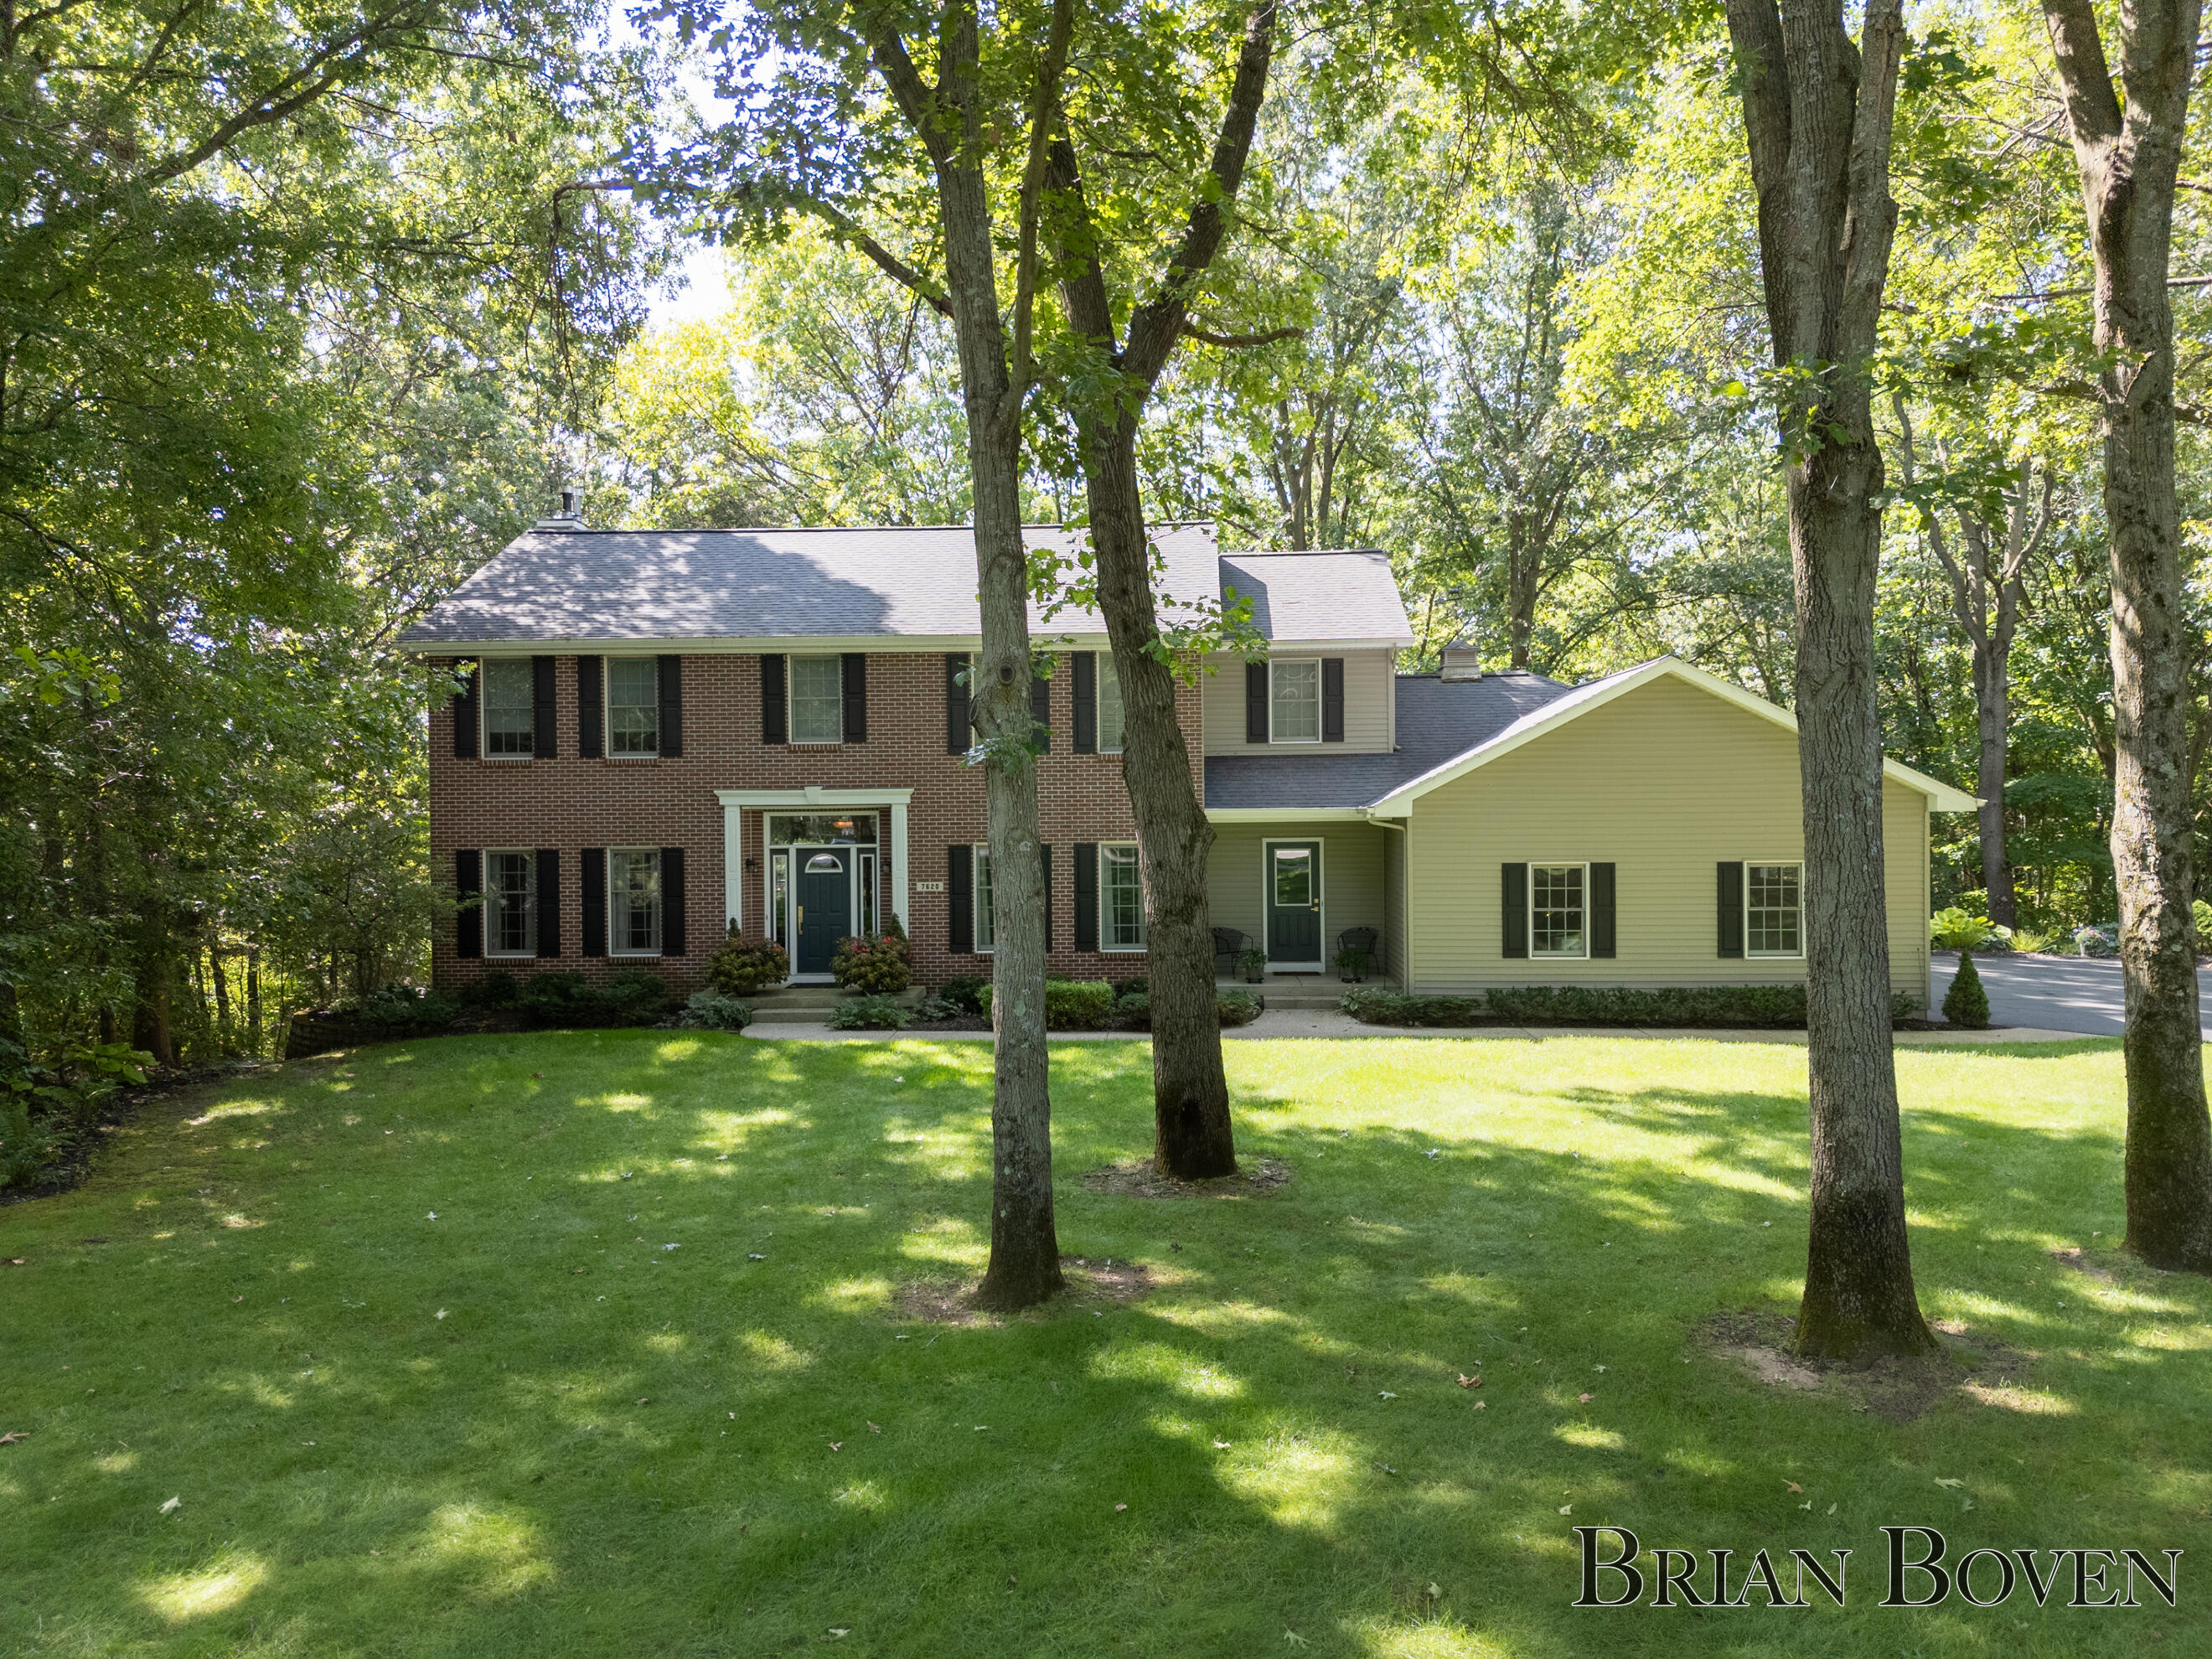
9510 Sparta Ave NW, Sparta, MI 49345
$-5,593
Cash flow
-21.6%
Cash-on-Cash Return
1.3%
Cap rate
0.2%
Rent to Value Ratio
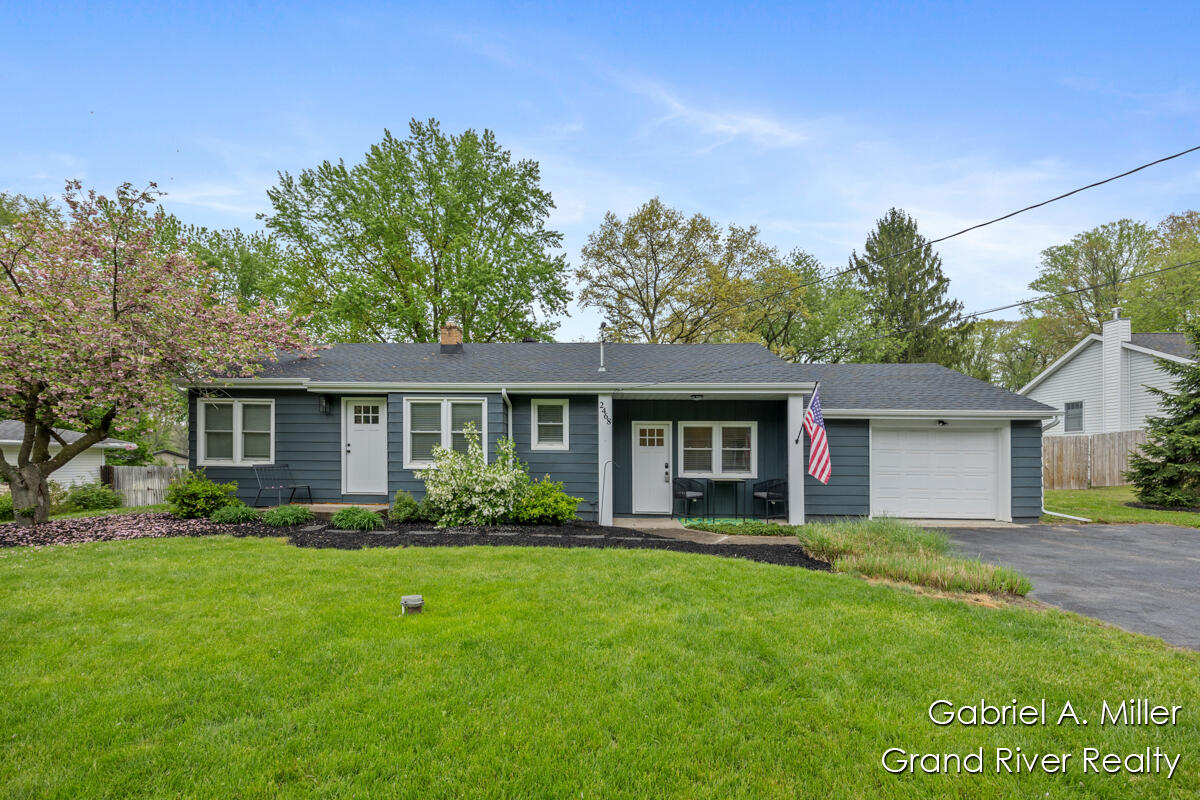
Active
$360,000
3
bds
|
2
ba
|
1,540
sqft
|
built
1954
2468 Irene St SE, Grand Rapids, MI 49546
$-333
Cash flow
-4.8%
Cash-on-Cash Return
5.2%
Cap rate
0.8%
Rent to Value Ratio

Active
$729,000
4
bds
|
4
ba
|
3,716
sqft
|
built
1991
2738 Railside Ct SW, Byron Center, MI 49315
$-1,971
Cash flow
-14.1%
Cash-on-Cash Return
3.0%
Cap rate
0.5%
Rent to Value Ratio
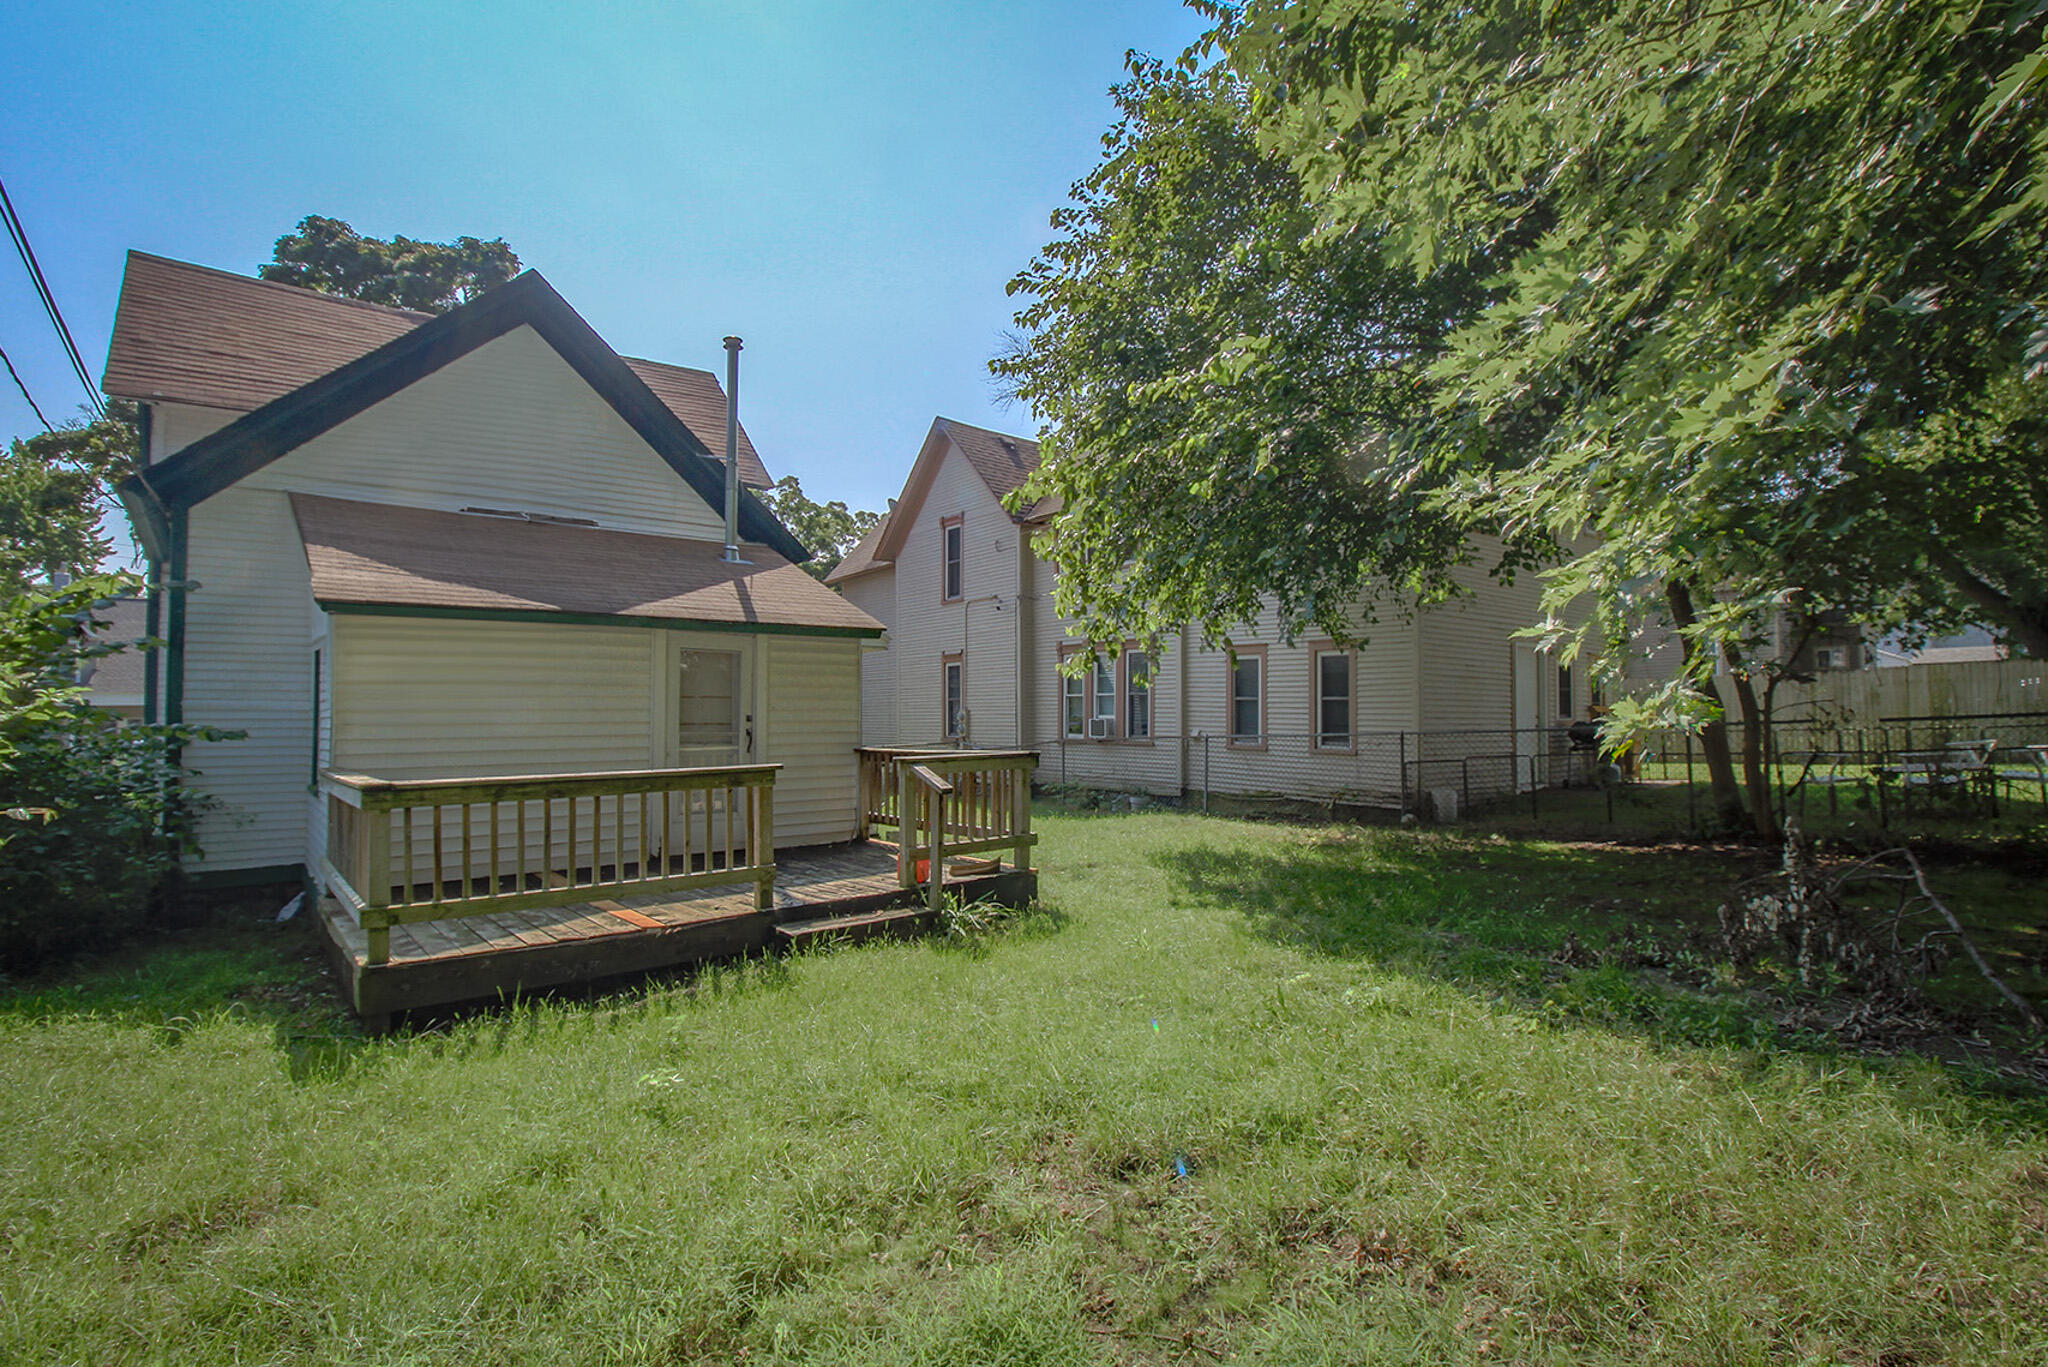
Active
$220,000
3
bds
|
2
ba
|
1,464
sqft
|
built
1910
111 Fair St SE, Grand Rapids, MI 49507
$-32
Cash flow
-0.8%
Cash-on-Cash Return
6.1%
Cap rate
0.8%
Rent to Value Ratio
Active
$289,900
4
bds
|
2
ba
|
1,656
sqft
|
built
1915
106 Colfax St NE, Grand Rapids, MI 49505
$-440
Cash flow
-7.9%
Cash-on-Cash Return
4.5%
Cap rate
0.7%
Rent to Value Ratio
Active
$325,000
2
bds
|
2
ba
|
1,165
sqft
|
built
2014
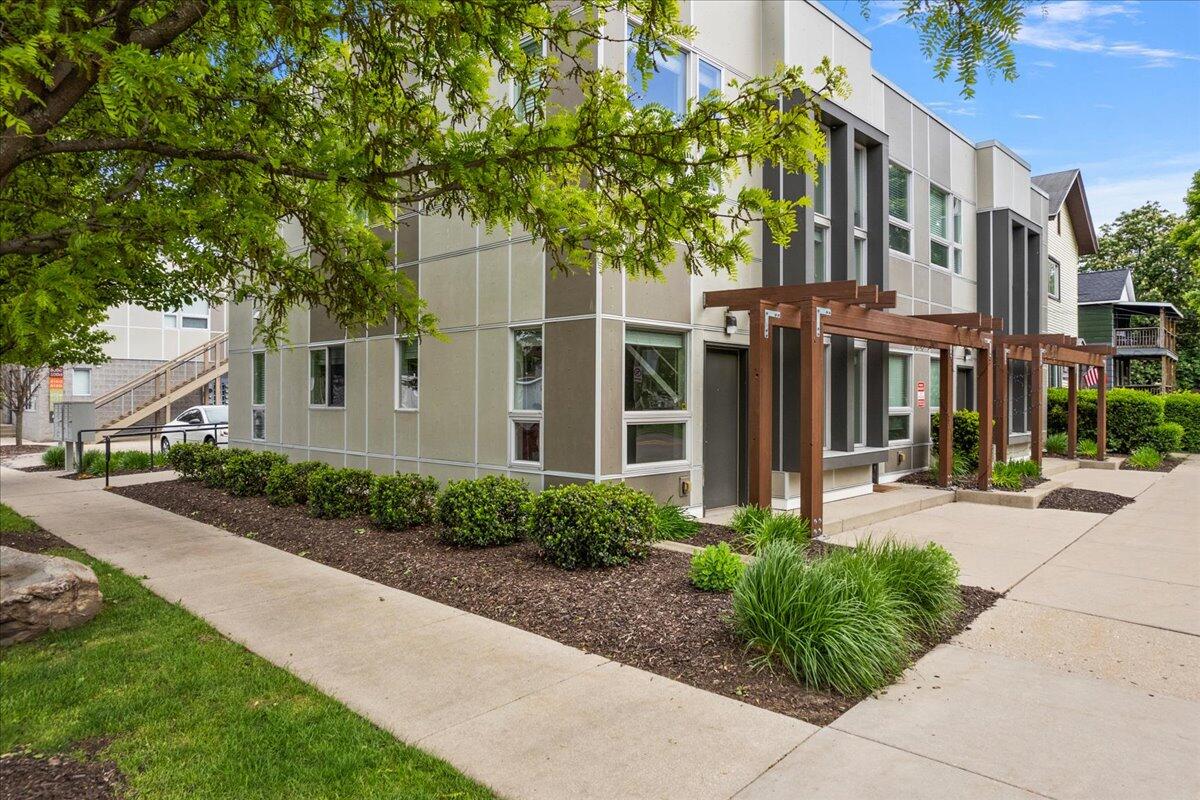
600 Douglas St NW, Grand Rapids, MI 49504
$-1,139
Cash flow
-18.3%
Cash-on-Cash Return
2.1%
Cap rate
0.8%
Rent to Value Ratio

Active
$824,900
5
bds
|
4
ba
|
3,409
sqft
|
built
2022
1791 Gloryfield Dr SW, Byron Center, MI 49315
$-2,067
Cash flow
-13.1%
Cash-on-Cash Return
3.3%
Cap rate
0.5%
Rent to Value Ratio
Active
$499,000
3
bds
|
3
ba
|
1,872
sqft
|
built
1990
2657 Leffingwell Ave NE, Grand Rapids, MI 49525
$-963
Cash flow
-10.1%
Cash-on-Cash Return
4.0%
Cap rate
0.6%
Rent to Value Ratio

Active
$619,000
3
bds
|
3
ba
|
2,206
sqft
|
built
1973
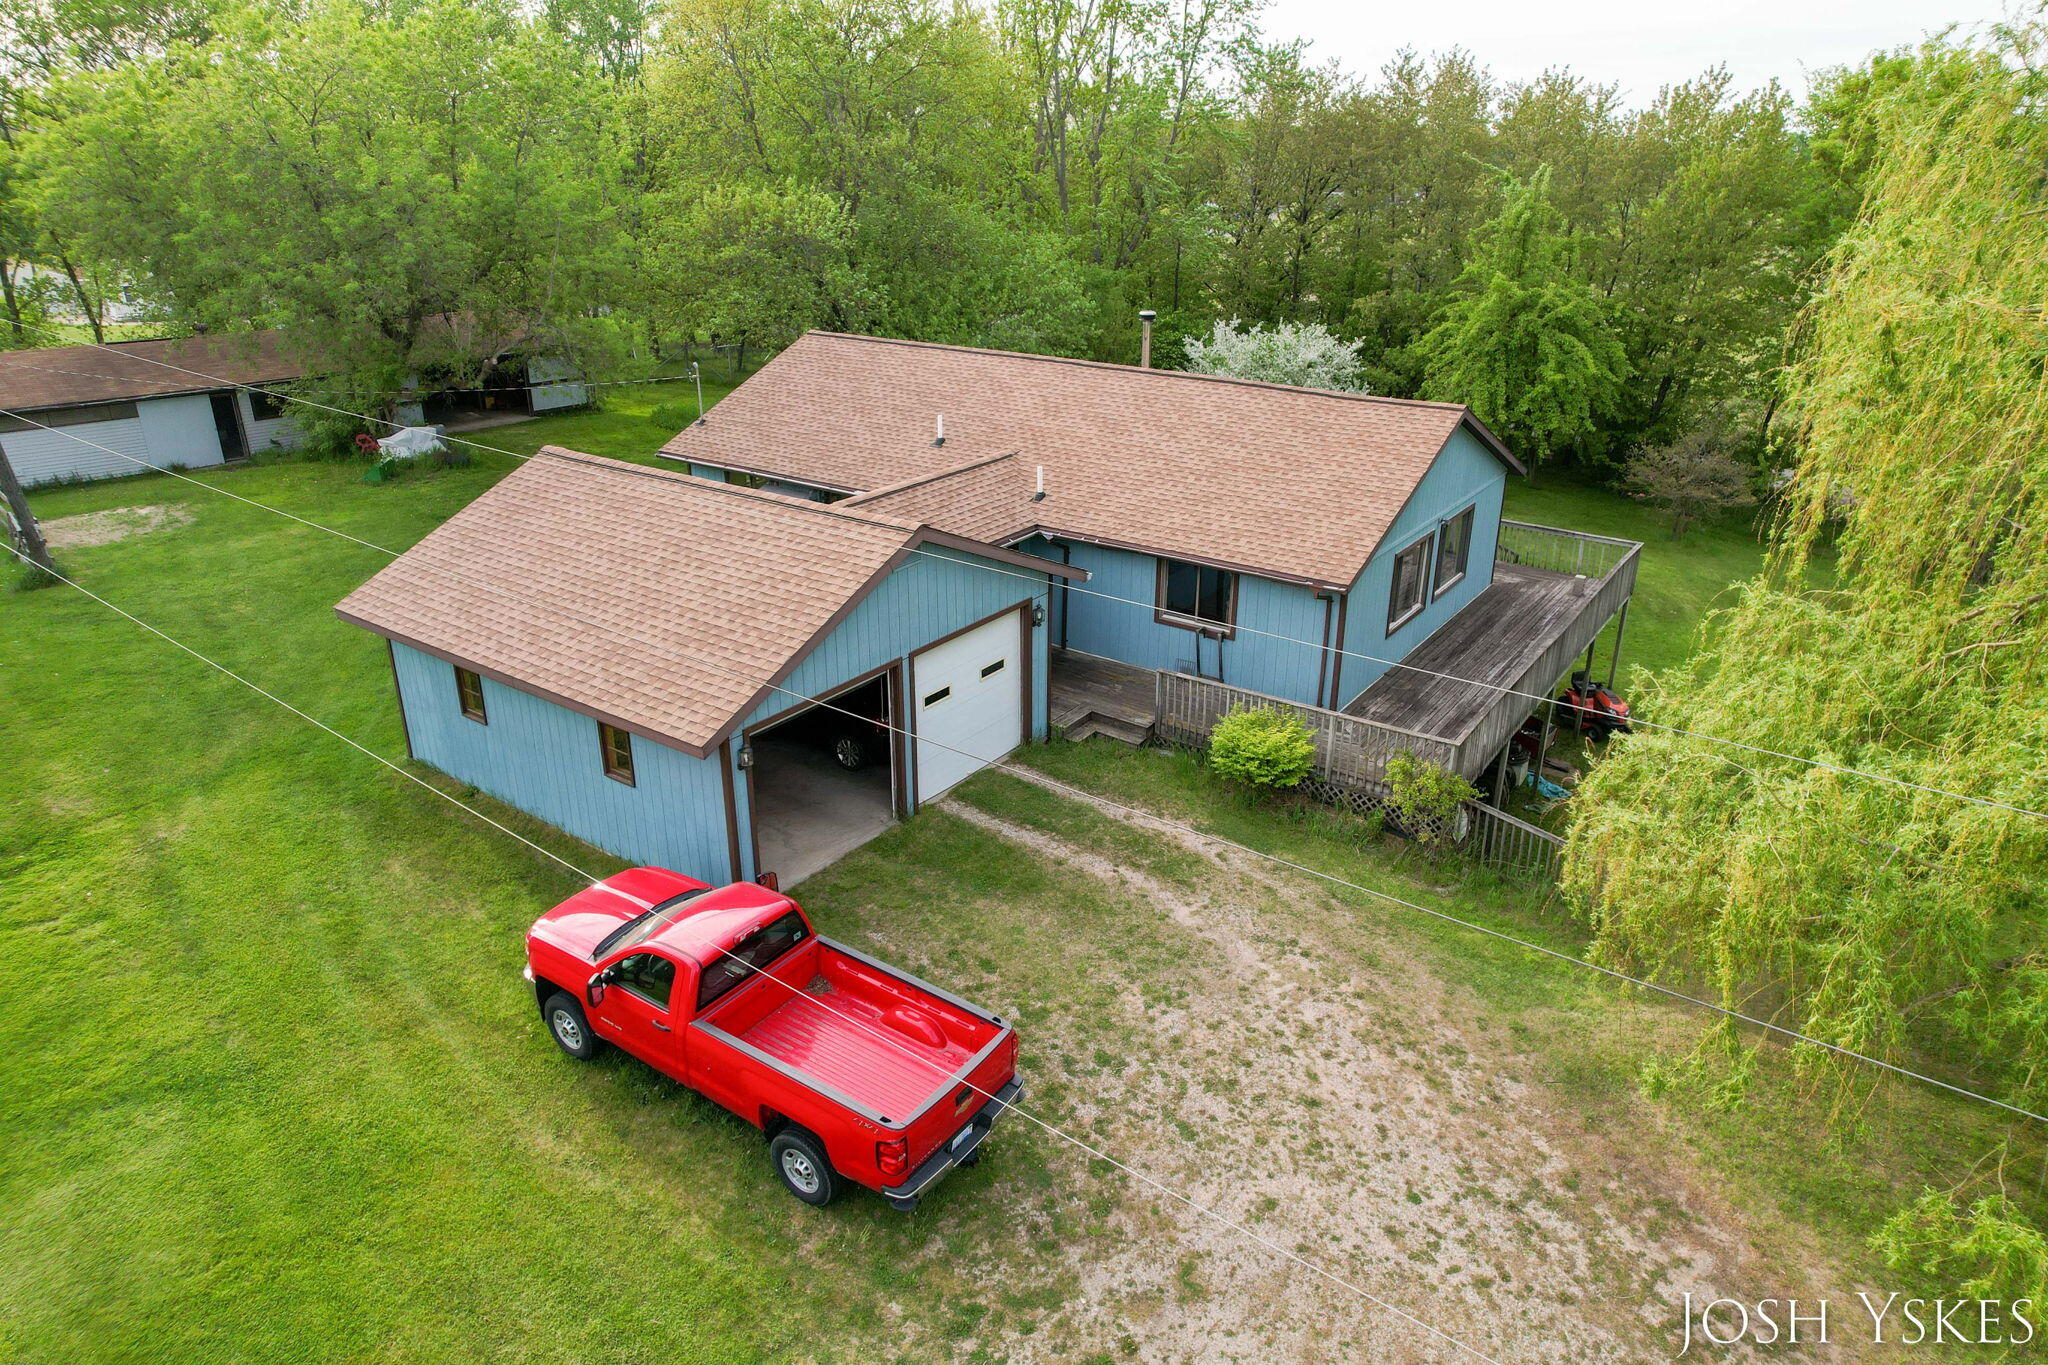
13415 Old 14 Mile Rd NE, Greenville, MI 48838
$-2,109
Cash flow
-17.8%
Cash-on-Cash Return
2.2%
Cap rate
0.4%
Rent to Value Ratio
Pending
$475,000
3
bds
|
2
ba
|
1,400
sqft
|
built
1981
160 Broman St, Sparta, MI 49345
$-1,073
Cash flow
-11.8%
Cash-on-Cash Return
3.6%
Cap rate
0.5%
Rent to Value Ratio
Pending
$359,900
3
bds
|
2
ba
|
1,805
sqft
|
built
2003
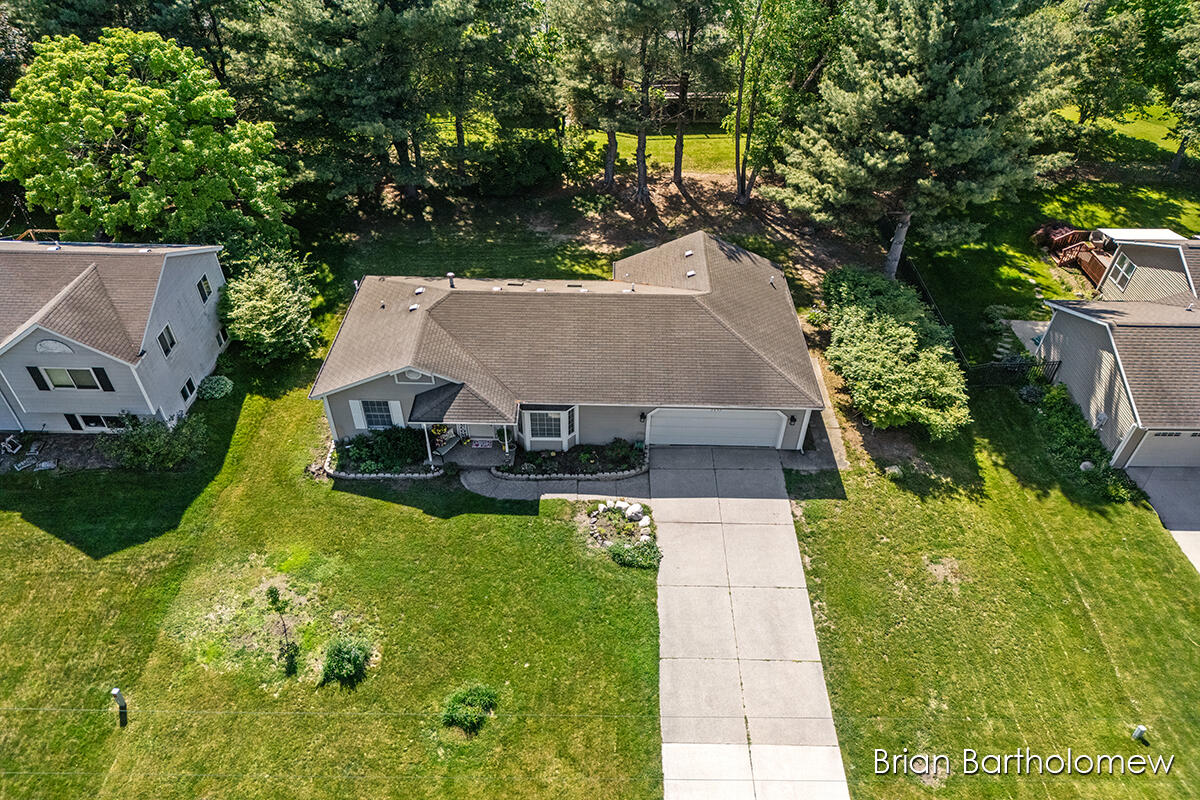
8650 Belding Rd NE, Rockford, MI 49341
$-464
Cash flow
-6.7%
Cash-on-Cash Return
4.7%
Cap rate
0.7%
Rent to Value Ratio
Active
$630,000
3
bds
|
2
ba
|
2,246
sqft
|
built
1930
3020 Fulton St E, Grand Rapids, MI 49506
$-1,642
Cash flow
-13.6%
Cash-on-Cash Return
3.2%
Cap rate
0.5%
Rent to Value Ratio
Active
$244,900
2
bds
|
2
ba
|
1,168
sqft
|
built
2006
4865 Rapid River Ave SW, Wyoming, MI 49418
$-376
Cash flow
-8.0%
Cash-on-Cash Return
4.4%
Cap rate
0.8%
Rent to Value Ratio
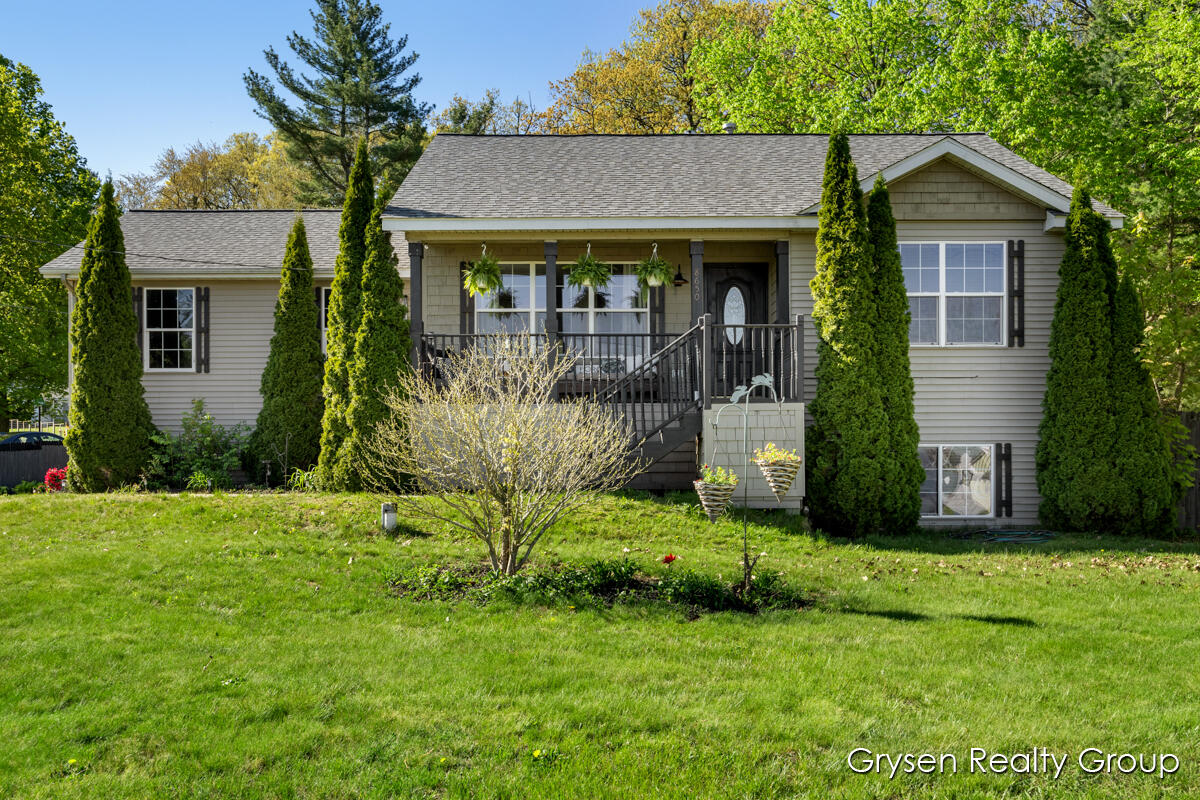
Active
$219,900
2
bds
|
1
ba
|
829
sqft
|
built
1989
3185 Windcrest Dr NE, Grand Rapids, MI 49525
$-520
Cash flow
-12.3%
Cash-on-Cash Return
3.4%
Cap rate
0.8%
Rent to Value Ratio
Pending
$405,000
4
bds
|
3
ba
|
2,050
sqft
|
built
1996
5233 N Elderberry Ct SE, Kentwood, MI 49512
$-763
Cash flow
-9.8%
Cash-on-Cash Return
4.0%
Cap rate
0.7%
Rent to Value Ratio

Active
$520,000
3
bds
|
3
ba
|
1,926
sqft
|
built
2022
179 Tamarack Ln, Rockford, MI 49341
$-1,301
Cash flow
-13.1%
Cash-on-Cash Return
3.3%
Cap rate
0.6%
Rent to Value Ratio
Active
$265,000
4
bds
|
1
ba
|
1,199
sqft
|
built
1890
637 Prospect Ave NE, Grand Rapids, MI 49503
$-543
Cash flow
-10.7%
Cash-on-Cash Return
3.8%
Cap rate
0.7%
Rent to Value Ratio

Active
$1,395,000
7
bds
|
5
ba
|
4,770
sqft
|
built
1997
7707 Forest Ct NE, Rockford, MI 49341
$-5,073
Cash flow
-19.0%
Cash-on-Cash Return
1.9%
Cap rate
0.3%
Rent to Value Ratio
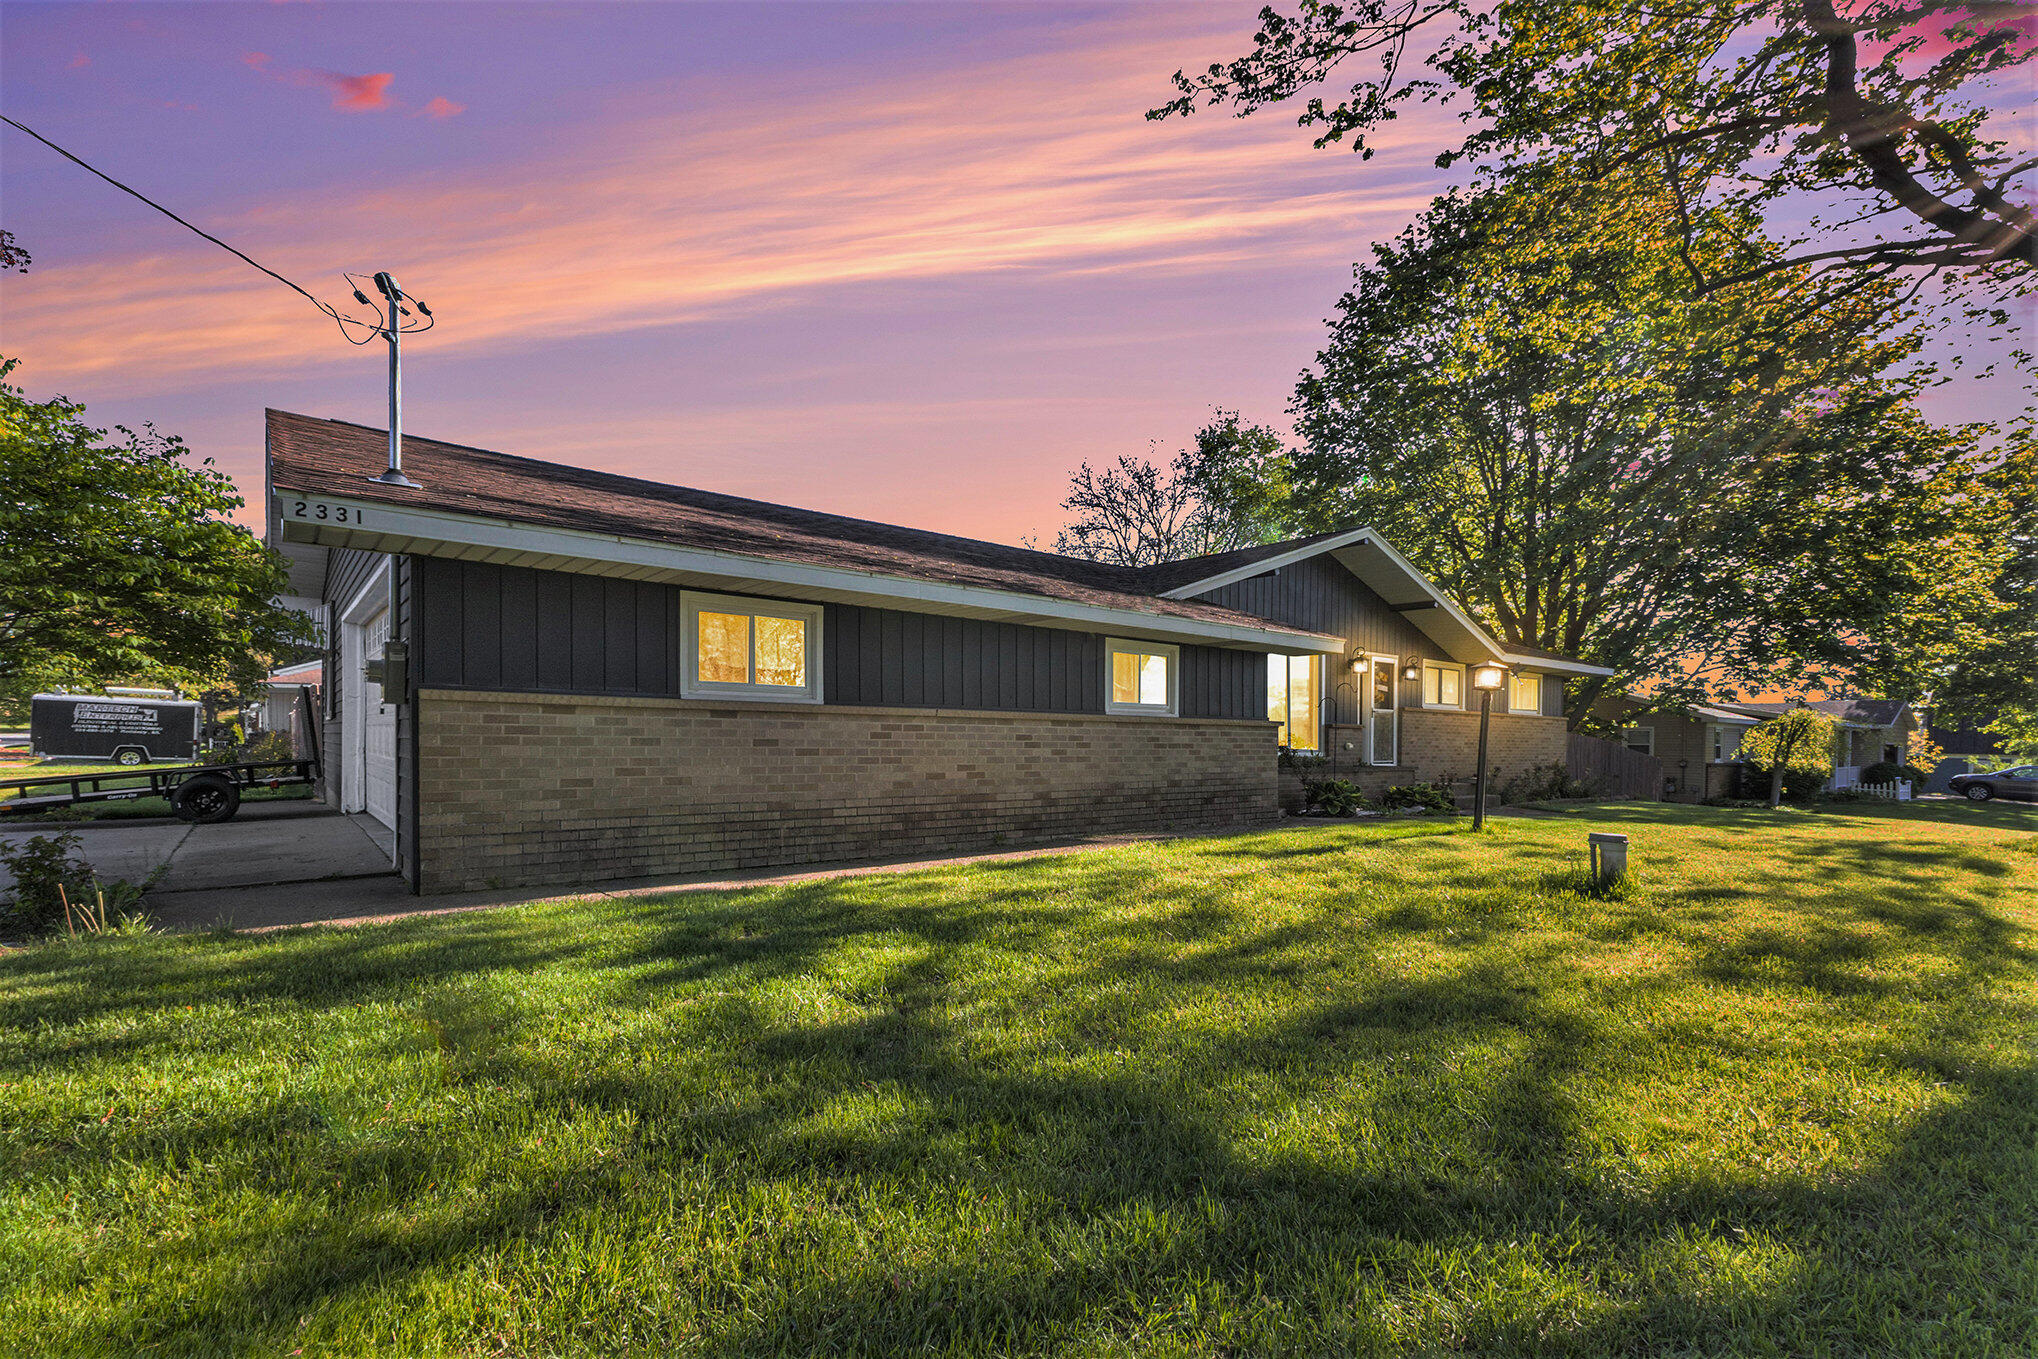
Active
$412,000
4
bds
|
3
ba
|
1,846
sqft
|
built
1965
2331 92nd St SW, Byron Center, MI 49315
$-727
Cash flow
-9.2%
Cash-on-Cash Return
4.2%
Cap rate
0.6%
Rent to Value Ratio
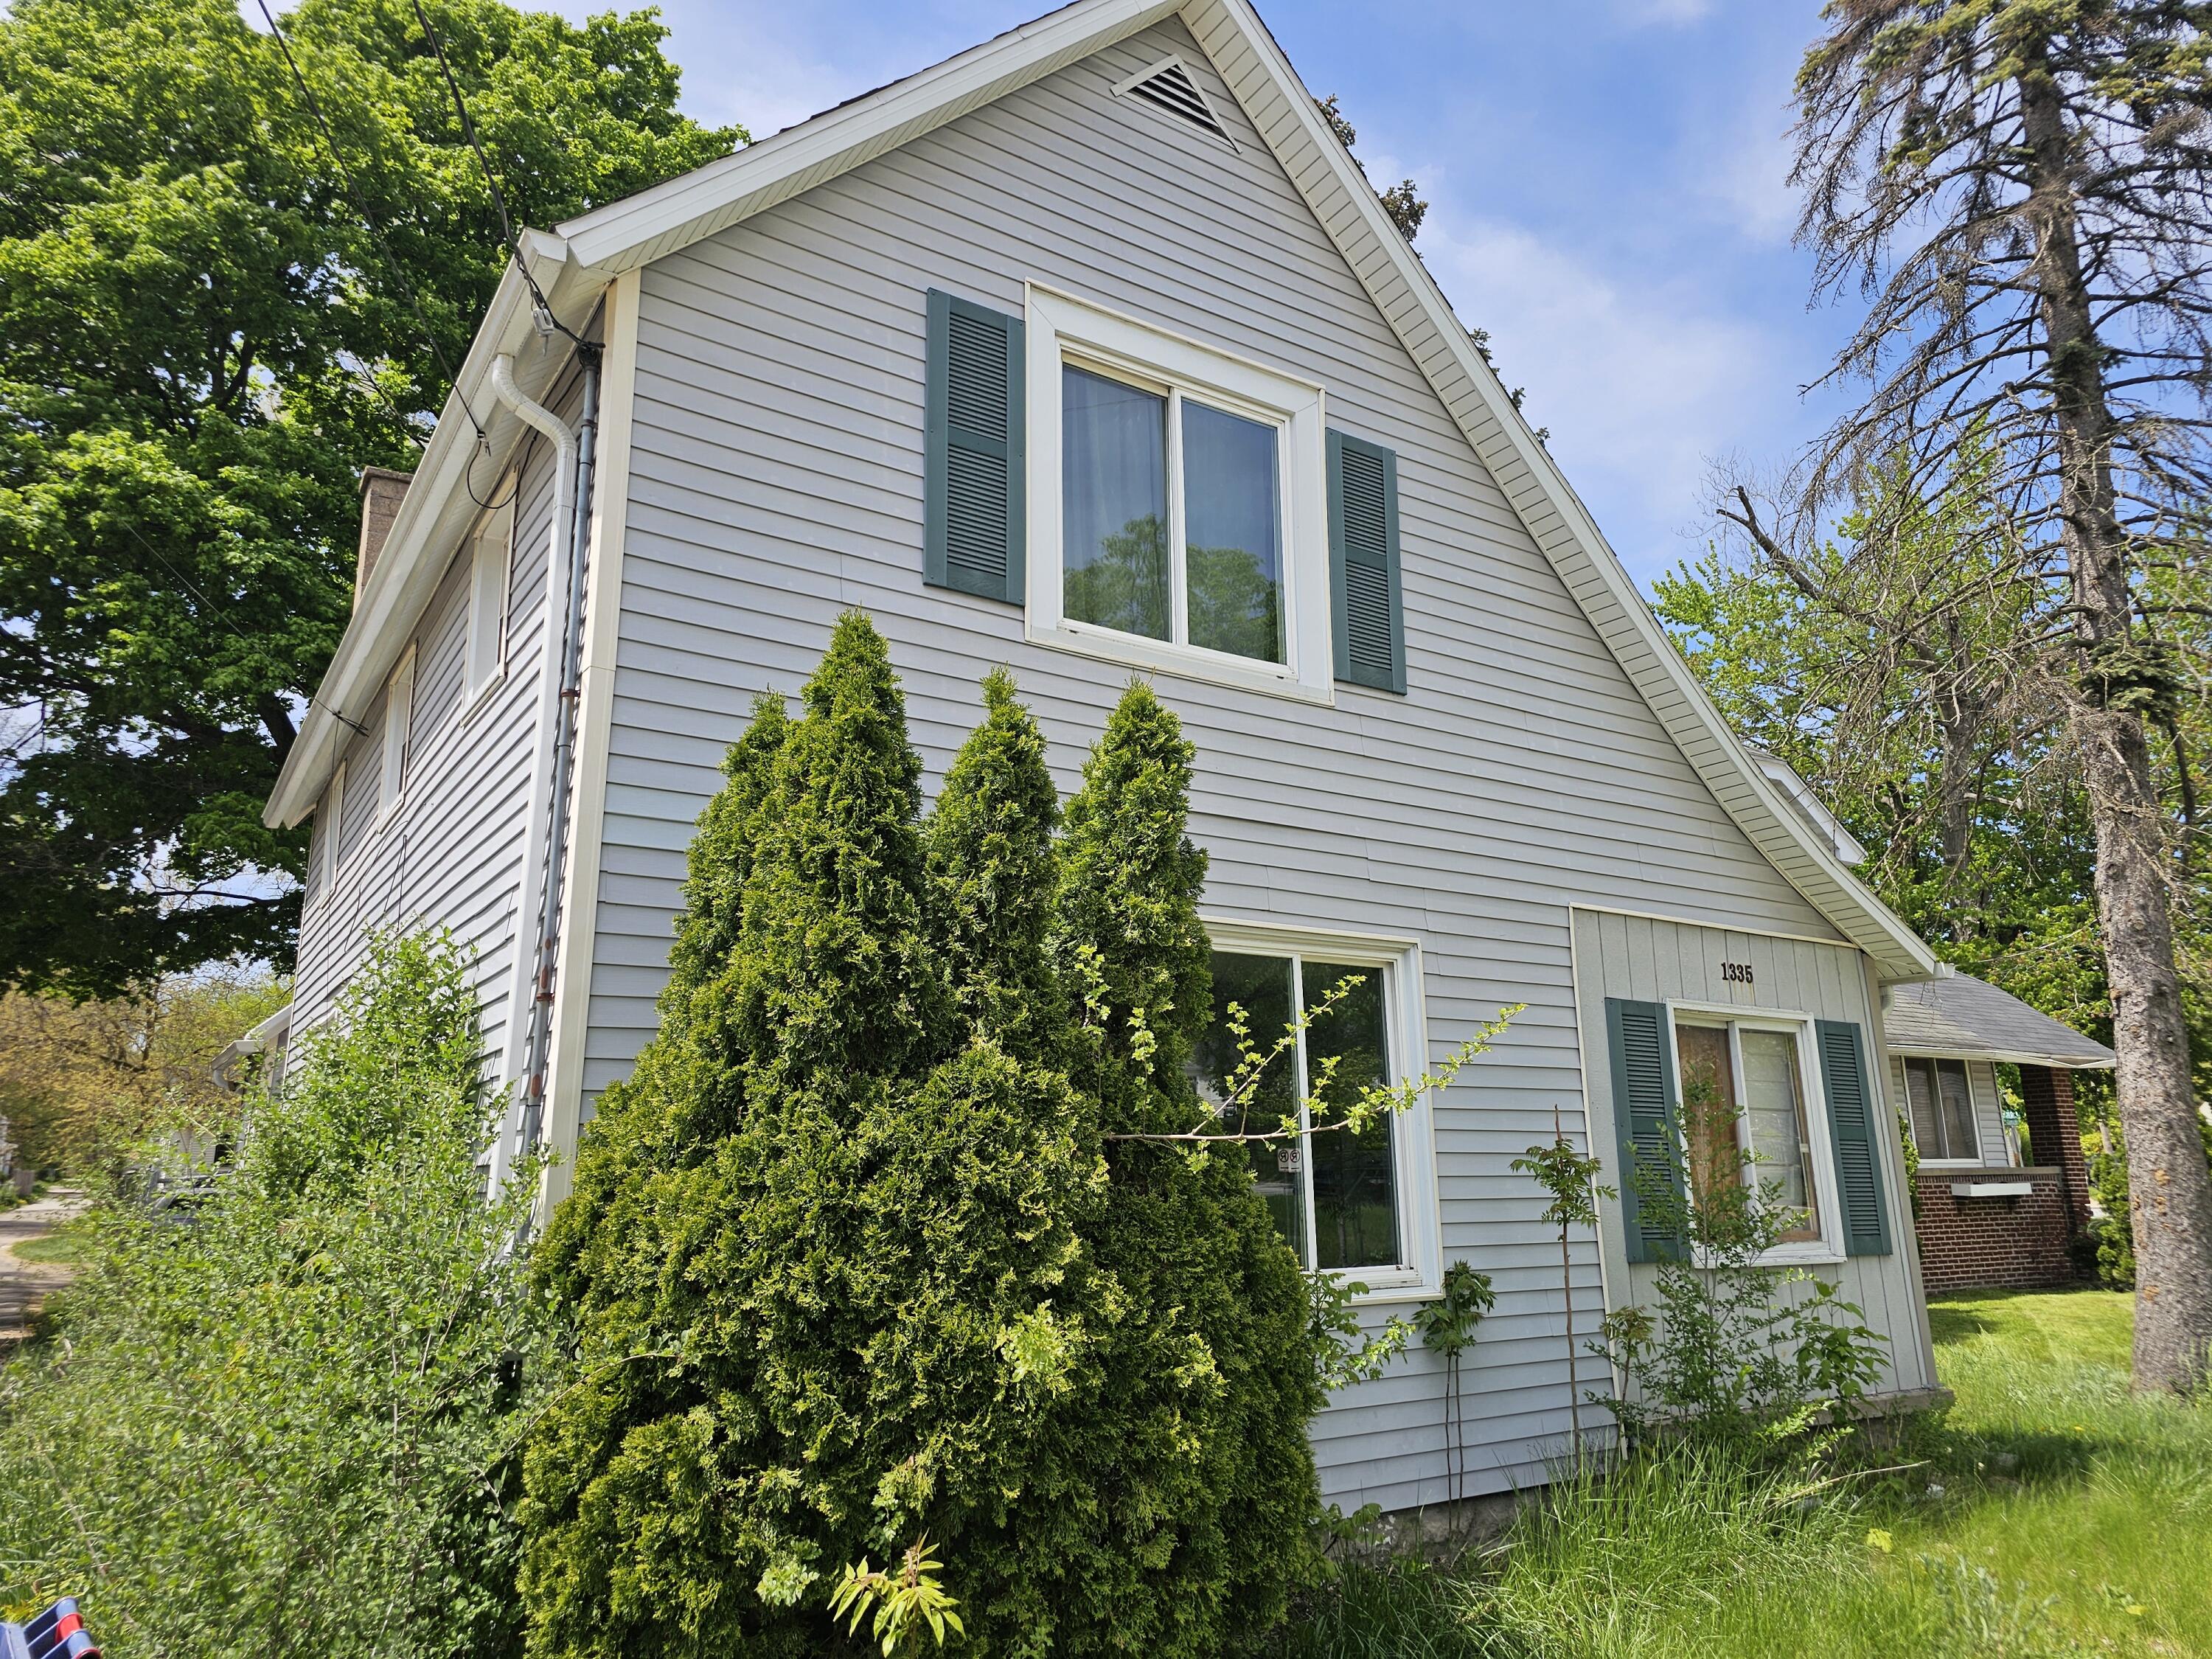
Active
$239,999
3
bds
|
2
ba
|
1,300
sqft
|
built
1924
1335 Kalamazoo Ave SE, Grand Rapids, MI 49507
$-651
Cash flow
-14.2%
Cash-on-Cash Return
3.0%
Cap rate
0.6%
Rent to Value Ratio
Pending
$319,900
3
bds
|
2
ba
|
1,560
sqft
|
built
1984
2721 Rum Creek Dr SE, Kentwood, MI 49508
$-569
Cash flow
-9.3%
Cash-on-Cash Return
4.1%
Cap rate
0.6%
Rent to Value Ratio
Active
$192,000
4
bds
|
1
ba
|
1,285
sqft
|
built
1921
922 Prince St SE, Grand Rapids, MI 49507
$-4,959
Cash flow
-134.8%
Cash-on-Cash Return
-24.7%
Cap rate
0.8%
Rent to Value Ratio

Active
$209,900
2
bds
|
2
ba
|
1,306
sqft
|
built
1981
5803 Leisure South Dr SE, Grand Rapids, MI 49548
$-626
Cash flow
-15.6%
Cash-on-Cash Return
2.7%
Cap rate
0.7%
Rent to Value Ratio

Pending
$629,900
4
bds
|
4
ba
|
3,320
sqft
|
built
1991
7860 Myers Lake Ave NE, Rockford, MI 49341
$-1,349
Cash flow
-11.2%
Cash-on-Cash Return
3.7%
Cap rate
0.6%
Rent to Value Ratio
Active
$3,100,000
5
bds
|
5
ba
|
6,521
sqft
|
built
2023
7442 Tiffany Ave NE, Rockford, MI 49341
$-16,314
Cash flow
-27.5%
Cash-on-Cash Return
0.0%
Cap rate
0.1%
Rent to Value Ratio
Active
$795,000
4
bds
|
4
ba
|
3,628
sqft
|
built
1997
7620 Spring Point Ct NE, Rockford, MI 49341
$-2,059
Cash flow
-13.5%
Cash-on-Cash Return
3.2%
Cap rate
0.5%
Rent to Value Ratio

Active
$569,000
4
bds
|
3
ba
|
2,816
sqft
|
built
1978
3290 Hidden Hills Ct SE, Grand Rapids, MI 49546
$-1,166
Cash flow
-10.7%
Cash-on-Cash Return
3.8%
Cap rate
0.6%
Rent to Value Ratio
Active
$399,900
5
bds
|
4
ba
|
3,413
sqft
|
built
2021
560 Pioneer Trl, Cedar Springs, MI 49319
$-908
Cash flow
-11.8%
Cash-on-Cash Return
3.6%
Cap rate
0.7%
Rent to Value Ratio
Active
$609,999
2
bds
|
2
ba
|
1,443
sqft
|
built
2010
335 Bridge St NW, Grand Rapids, MI 49504
$-1,876
Cash flow
-16.0%
Cash-on-Cash Return
2.6%
Cap rate
0.7%
Rent to Value Ratio
Active
$549,900
4
bds
|
3
ba
|
2,573
sqft
|
built
1952
1246 Forest Hollow Ct SE, Grand Rapids, MI 49546
$-1,305
Cash flow
-12.4%
Cash-on-Cash Return
3.4%
Cap rate
0.5%
Rent to Value Ratio
Active
$449,900
3
bds
|
2
ba
|
2,666
sqft
|
built
1917
12524 Hoskins Ave, Cedar Springs, MI 49319
$-948
Cash flow
-11.0%
Cash-on-Cash Return
3.8%
Cap rate
0.6%
Rent to Value Ratio
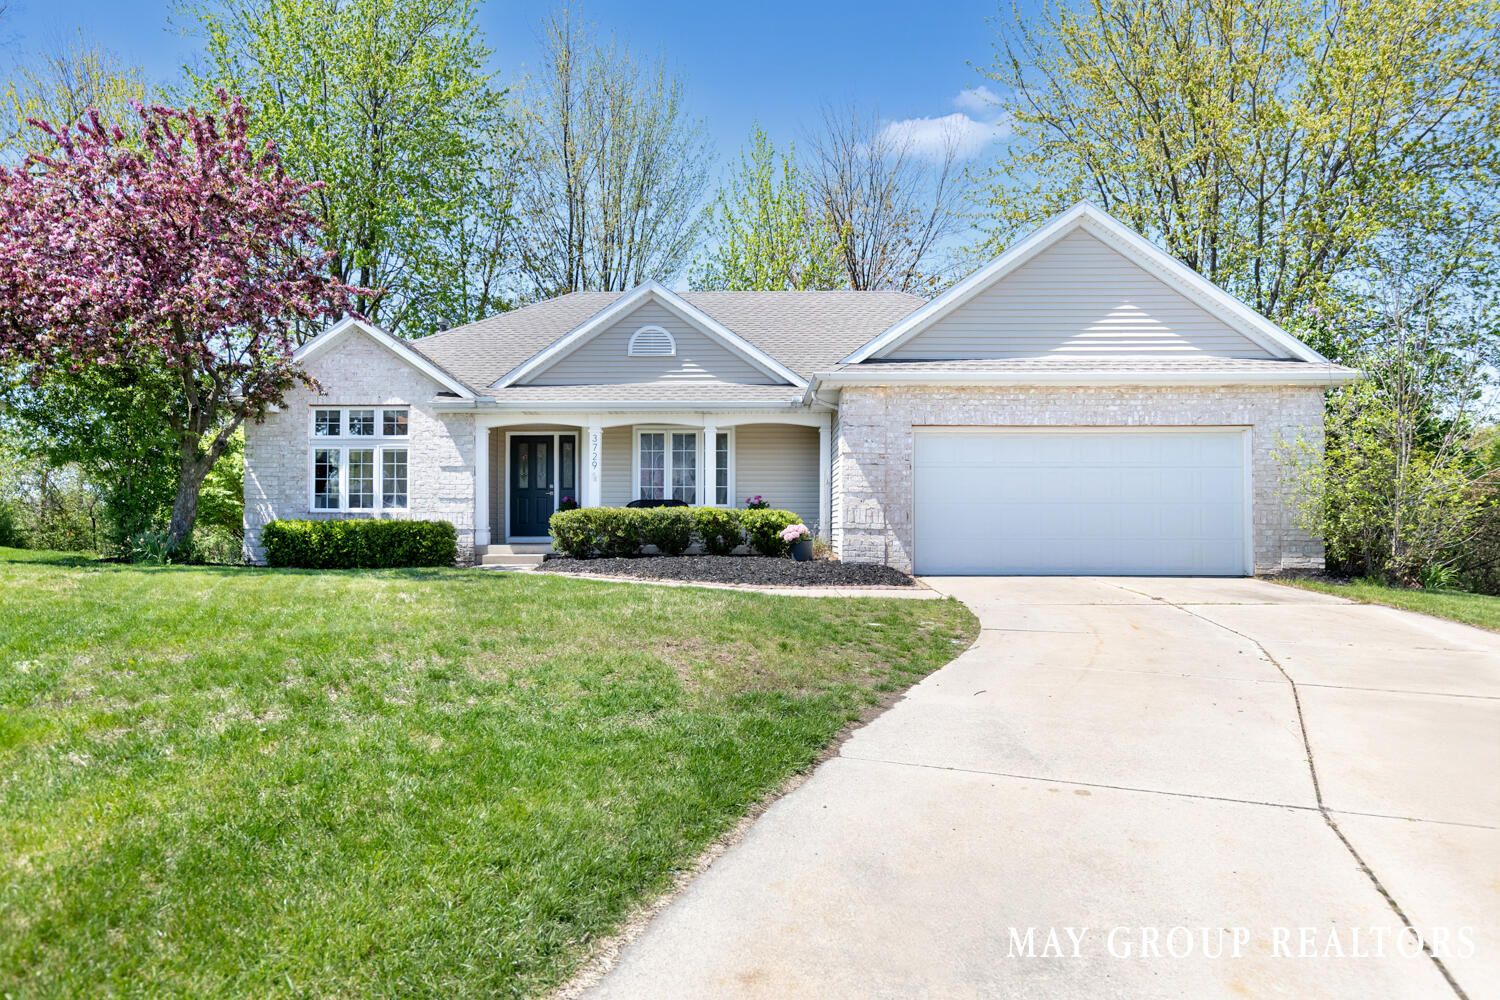
Active
$499,900
4
bds
|
3
ba
|
2,620
sqft
|
built
1999
3729 Windshire Dr SE, Grand Rapids, MI 49546
$-1,157
Cash flow
-12.1%
Cash-on-Cash Return
3.5%
Cap rate
0.6%
Rent to Value Ratio
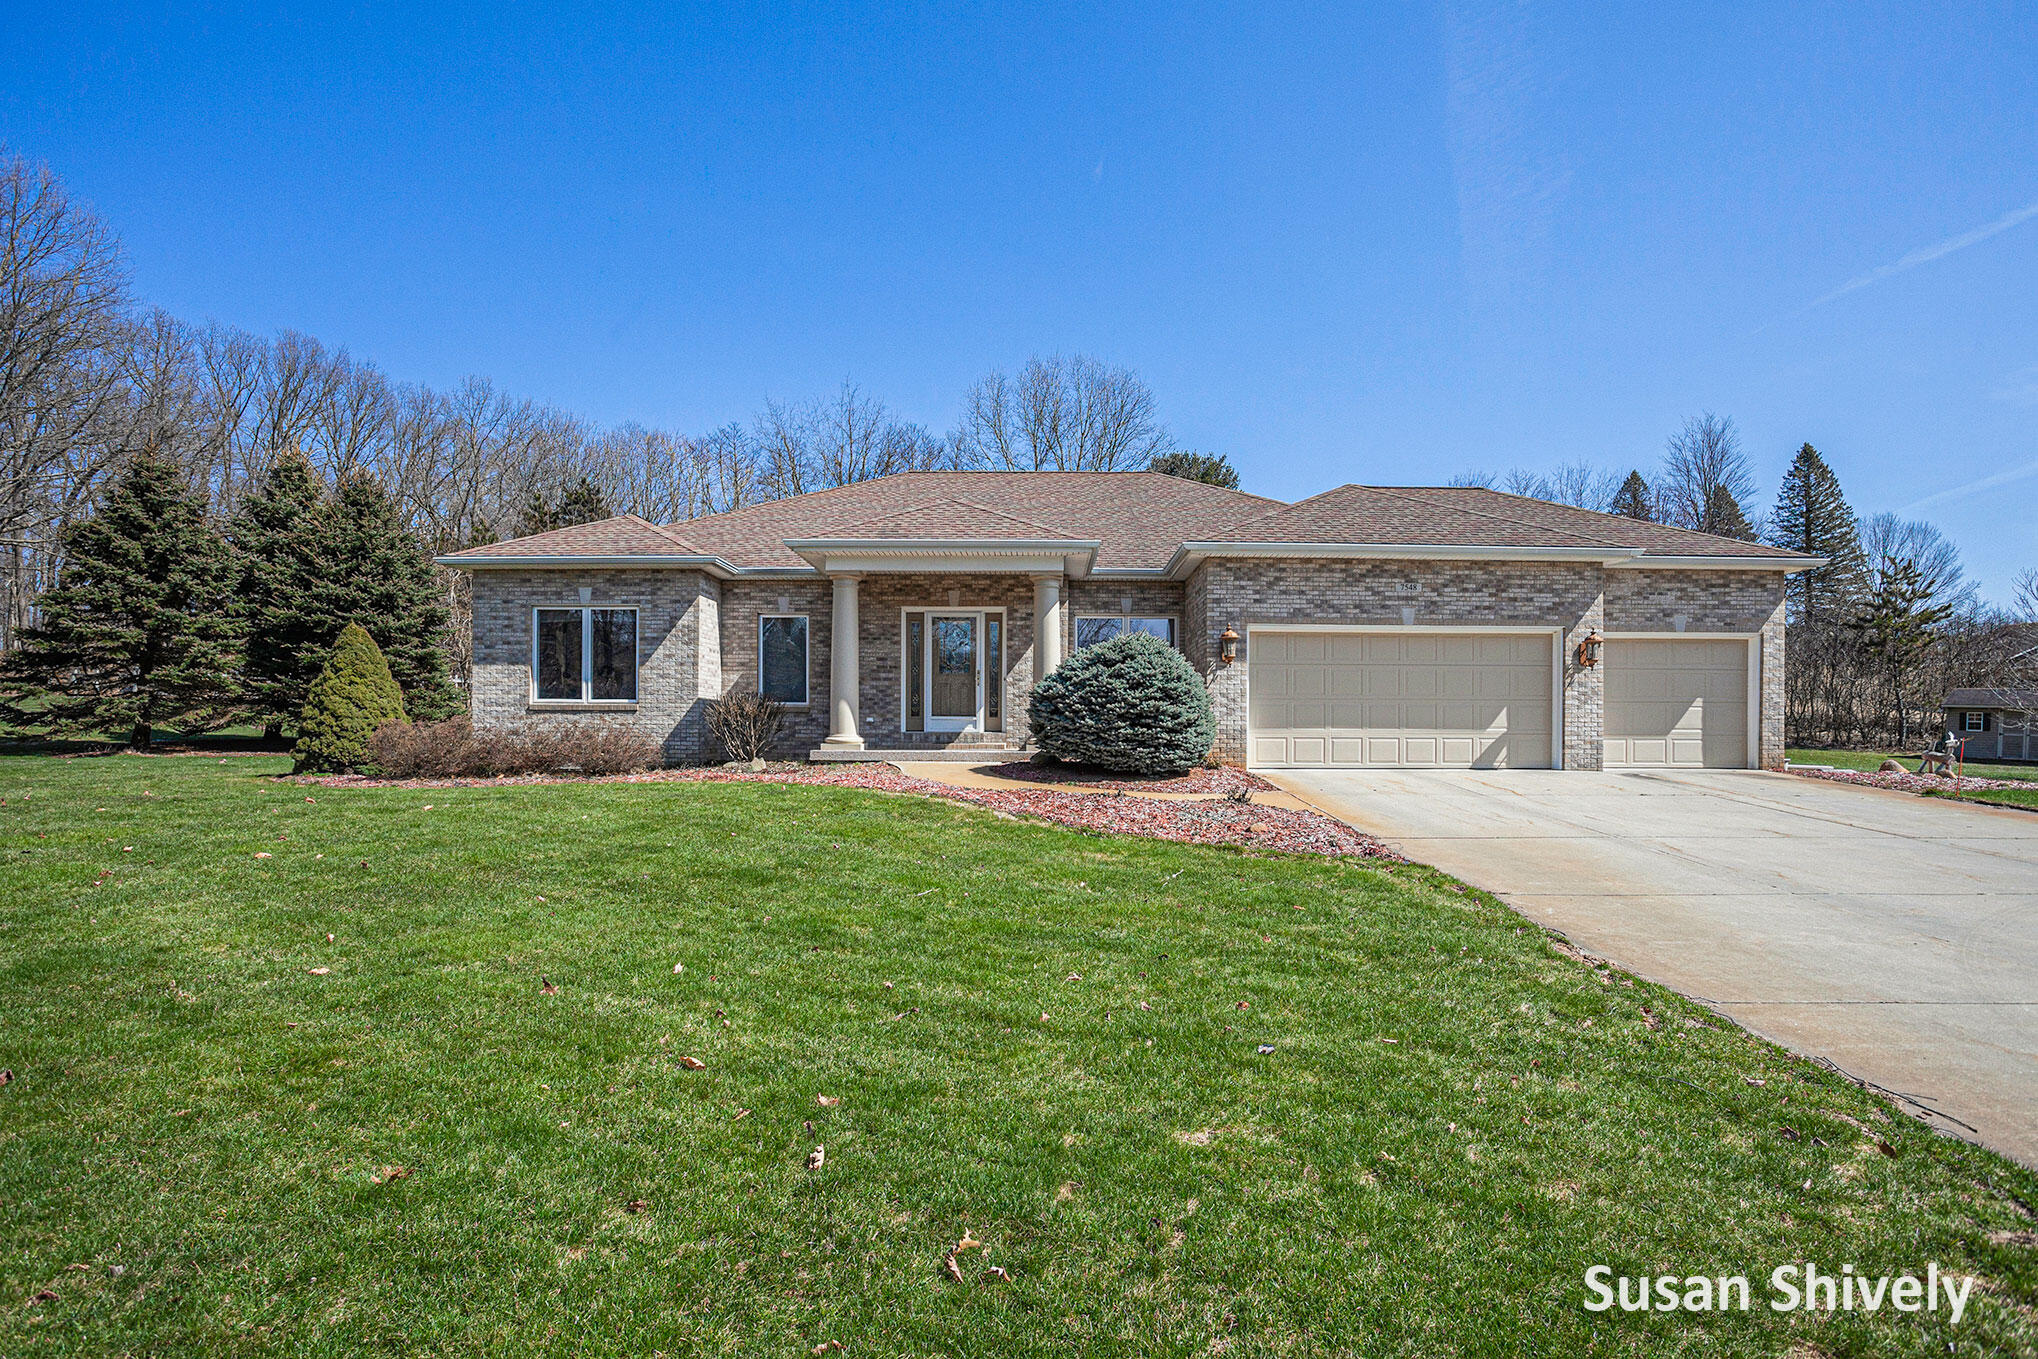
Active
$669,000
5
bds
|
4
ba
|
4,506
sqft
|
built
2003
7548 Willow Point Ct SE, Caledonia, MI 49316
$-1,542
Cash flow
-12.0%
Cash-on-Cash Return
3.5%
Cap rate
0.5%
Rent to Value Ratio
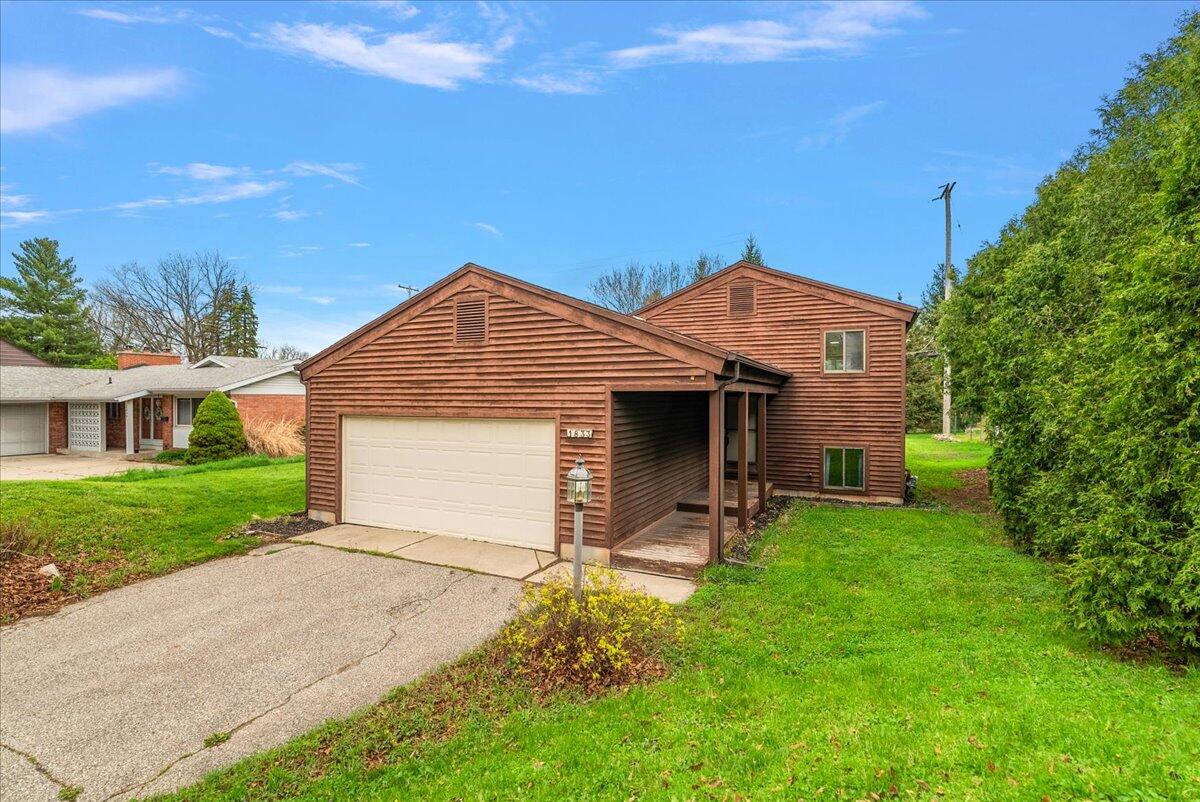
Active
$299,900
3
bds
|
2
ba
|
1,355
sqft
|
built
1987
1833 Lake Michigan Dr NW, Grand Rapids, MI 49504
$-313
Cash flow
-5.4%
Cash-on-Cash Return
5.0%
Cap rate
0.7%
Rent to Value Ratio
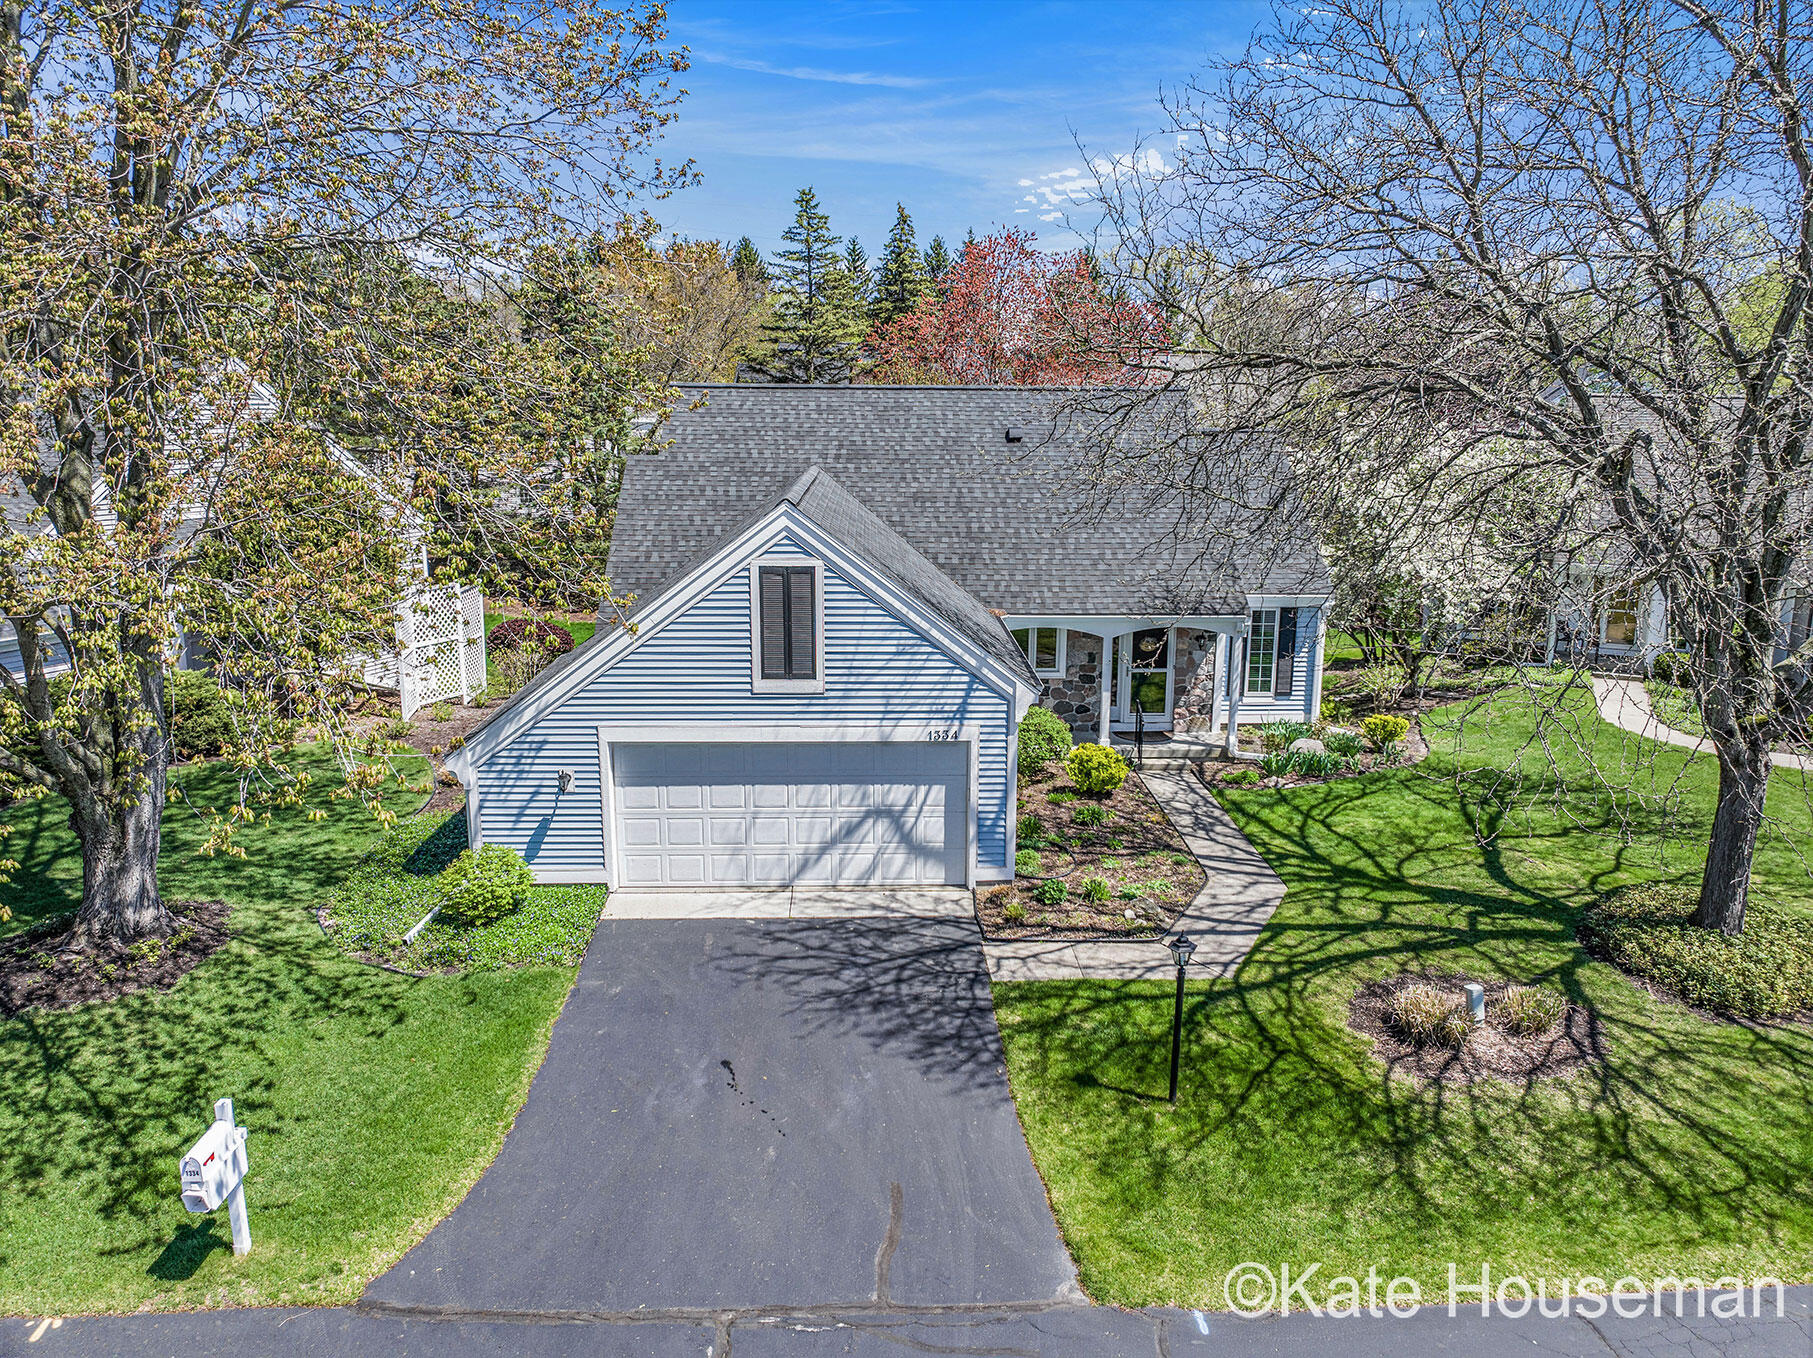
Active
$515,000
2
bds
|
3
ba
|
1,848
sqft
|
built
1988
1334 Thornberry Court West SE, Grand Rapids, MI 49546
$-1,517
Cash flow
-15.4%
Cash-on-Cash Return
2.7%
Cap rate
0.6%
Rent to Value Ratio
Active
$499,400
4
bds
|
4
ba
|
2,420
sqft
|
built
2020
6745 Craftsman Square Dr NE, Rockford, MI 49341
$-1,025
Cash flow
-10.7%
Cash-on-Cash Return
3.8%
Cap rate
0.6%
Rent to Value Ratio
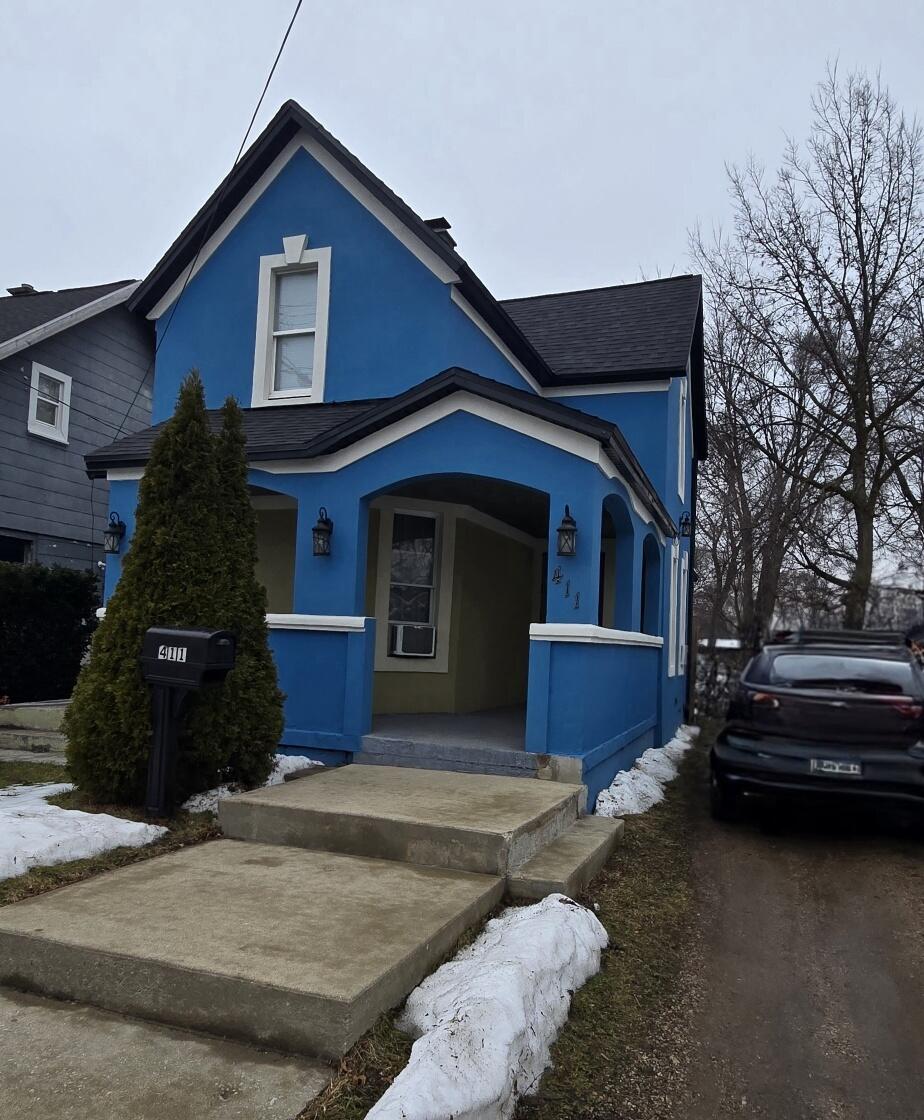
Active
$229,900
5
bds
|
2
ba
|
1,459
sqft
|
built
1900
411 Burton St SW, Grand Rapids, MI 49507
$-83
Cash flow
-1.9%
Cash-on-Cash Return
5.9%
Cap rate
0.8%
Rent to Value Ratio

Active
$324,999
3
bds
|
3
ba
|
2,328
sqft
|
built
1998
4330 Aspen Trails Dr NE, Grand Rapids, MI 49546
$-773
Cash flow
-12.4%
Cash-on-Cash Return
3.4%
Cap rate
0.7%
Rent to Value Ratio
Active
$65,000
1
bds
|
1
ba
|
600
sqft
|
built
1968
2140 Banner Dr SW, Wyoming, MI 49509
$322
Cash flow
5.8%
Cash-on-Cash Return
5.9%
Cap rate
2.0%
Rent to Value Ratio