Michigan Investment Properties for Sale
Browse homes for sale and investment properties in Michigan. Refine your search by price, property type, or more.
Best cash flowing properties in Michigan
Active
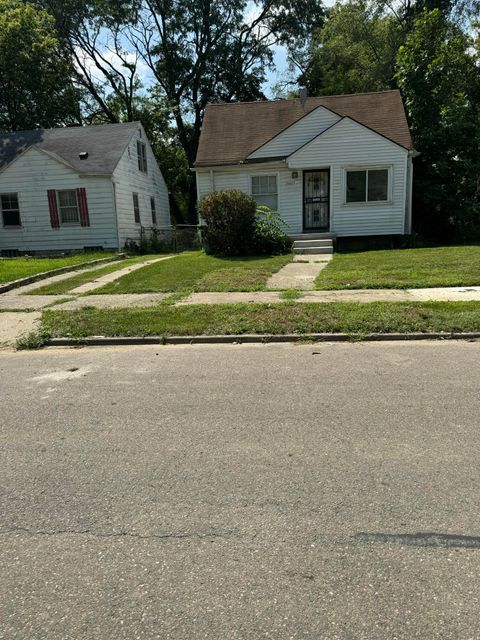
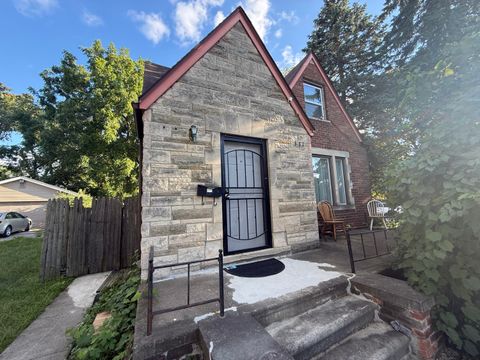
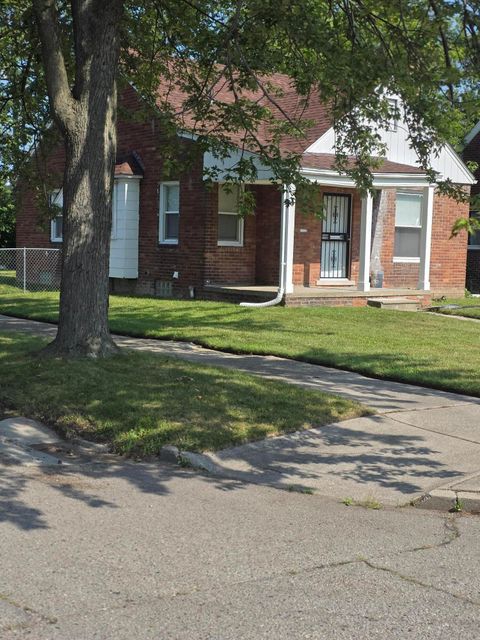
$55,300
3
bds
|
1
ba
|
960
sqft
|
built
1947
15427 Patton St, Detroit, MI 48223
$824
Cash flow
17.4%
Cash-on-Cash Return
17.9%
Cap rate
2.4%
Rent to Value Ratio
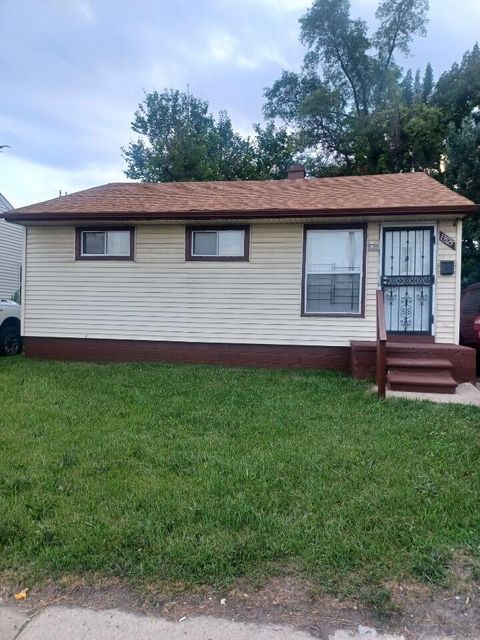
Active
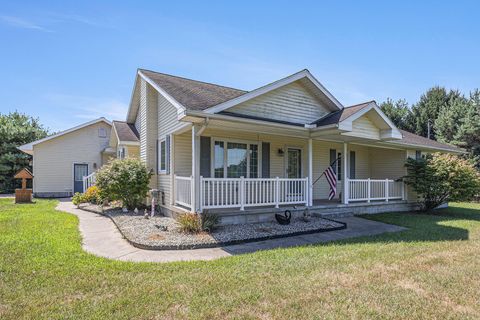
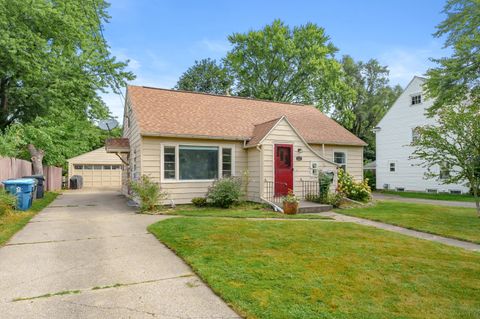
$62,500
2
bds
|
1
ba
|
754
sqft
|
built
1956
13525 Evergreen Rd, Detroit, MI 48223
$635
Cash flow
11.8%
Cash-on-Cash Return
12.2%
Cap rate
1.8%
Rent to Value Ratio
2,809 out of 5,218 properties for sale in Michigan
Limited Results Shown
Create a free account, or log in to reveal all property listings and enjoy the complete experience.

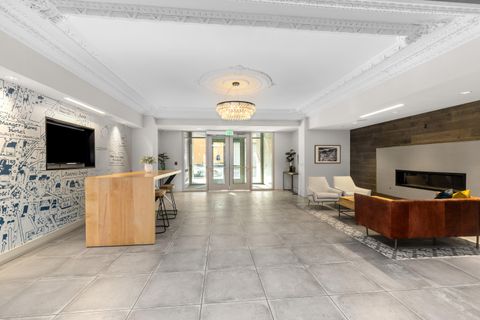
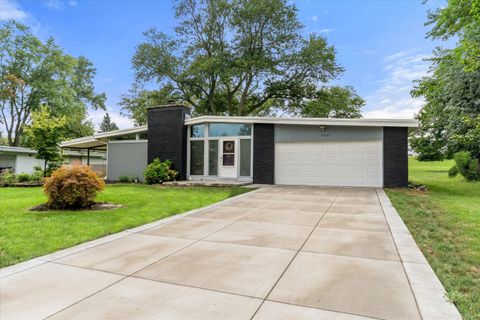
Active
$297,000
3
bds
|
3
ba
|
1,510
sqft
|
built
1944
3425 Westpoint St, Dearborn, MI 48124
$-433
Cash flow
-7.6%
Cash-on-Cash Return
4.4%
Cap rate
0.7%
Rent to Value Ratio
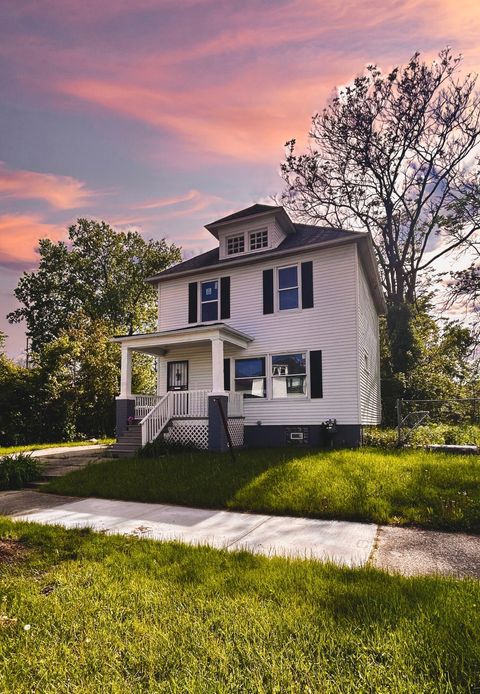
Active
$439,900
2
bds
|
2
ba
|
1,211
sqft
|
built
1921
201 Michigan St NW, Grand Rapids, MI 49503
$-1,326
Cash flow
-15.7%
Cash-on-Cash Return
2.5%
Cap rate
0.8%
Rent to Value Ratio

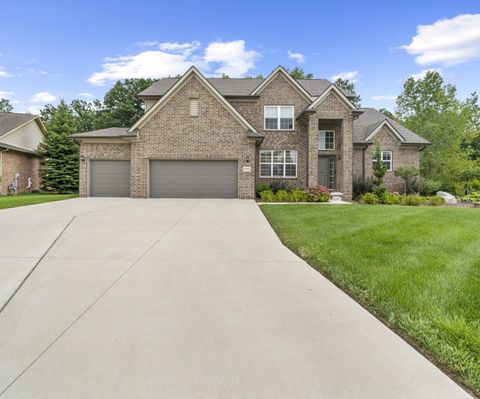
Active
$437,500
4
bds
|
4
ba
|
3,200
sqft
|
built
1964
28355 Tavistock Trl, Southfield, MI 48034
$-536
Cash flow
-6.4%
Cash-on-Cash Return
4.7%
Cap rate
0.7%
Rent to Value Ratio

Active
$400,000
4
bds
|
3
ba
|
2,560
sqft
|
built
1999
7162 Windhaven Ct, Portage, MI 49024
$-817
Cash flow
-10.7%
Cash-on-Cash Return
3.7%
Cap rate
0.6%
Rent to Value Ratio

Active
$1,299,000
3
bds
|
4
ba
|
2,600
sqft
|
built
1933
9325 Matthews Rd, Union Pier, MI 49129
$-6,013
Cash flow
-24.2%
Cash-on-Cash Return
0.6%
Cap rate
0.2%
Rent to Value Ratio
Active
$519,900
4
bds
|
3
ba
|
2,575
sqft
|
built
2021
27003 Celtic Dr, Flat Rock, MI 48134
$-1,448
Cash flow
-14.5%
Cash-on-Cash Return
2.8%
Cap rate
0.6%
Rent to Value Ratio
Active
$410,000
3
bds
|
3
ba
|
2,272
sqft
|
built
2020
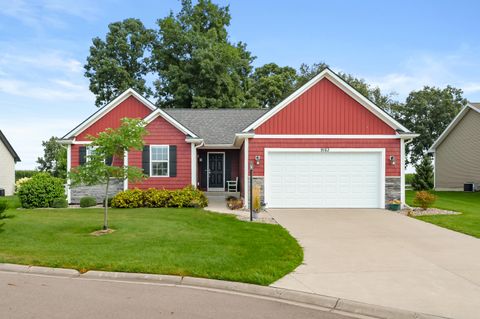
9163 Cottage Trl, Richland, MI 49083
$-1,660
Cash flow
-21.1%
Cash-on-Cash Return
1.3%
Cap rate
0.4%
Rent to Value Ratio
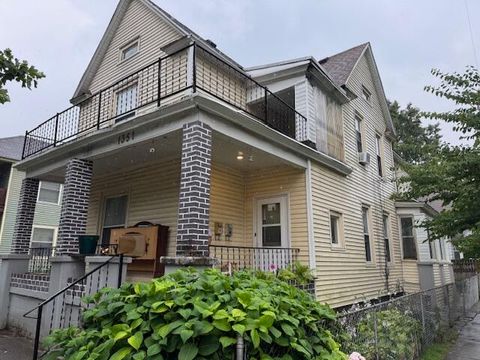
Active
$274,900
bds
|
0
ba
|
0
sqft
|
built
1895
1351 Hamilton Ave NW, Grand Rapids, MI 49504
$-214
Cash flow
-4.1%
Cash-on-Cash Return
5.2%
Cap rate
0.7%
Rent to Value Ratio

Active
$365,000
3
bds
|
1
ba
|
1,794
sqft
|
built
1984
3360 Tipsico Trl, Holly, MI 48442
$-630
Cash flow
-9.0%
Cash-on-Cash Return
4.1%
Cap rate
0.6%
Rent to Value Ratio
Active
$299,000
4
bds
|
1
ba
|
2,216
sqft
|
built
1960
5248 Coloma Rd, Coloma, MI 49038
$-221
Cash flow
-3.9%
Cash-on-Cash Return
5.3%
Cap rate
0.7%
Rent to Value Ratio
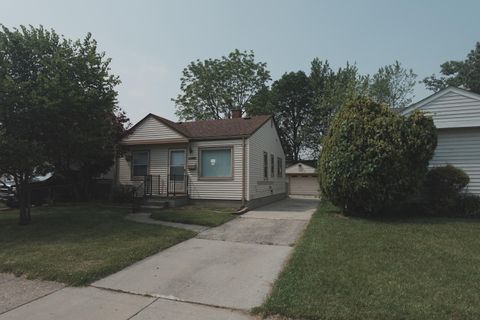
Active
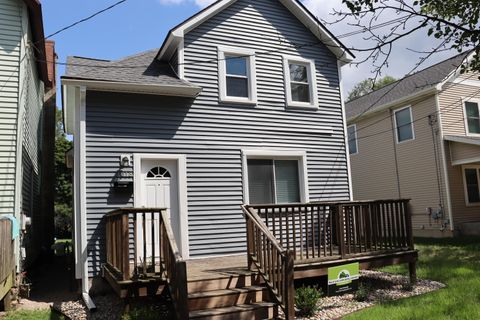
$82,500
2
bds
|
1
ba
|
696
sqft
|
built
1953
13407 Sherman Ave, Warren, MI 48089
$296
Cash flow
18.7%
Cash-on-Cash Return
10.5%
Cap rate
1.5%
Rent to Value Ratio

Active
$1,430,000
5
bds
|
4
ba
|
4,440
sqft
|
built
1973
2949 Pagoda Path, Stevensville, MI 49127
$-5,864
Cash flow
-21.4%
Cash-on-Cash Return
1.2%
Cap rate
0.2%
Rent to Value Ratio
Active
$189,000
3
bds
|
2
ba
|
1,402
sqft
|
built
1930
2013 Tyson St, Jackson, MI 49203
$-402
Cash flow
-11.1%
Cash-on-Cash Return
3.6%
Cap rate
0.7%
Rent to Value Ratio

Active
$449,000
4
bds
|
3
ba
|
2,912
sqft
|
built
1995
5621 Pine Island Dr NE, Comstock Park, MI 49321
$-1,209
Cash flow
-14.0%
Cash-on-Cash Return
2.9%
Cap rate
0.4%
Rent to Value Ratio
Active
$450,000
4
bds
|
3
ba
|
2,920
sqft
|
built
1966
8563 Mc Cain Rd, Parma, MI 49269
$-1,641
Cash flow
-19.0%
Cash-on-Cash Return
1.8%
Cap rate
0.4%
Rent to Value Ratio
Active
$2,377,700
5
bds
|
5
ba
|
7,628
sqft
|
built
1993
8050 Wilderness Trl NE, Ada, MI 49301
$-10,484
Cash flow
-23.0%
Cash-on-Cash Return
0.9%
Cap rate
0.2%
Rent to Value Ratio

Active
$469,000
2
bds
|
2
ba
|
1,379
sqft
|
built
1975
883 Hurley Dr, Howell, MI 48843
$-1,150
Cash flow
-12.8%
Cash-on-Cash Return
3.2%
Cap rate
0.5%
Rent to Value Ratio

Active
$415,000
3
bds
|
2
ba
|
1,670
sqft
|
built
2017
2917 White Oaks Rdg, Buchanan, MI 49107
$-1,099
Cash flow
-13.8%
Cash-on-Cash Return
3.0%
Cap rate
0.7%
Rent to Value Ratio
Active
$595,000
3
bds
|
1
ba
|
1,064
sqft
|
built
1914
1022 W Liberty St, Ann Arbor, MI 48103
$-1,532
Cash flow
-13.4%
Cash-on-Cash Return
3.1%
Cap rate
0.6%
Rent to Value Ratio
Active
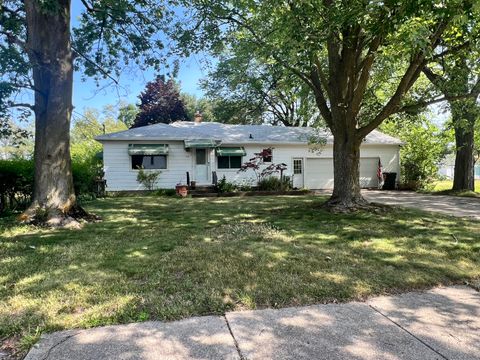
$199,900
4
bds
|
2
ba
|
1,576
sqft
|
built
1941
331 Elizabeth Lake Rd, Pontiac, MI 48341
$96
Cash flow
2.5%
Cash-on-Cash Return
6.7%
Cap rate
0.9%
Rent to Value Ratio
Active
$349,900
3
bds
|
2
ba
|
1,652
sqft
|
built
2001
10937 Waterloo Munith Rd, Munith, MI 49259
$-529
Cash flow
-7.9%
Cash-on-Cash Return
4.3%
Cap rate
0.6%
Rent to Value Ratio
Active
$329,000
3
bds
|
2
ba
|
1,561
sqft
|
built
1961
18825 Nola St, Livonia, MI 48152
$-493
Cash flow
-7.8%
Cash-on-Cash Return
4.3%
Cap rate
0.7%
Rent to Value Ratio
Active
$155,000
3
bds
|
2
ba
|
1,500
sqft
|
built
1911
2927 Seyburn St, Detroit, MI 48214
$-200
Cash flow
-6.7%
Cash-on-Cash Return
4.6%
Cap rate
1.2%
Rent to Value Ratio
Active
$240,000
2
bds
|
2
ba
|
1,036
sqft
|
built
1967
2470 Abbington Dr SE, Grand Rapids, MI 49506
$-558
Cash flow
-12.1%
Cash-on-Cash Return
3.4%
Cap rate
0.8%
Rent to Value Ratio
Active
$270,000
4
bds
|
2
ba
|
2,171
sqft
|
built
1960
146 Maplehurst Blvd, Battle Creek, MI 49017
$-413
Cash flow
-8.0%
Cash-on-Cash Return
4.3%
Cap rate
0.7%
Rent to Value Ratio
Active
$3,299,000
5
bds
|
6
ba
|
7,236
sqft
|
built
2003
4349 Island View Dr, Fenton, MI 48430
$-17,198
Cash flow
-27.2%
Cash-on-Cash Return
-0.1%
Cap rate
0.1%
Rent to Value Ratio
Active
$1,850,000
3
bds
|
3
ba
|
3,300
sqft
|
built
1972
7206 Beechwood Cir, Watervliet, MI 49098
$-6,755
Cash flow
-19.1%
Cash-on-Cash Return
1.8%
Cap rate
0.3%
Rent to Value Ratio
Active
$160,000
3
bds
|
2
ba
|
904
sqft
|
built
1946
11101 Beaconsfield St, Detroit, MI 48224
$-20
Cash flow
-0.7%
Cash-on-Cash Return
6.0%
Cap rate
0.8%
Rent to Value Ratio
Active
$235,000
3
bds
|
2
ba
|
1,782
sqft
|
built
1948
1315 Winton Ave, Kalamazoo, MI 49001
$-158
Cash flow
-3.5%
Cash-on-Cash Return
5.3%
Cap rate
0.9%
Rent to Value Ratio
Active
$145,000
4
bds
|
2
ba
|
1,398
sqft
|
built
1895
1018 N Rose St, Kalamazoo, MI 49007
$223
Cash flow
8.0%
Cash-on-Cash Return
8.0%
Cap rate
1.0%
Rent to Value Ratio
Active
$314,900
3
bds
|
1
ba
|
1,084
sqft
|
built
1959
45 Daniel St SE, Kentwood, MI 49548
$-590
Cash flow
-9.8%
Cash-on-Cash Return
3.9%
Cap rate
0.6%
Rent to Value Ratio
Active
$295,000
4
bds
|
1
ba
|
1,920
sqft
|
built
1978
29460 M 62 W, Dowagiac, MI 49047
$-574
Cash flow
-10.2%
Cash-on-Cash Return
3.8%
Cap rate
0.5%
Rent to Value Ratio

Active
$350,000
4
bds
|
3
ba
|
2,594
sqft
|
built
1990
395 Burt St, Tecumseh, MI 49286
$-891
Cash flow
-13.3%
Cash-on-Cash Return
3.1%
Cap rate
0.6%
Rent to Value Ratio
Active
$575,000
3
bds
|
4
ba
|
3,973
sqft
|
built
1951
14511 Harbor Is, Detroit, MI 48215
$-679
Cash flow
-6.2%
Cash-on-Cash Return
4.7%
Cap rate
0.7%
Rent to Value Ratio

Active
$325,000
3
bds
|
3
ba
|
1,895
sqft
|
built
2007
5230 Grand River Cir, Jackson, MI 49201
$-665
Cash flow
-10.7%
Cash-on-Cash Return
3.7%
Cap rate
0.6%
Rent to Value Ratio
Active
$335,000
2
bds
|
3
ba
|
1,300
sqft
|
built
2001
3057 Barclay Way, Ann Arbor, MI 48105
$-784
Cash flow
-12.2%
Cash-on-Cash Return
3.3%
Cap rate
0.7%
Rent to Value Ratio
Active
$348,900
3
bds
|
2
ba
|
1,860
sqft
|
built
2003
8381 Waite Rd, Clarklake, MI 49234
$-584
Cash flow
-8.7%
Cash-on-Cash Return
4.1%
Cap rate
0.6%
Rent to Value Ratio
Active
$385,000
3
bds
|
2
ba
|
1,679
sqft
|
built
1995
699 Lincoln Lake Ave NE, Lowell, MI 49331
$-664
Cash flow
-9.0%
Cash-on-Cash Return
4.1%
Cap rate
0.6%
Rent to Value Ratio