Miami, FL Investment Properties for Sale
Browse homes for sale and investment properties in Miami, FL. Refine your search by price, property type, or more.
Best cash flowing properties in Miami, FL
Active
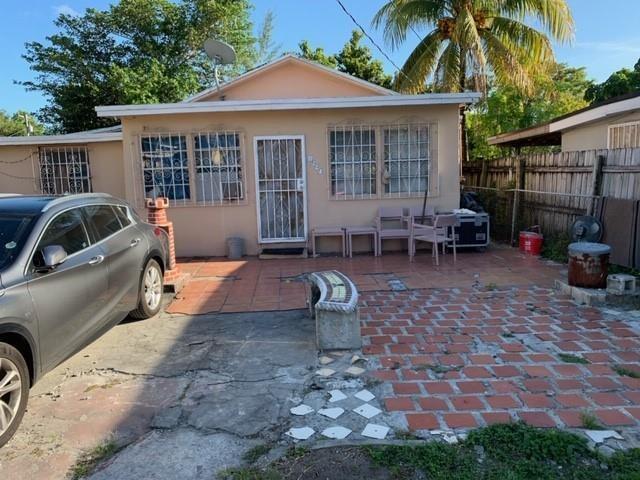
$409,900
4
bds
|
2
ba
|
1,283
sqft
|
built
1930
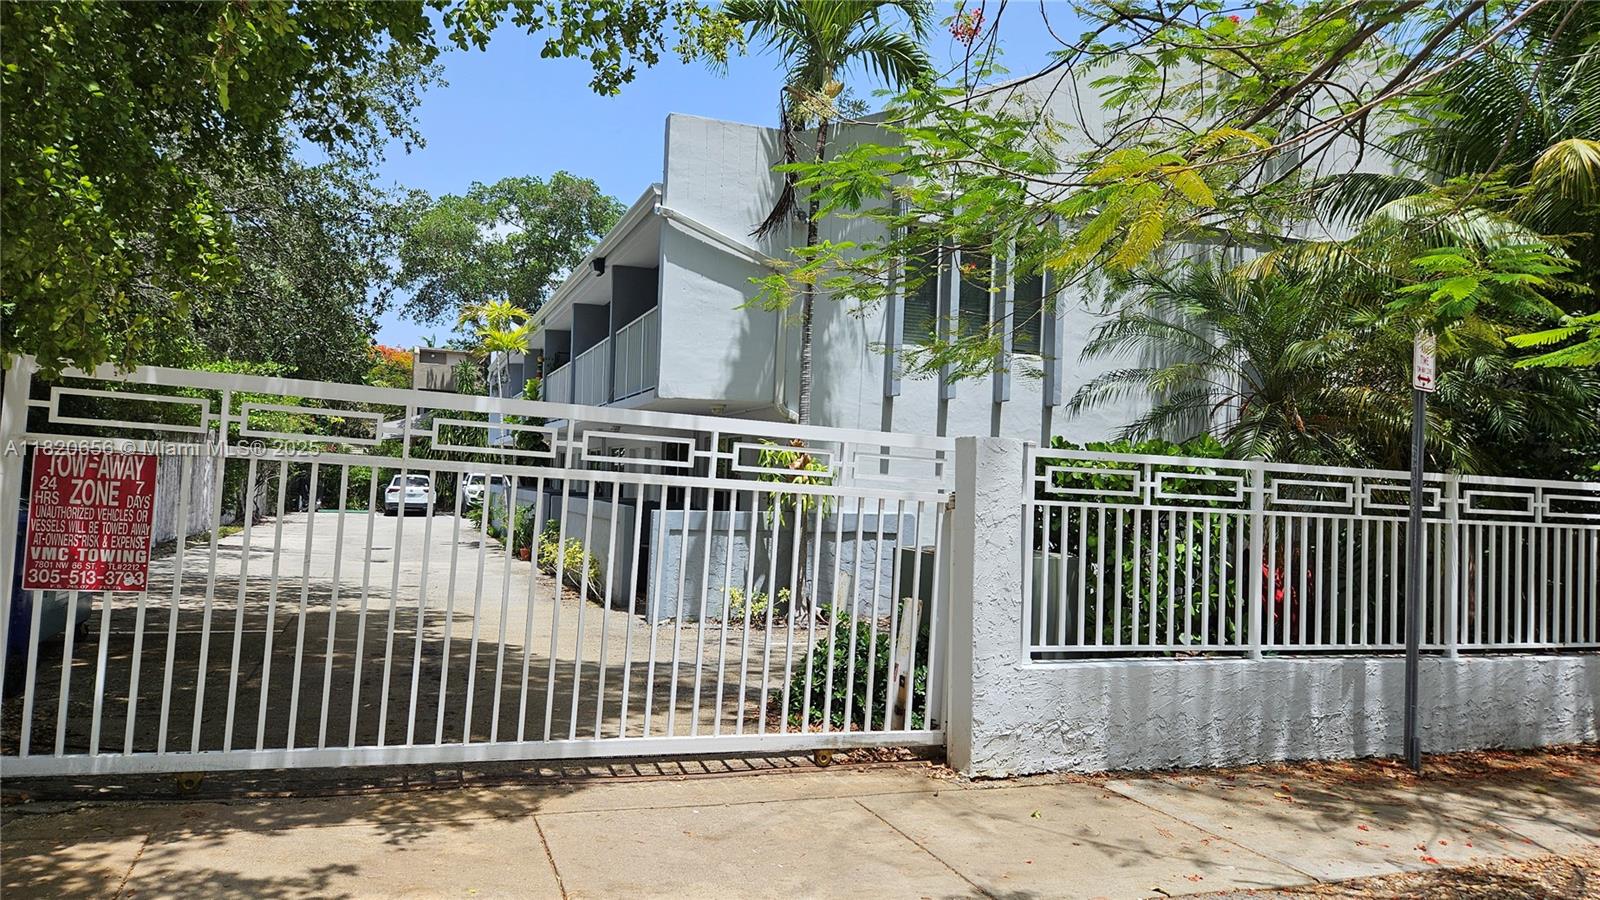
1850 NW 35th St, Miami, FL 33142
$-222
Cash flow
-2.8%
Cash-on-Cash Return
5.6%
Cap rate
0.7%
Rent to Value Ratio

Active
$274,900
2
bds
|
2
ba
|
812
sqft
|
built
1986
7011 SW 129th Ave, Miami, FL 33183
$-435
Cash flow
-8.3%
Cash-on-Cash Return
4.4%
Cap rate
0.8%
Rent to Value Ratio
6,363 out of 7,222 properties for sale in Miami, FL
Limited Results Shown
Create a free account, or log in to reveal all property listings and enjoy the complete experience.
Active
$1,549,000
4
bds
|
2
ba
|
2,193
sqft
|
built
1960
6445 SW 52nd St, Miami, FL 33155
$-5,329
Cash flow
-17.9%
Cash-on-Cash Return
2.2%
Cap rate
0.4%
Rent to Value Ratio
Active
$2,650,000
5
bds
|
3
ba
|
2,263
sqft
|
built
1939
3767 Royal Palm Ave, Miami, FL 33140
$-9,186
Cash flow
-18.1%
Cash-on-Cash Return
2.1%
Cap rate
0.3%
Rent to Value Ratio
Active
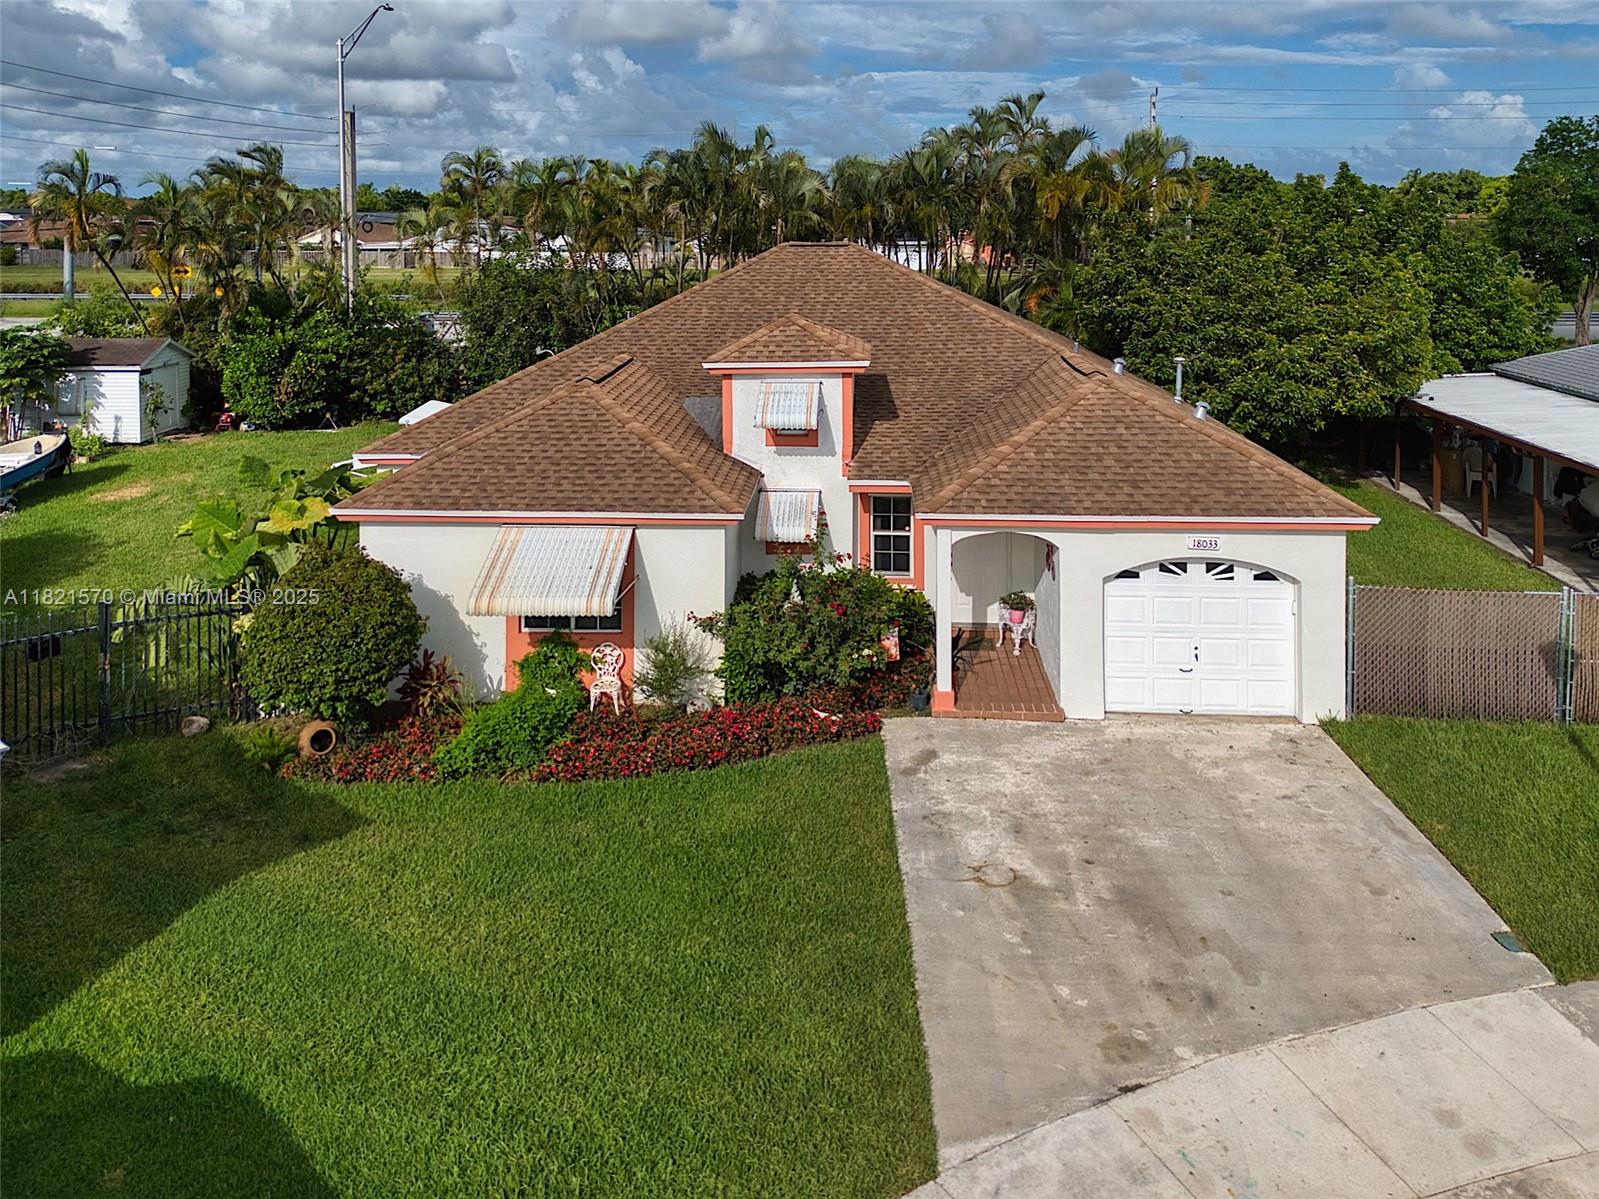
$699,000
4
bds
|
2
ba
|
1,909
sqft
|
built
1995
18033 SW 137th Ct, Miami, FL 33177
$-2,082
Cash flow
-15.5%
Cash-on-Cash Return
2.7%
Cap rate
0.5%
Rent to Value Ratio
Active
$599,990
3
bds
|
3
ba
|
1,518
sqft
|
built
2003
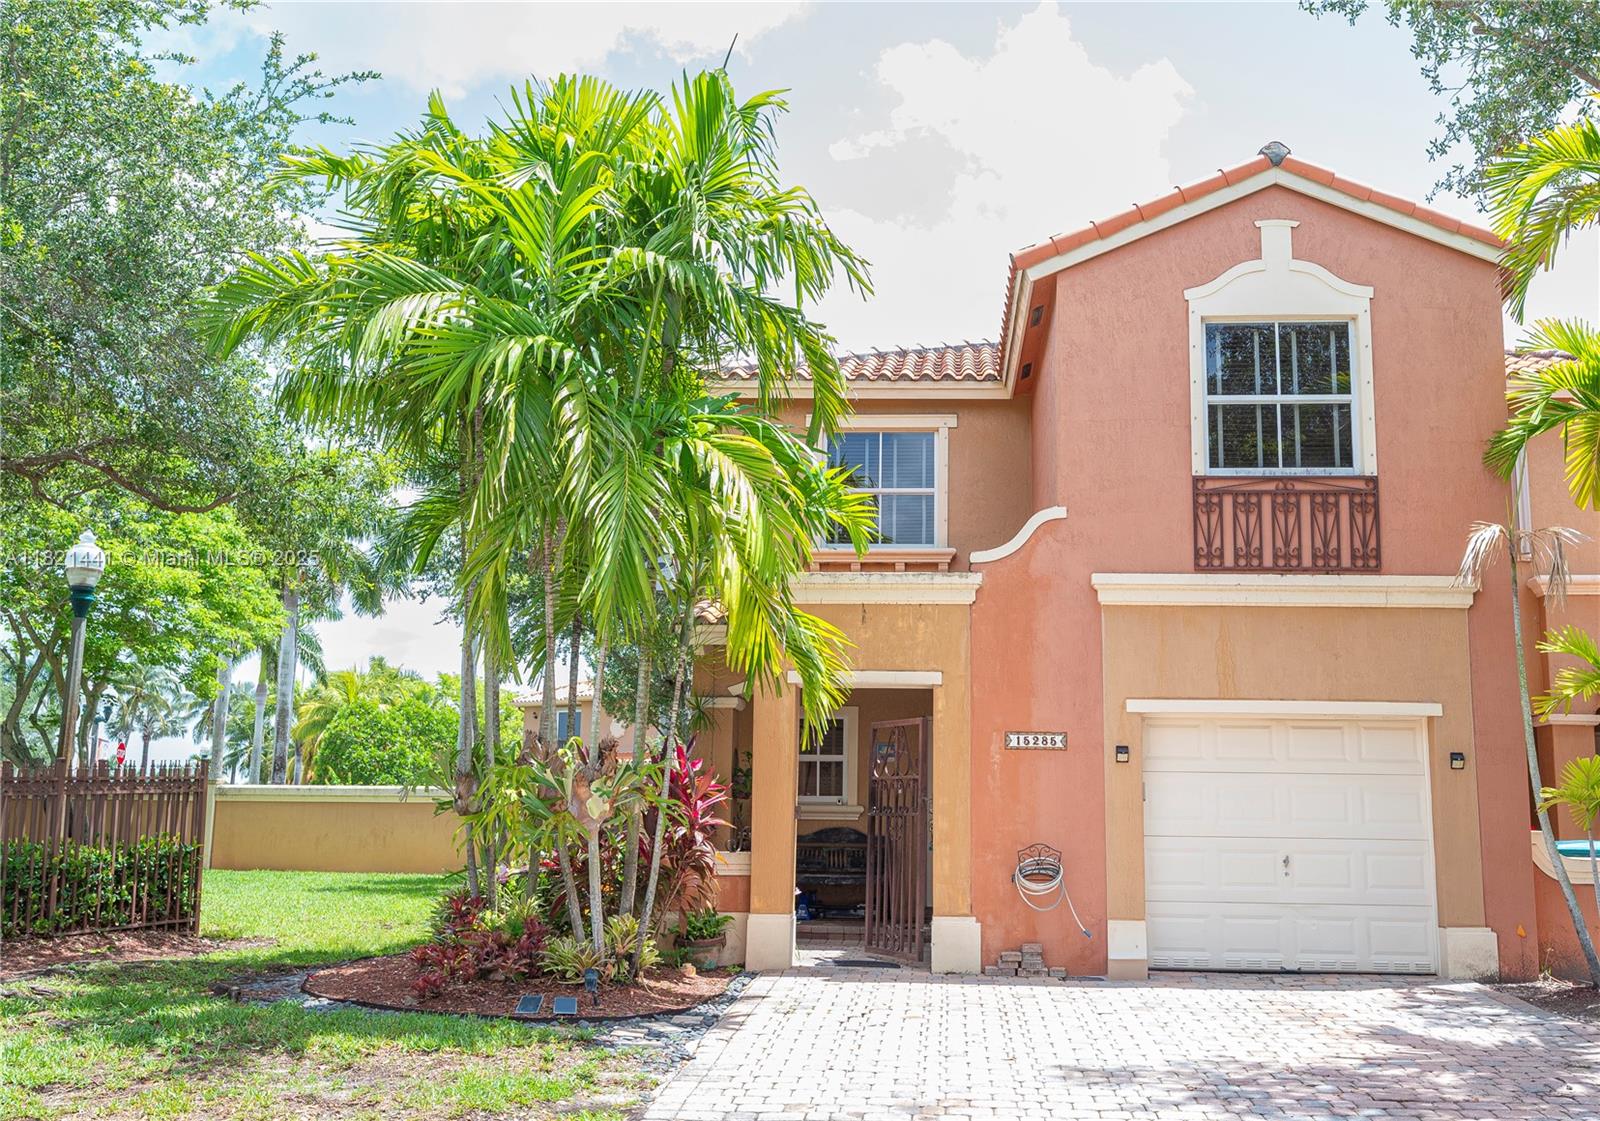
15285 SW 30th Ter, Miami, FL 33185
$-1,881
Cash flow
-16.4%
Cash-on-Cash Return
2.5%
Cap rate
0.5%
Rent to Value Ratio

Active
$1,050,000
4
bds
|
4
ba
|
0
sqft
|
built
2022
19410 SW 124th Ct, Miami, FL 33177
$-2,867
Cash flow
-14.2%
Cash-on-Cash Return
3.0%
Cap rate
0.4%
Rent to Value Ratio
Active
$1,600,000
4
bds
|
3
ba
|
2,816
sqft
|
built
2003
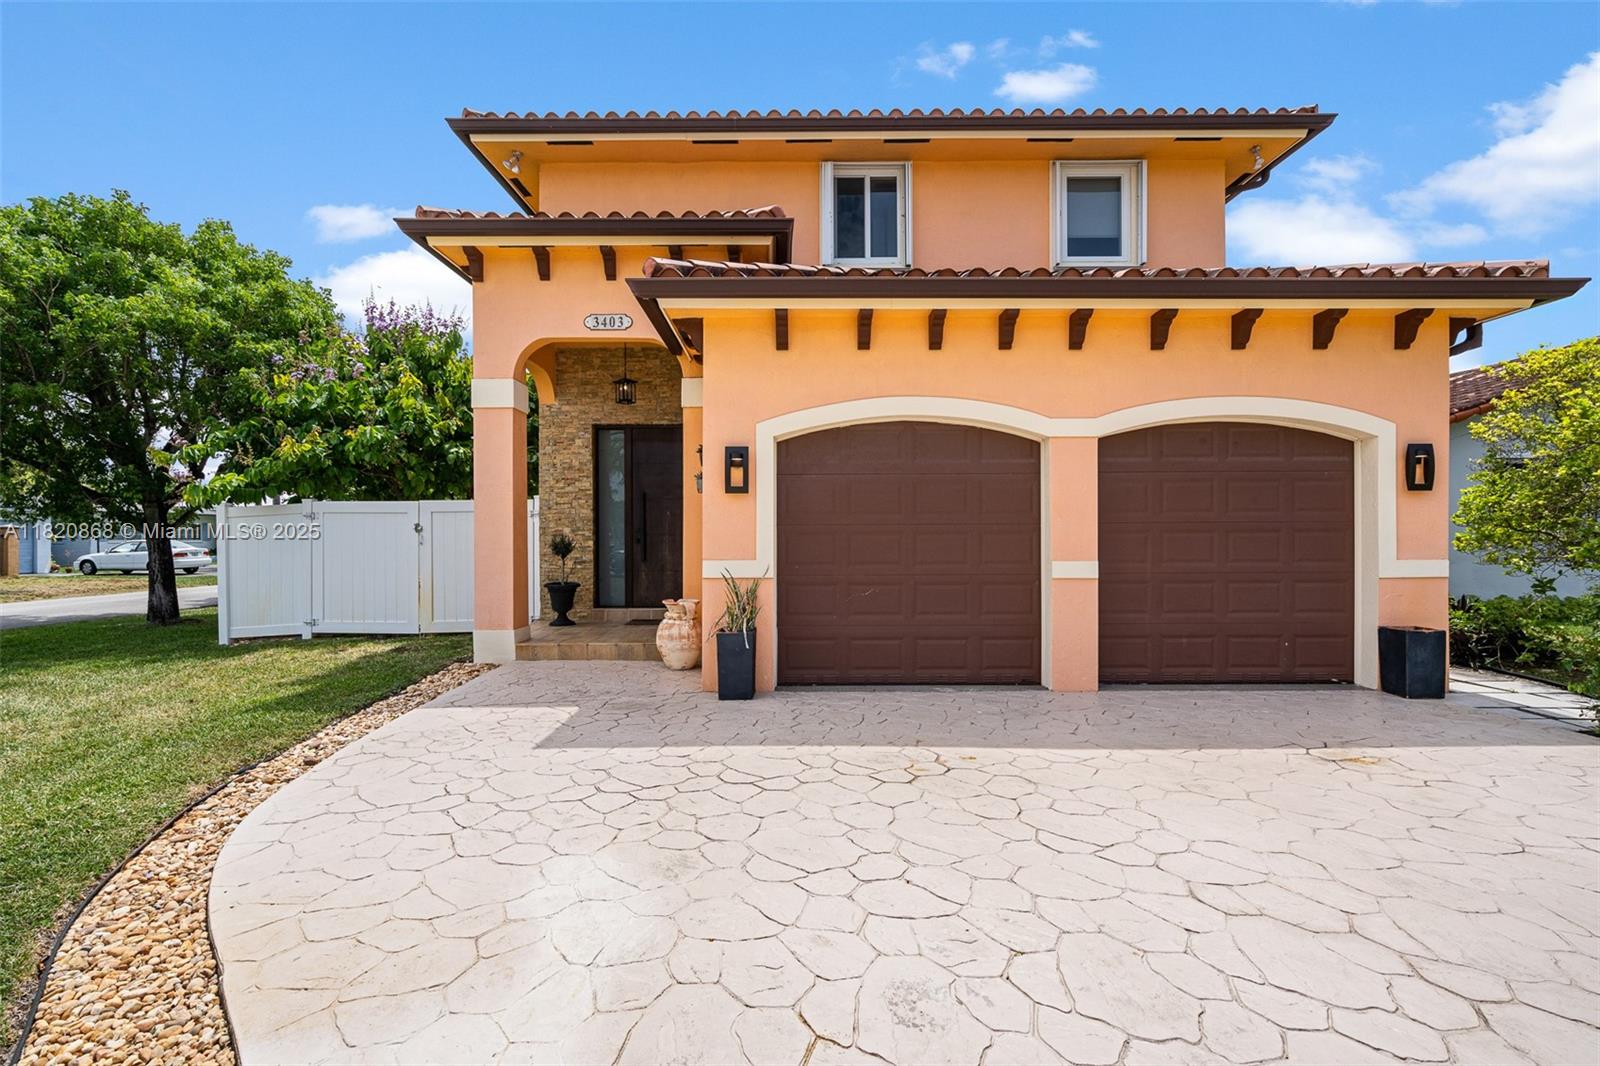
3403 SW 63rd Ave, Miami, FL 33155
$-4,336
Cash flow
-14.1%
Cash-on-Cash Return
3.0%
Cap rate
0.5%
Rent to Value Ratio
Active
$890,000
4
bds
|
3
ba
|
2,058
sqft
|
built
1989
13925 SW 26th Ter, Miami, FL 33175
$-2,252
Cash flow
-13.2%
Cash-on-Cash Return
3.3%
Cap rate
0.5%
Rent to Value Ratio
Active
$274,900
2
bds
|
2
ba
|
812
sqft
|
built
1986
7011 SW 129th Ave, Miami, FL 33183
$-435
Cash flow
-8.3%
Cash-on-Cash Return
4.4%
Cap rate
0.8%
Rent to Value Ratio
Active
$400,000
3
bds
|
2
ba
|
2,195
sqft
|
built
1978
20100 NE 10th Place Way, Miami, FL 33179
$-854
Cash flow
-11.1%
Cash-on-Cash Return
3.7%
Cap rate
0.8%
Rent to Value Ratio
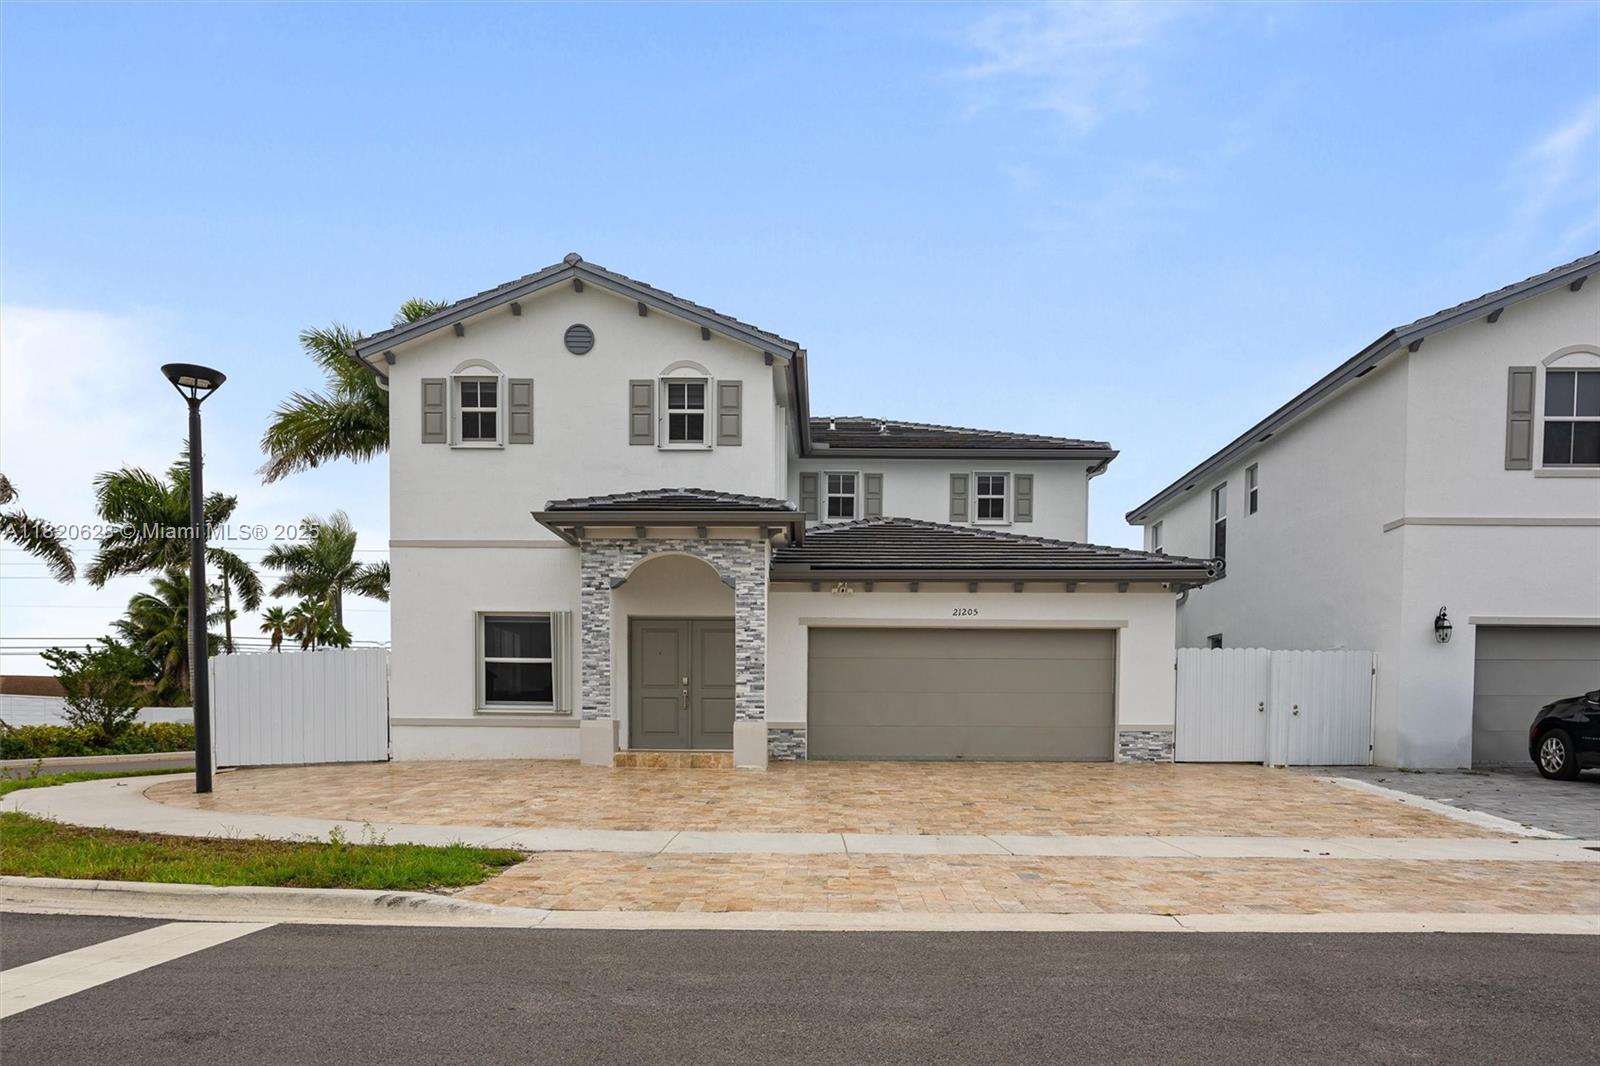
Active
$880,000
5
bds
|
4
ba
|
3,349
sqft
|
built
2023
21205 SW 127th Ct, Miami, FL 33177
$-2,654
Cash flow
-15.7%
Cash-on-Cash Return
2.7%
Cap rate
0.5%
Rent to Value Ratio

Active
$795,000
2
bds
|
2
ba
|
912
sqft
|
built
2017
2900 NE 7th Ave, Miami, FL 33137
$-2,908
Cash flow
-19.1%
Cash-on-Cash Return
1.9%
Cap rate
0.6%
Rent to Value Ratio

Active
$1,699,000
4
bds
|
3
ba
|
2,890
sqft
|
built
1962
8375 SW 89th St, Miami, FL 33156
$-4,586
Cash flow
-14.1%
Cash-on-Cash Return
3.1%
Cap rate
0.4%
Rent to Value Ratio
Active
$617,000
2
bds
|
2
ba
|
1,107
sqft
|
built
2004
2000 N Bayshore Dr, Miami, FL 33137
$-2,025
Cash flow
-17.1%
Cash-on-Cash Return
2.4%
Cap rate
0.6%
Rent to Value Ratio
Active
$380,000
3
bds
|
3
ba
|
1,165
sqft
|
built
1980
6315 SW 138th Ct, Miami, FL 33183
$-1,231
Cash flow
-16.9%
Cash-on-Cash Return
2.4%
Cap rate
0.7%
Rent to Value Ratio

Active
$425,000
3
bds
|
2
ba
|
1,973
sqft
|
built
1954
19800 NW Miami Ct, Miami, FL 33169
$-678
Cash flow
-8.3%
Cash-on-Cash Return
4.4%
Cap rate
0.8%
Rent to Value Ratio
Active
$740,000
4
bds
|
2
ba
|
1,597
sqft
|
built
1995
13774 SW 181st Ter, Miami, FL 33177
$-1,798
Cash flow
-12.7%
Cash-on-Cash Return
3.4%
Cap rate
0.5%
Rent to Value Ratio
Active
$1,249,000
2
bds
|
2
ba
|
1,390
sqft
|
built
2009
495 Brickell Ave, Miami, FL 33131
$-4,699
Cash flow
-19.6%
Cash-on-Cash Return
1.8%
Cap rate
0.6%
Rent to Value Ratio

Active
$2,225,000
4
bds
|
3
ba
|
2,277
sqft
|
built
1946
4531 SW 15th St, Miami, FL 33134
$-7,917
Cash flow
-18.6%
Cash-on-Cash Return
2.0%
Cap rate
0.4%
Rent to Value Ratio

Active
$2,125,000
4
bds
|
3
ba
|
2,634
sqft
|
built
1969
7980 SW 108th St, Miami, FL 33156
$-7,008
Cash flow
-17.2%
Cash-on-Cash Return
2.3%
Cap rate
0.3%
Rent to Value Ratio
Active
$800,000
2
bds
|
2
ba
|
1,168
sqft
|
built
2015
600 NE 27th St, Miami, FL 33137
$-2,717
Cash flow
-17.7%
Cash-on-Cash Return
2.2%
Cap rate
0.6%
Rent to Value Ratio
Active
$869,000
3
bds
|
3
ba
|
2,981
sqft
|
built
2001
16313 SW 66th St, Miami, FL 33193
$-2,496
Cash flow
-15.0%
Cash-on-Cash Return
2.8%
Cap rate
0.5%
Rent to Value Ratio

Active
$360,000
1
bds
|
2
ba
|
842
sqft
|
built
2008
7275 SW 90th Way, Miami, FL 33156
$-1,190
Cash flow
-17.2%
Cash-on-Cash Return
2.3%
Cap rate
0.7%
Rent to Value Ratio

Active
$799,999
6
bds
|
5
ba
|
2,373
sqft
|
built
1950
2941 NW 96th St, Miami, FL 33147
$-2,603
Cash flow
-17.0%
Cash-on-Cash Return
2.4%
Cap rate
0.4%
Rent to Value Ratio

Active
$508,000
3
bds
|
2
ba
|
1,232
sqft
|
built
1956
1300 NE 210th Ter, Miami, FL 33179
$-977
Cash flow
-10.0%
Cash-on-Cash Return
4.0%
Cap rate
0.6%
Rent to Value Ratio
Active
$520,000
3
bds
|
3
ba
|
1,348
sqft
|
built
1989
7787 SW 102nd Ln, Miami, FL 33156
$-1,214
Cash flow
-12.2%
Cash-on-Cash Return
3.5%
Cap rate
0.7%
Rent to Value Ratio
Active
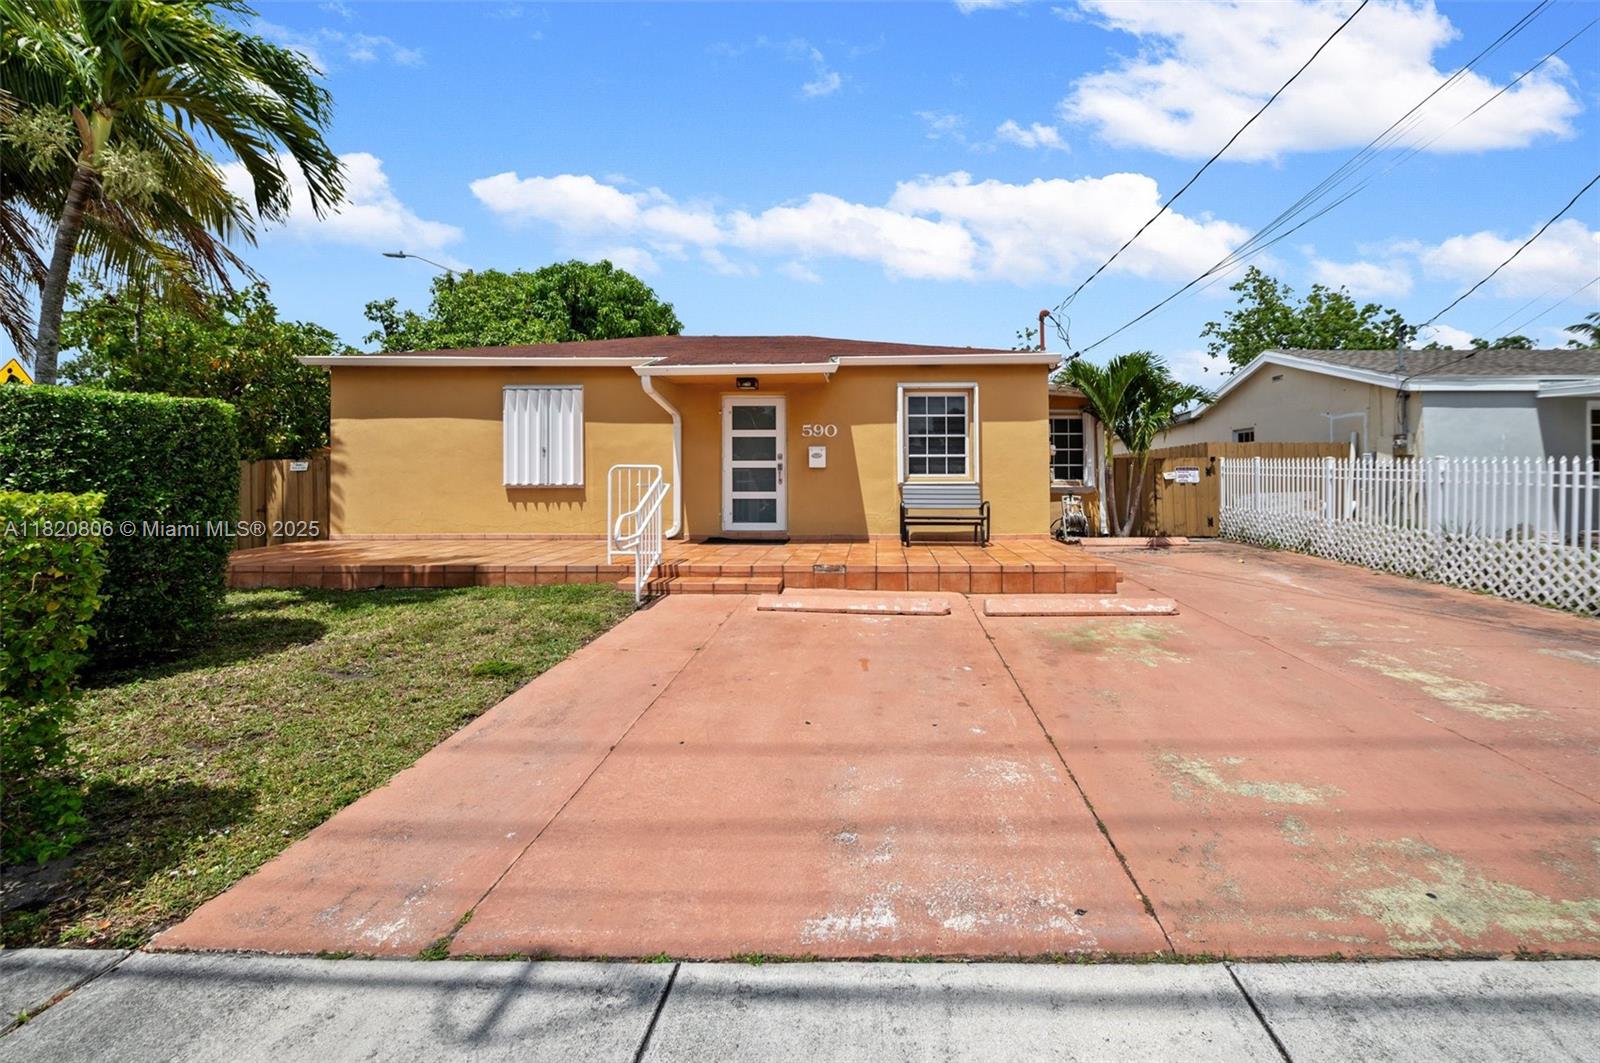
$760,000
4
bds
|
4
ba
|
1,790
sqft
|
built
1947
590 SW 62nd Ave, Miami, FL 33144
$-2,352
Cash flow
-16.1%
Cash-on-Cash Return
2.6%
Cap rate
0.5%
Rent to Value Ratio
Active
$410,000
2
bds
|
3
ba
|
1,330
sqft
|
built
1980
7074 SW 114th Pl, Miami, FL 33173
$-1,452
Cash flow
-18.5%
Cash-on-Cash Return
2.0%
Cap rate
0.7%
Rent to Value Ratio
Active
$1,250,000
2
bds
|
0
ba
|
1,798
sqft
|
built
1953
280 NW 34th St, Miami, FL 33127
$-3,826
Cash flow
-16.0%
Cash-on-Cash Return
2.6%
Cap rate
0.4%
Rent to Value Ratio
Active
$857,000
2
bds
|
3
ba
|
1,540
sqft
|
built
2007
185 SW 7th St, Miami, FL 33130
$-457
Cash flow
-2.8%
Cash-on-Cash Return
5.6%
Cap rate
1.1%
Rent to Value Ratio
Active
$400,000
1
bds
|
2
ba
|
700
sqft
|
built
1973
3025 Mary St, Miami, FL 33133
$-936
Cash flow
-12.2%
Cash-on-Cash Return
3.5%
Cap rate
0.7%
Rent to Value Ratio

Active
$1,195,000
2
bds
|
3
ba
|
1,301
sqft
|
built
2018
650 NE 32nd St, Miami, FL 33137
$-4,725
Cash flow
-20.6%
Cash-on-Cash Return
1.5%
Cap rate
0.5%
Rent to Value Ratio

Active
$698,000
2
bds
|
2
ba
|
1,945
sqft
|
built
1951
3082 NW 4th St, Miami, FL 33125
$-1,291
Cash flow
-9.6%
Cash-on-Cash Return
4.1%
Cap rate
0.5%
Rent to Value Ratio

Active
$1,799,000
3
bds
|
3
ba
|
2,577
sqft
|
built
2014
3318 Day Ave, Miami, FL 33133
$-5,734
Cash flow
-16.6%
Cash-on-Cash Return
2.5%
Cap rate
0.5%
Rent to Value Ratio
Active
$605,000
bds
|
1
ba
|
627
sqft
|
built
2018
801 S Miami Ave, Miami, FL 33130
$-3,112
Cash flow
-26.8%
Cash-on-Cash Return
0.1%
Cap rate
0.6%
Rent to Value Ratio
Active
$541,000
3
bds
|
1
ba
|
1,591
sqft
|
built
1957
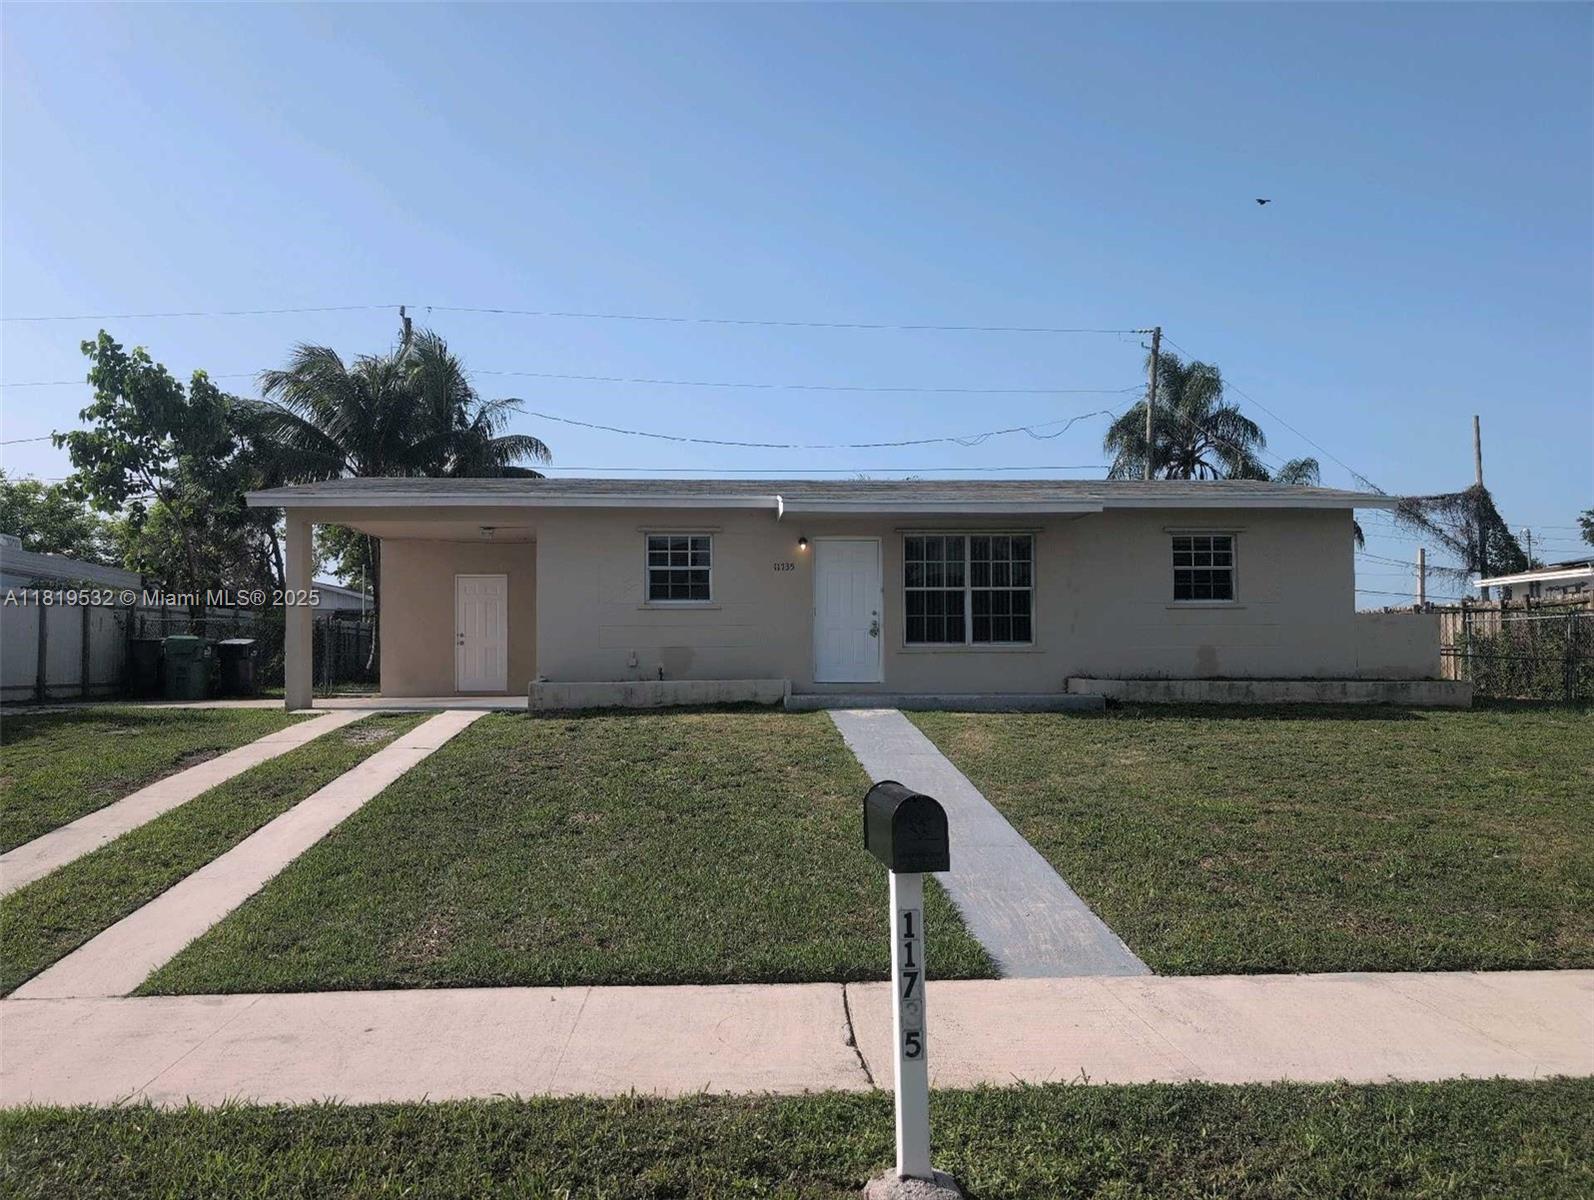
11735 SW 185th St, Miami, FL 33177
$-1,273
Cash flow
-12.3%
Cash-on-Cash Return
3.5%
Cap rate
0.6%
Rent to Value Ratio
Active
$1,200,000
3
bds
|
3
ba
|
2,360
sqft
|
built
1979
19707 Turnberry Way, Miami, FL 33180
$-4,856
Cash flow
-21.1%
Cash-on-Cash Return
1.4%
Cap rate
0.6%
Rent to Value Ratio
Active
$409,900
4
bds
|
2
ba
|
1,283
sqft
|
built
1930
1850 NW 35th St, Miami, FL 33142
$-222
Cash flow
-2.8%
Cash-on-Cash Return
5.6%
Cap rate
0.7%
Rent to Value Ratio
Active
$630,000
3
bds
|
3
ba
|
2,053
sqft
|
built
1961
17320 SW 117th Ave, Miami, FL 33177
$-1,368
Cash flow
-11.3%
Cash-on-Cash Return
3.7%
Cap rate
0.5%
Rent to Value Ratio

Active
$300,000
2
bds
|
2
ba
|
965
sqft
|
built
1980
8015 SW 107th Ave, Miami, FL 33173
$-724
Cash flow
-12.6%
Cash-on-Cash Return
3.4%
Cap rate
0.8%
Rent to Value Ratio
Active
$599,000
3
bds
|
2
ba
|
1,287
sqft
|
built
1950
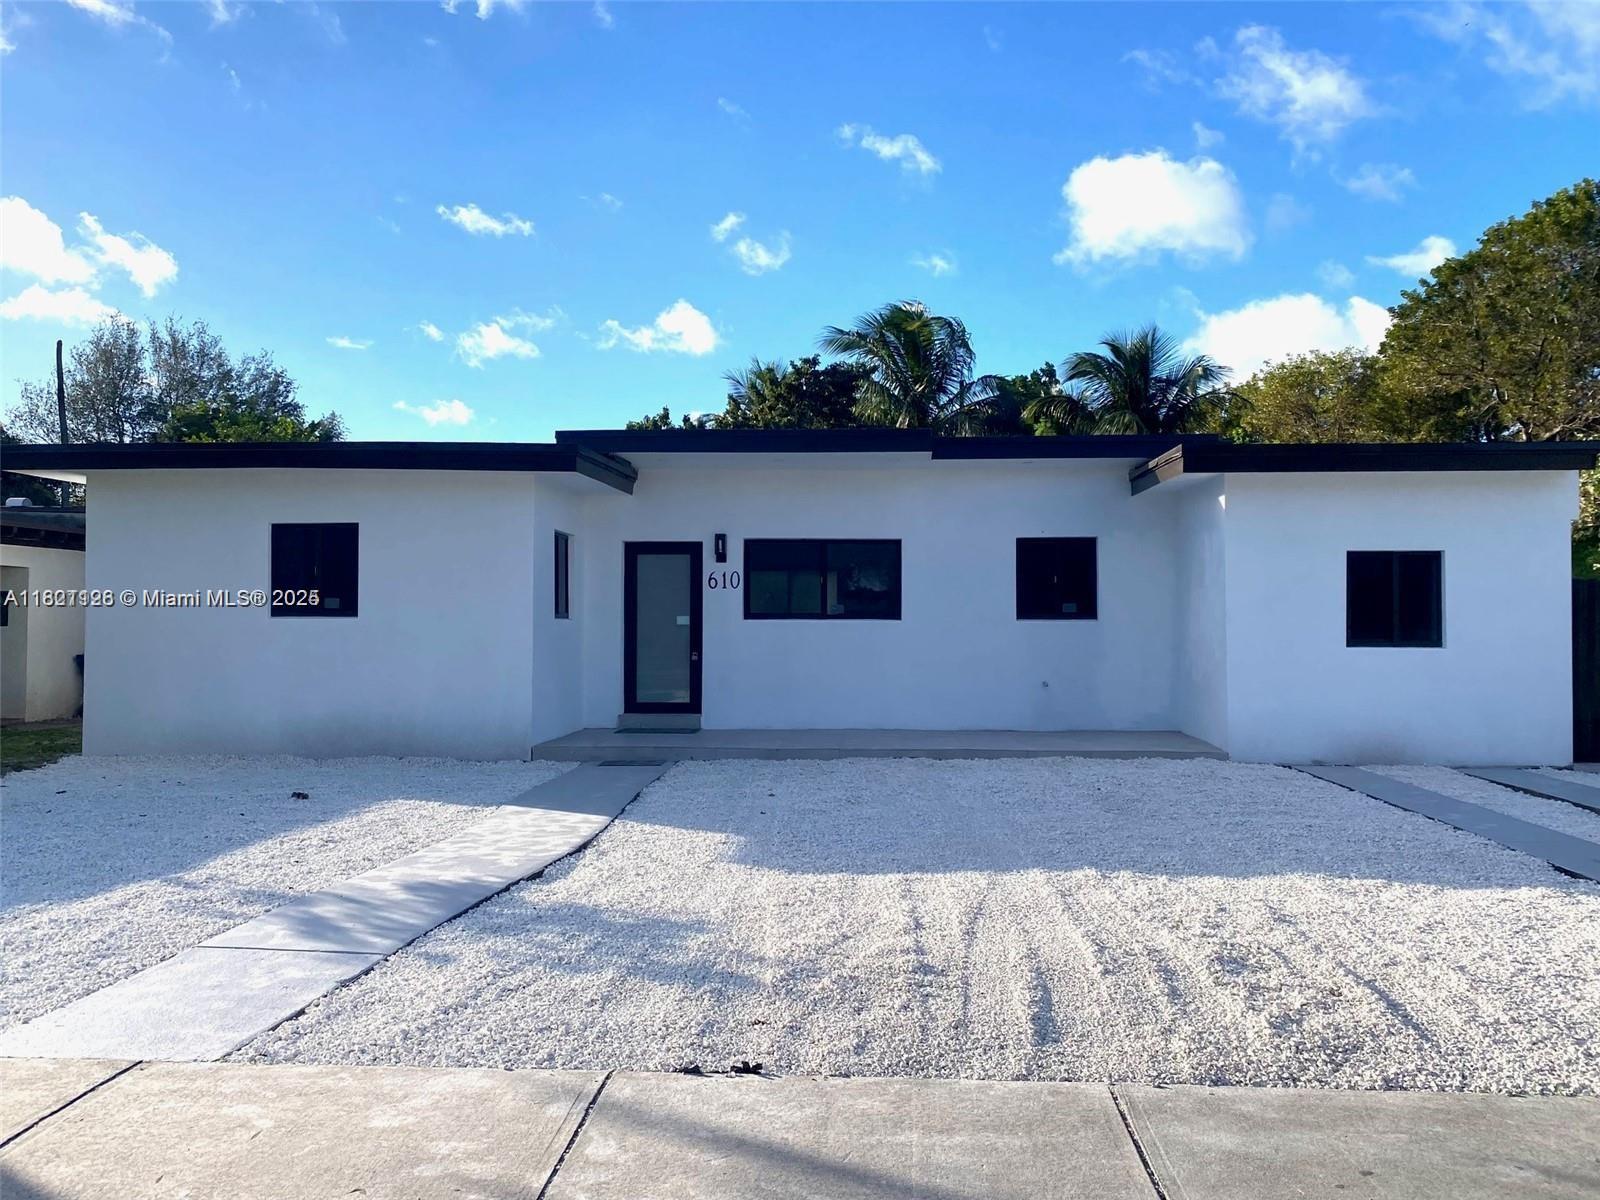
610 NW 111th St, Miami, FL 33168
$-1,700
Cash flow
-14.8%
Cash-on-Cash Return
2.9%
Cap rate
0.5%
Rent to Value Ratio