Miami, FL Investment Properties for Sale
Browse homes for sale and investment properties in Miami, FL. Refine your search by price, property type, or more.
Best cash flowing properties in Miami, FL
Active
$134,900
1
bds
|
2
ba
|
954
sqft
|
built
1967
1400 NE 191st St, Miami, FL 33179
$-114
Cash flow
-4.4%
Cash-on-Cash Return
5.1%
Cap rate
1.3%
Rent to Value Ratio
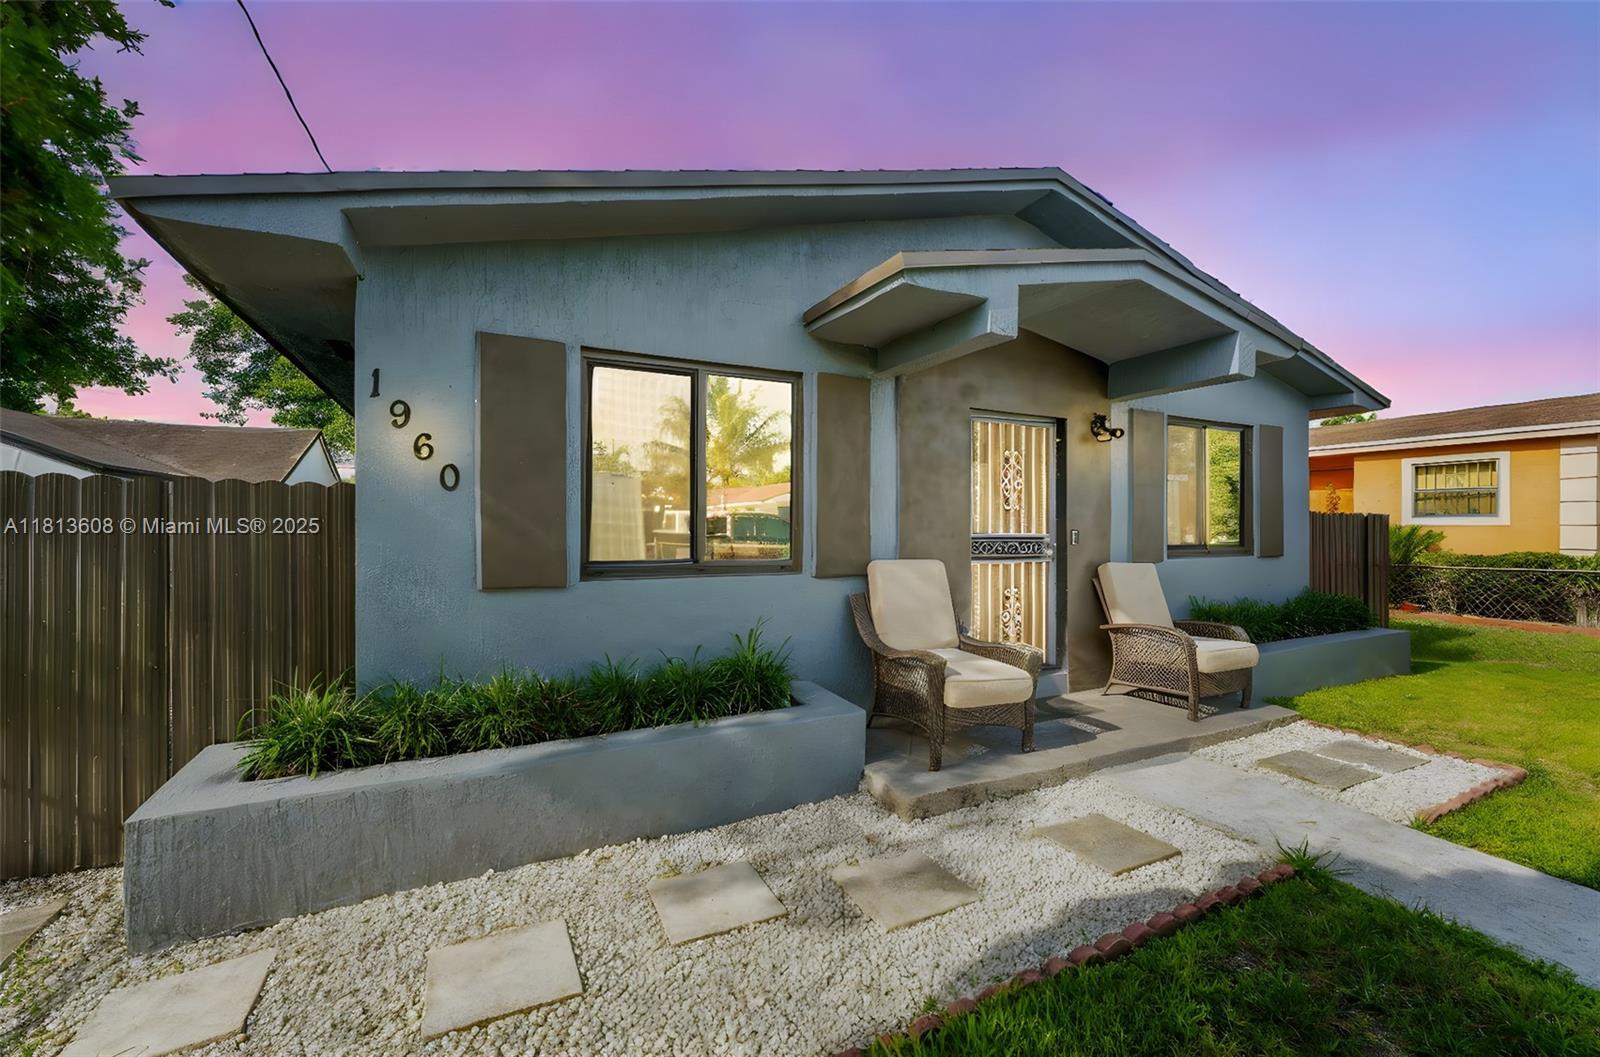
Active
$465,000
3
bds
|
2
ba
|
1,232
sqft
|
built
1965
1960 NW 50th St, Miami, FL 33142
$-328
Cash flow
-3.7%
Cash-on-Cash Return
5.3%
Cap rate
0.8%
Rent to Value Ratio
6,307 out of 7,161 properties for sale in Miami, FL
Limited Results Shown
Create a free account, or log in to reveal all property listings and enjoy the complete experience.
Active
$848,000
5
bds
|
4
ba
|
1,891
sqft
|
built
1957
11020 SW 55th St, Miami, FL 33165
$-2,616
Cash flow
-16.1%
Cash-on-Cash Return
2.4%
Cap rate
0.4%
Rent to Value Ratio

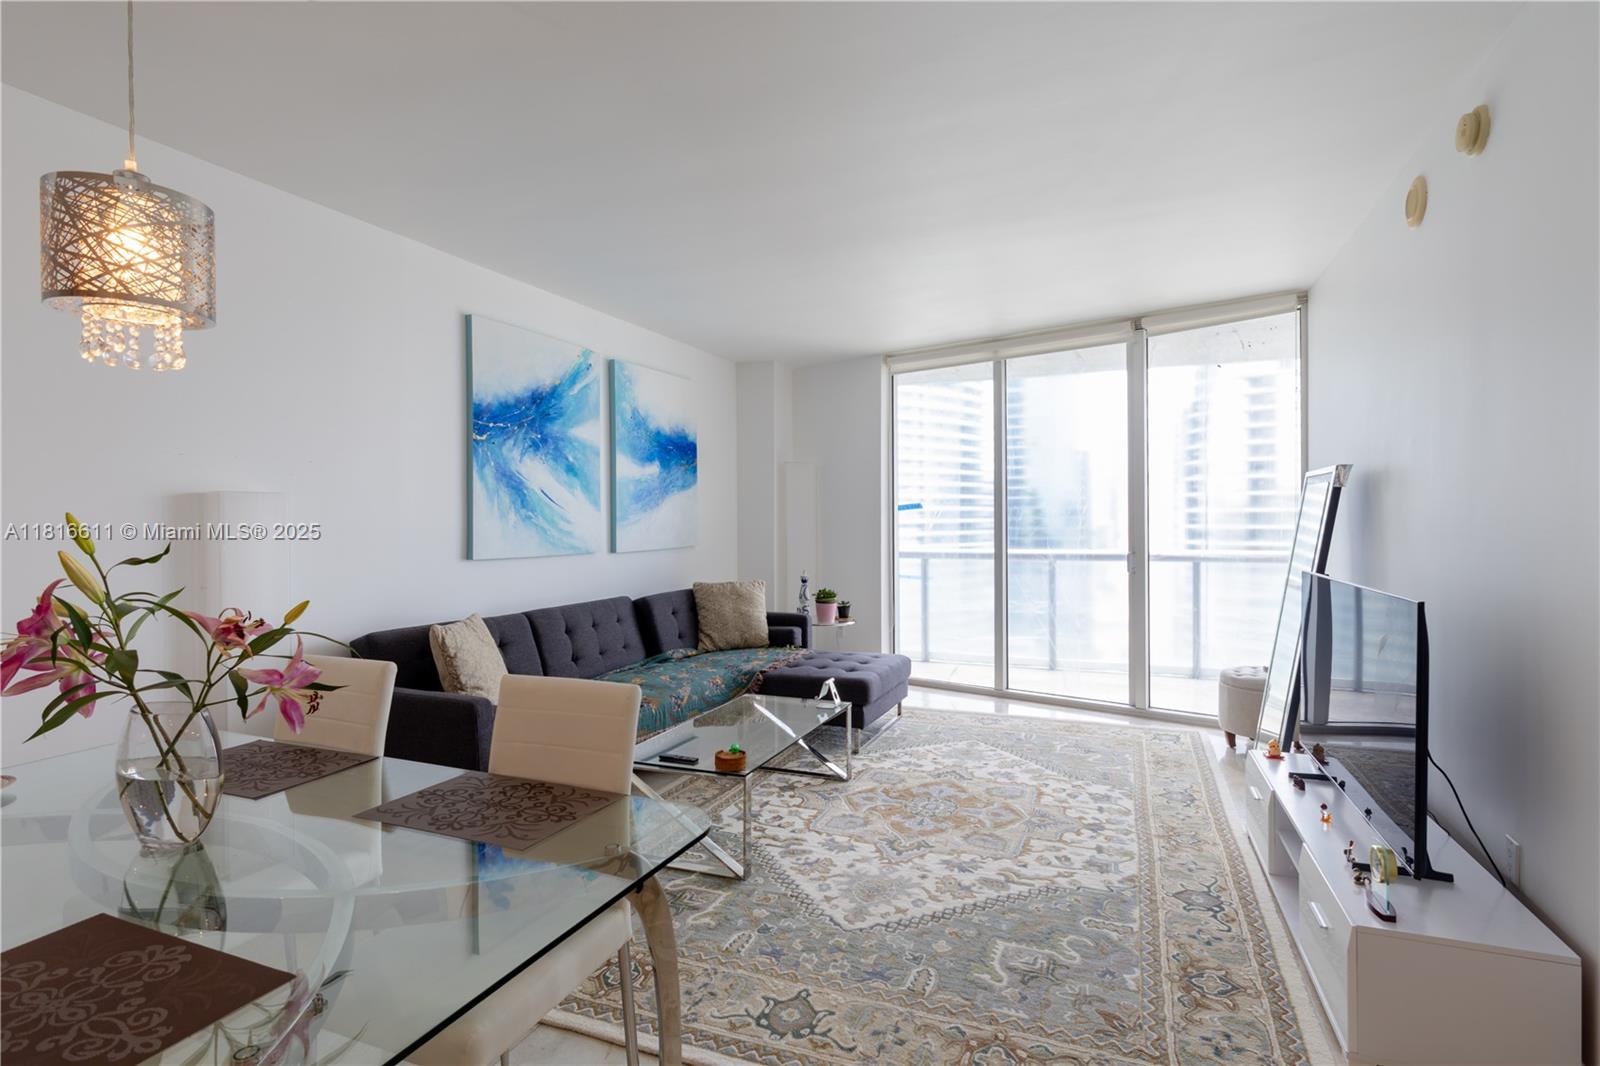
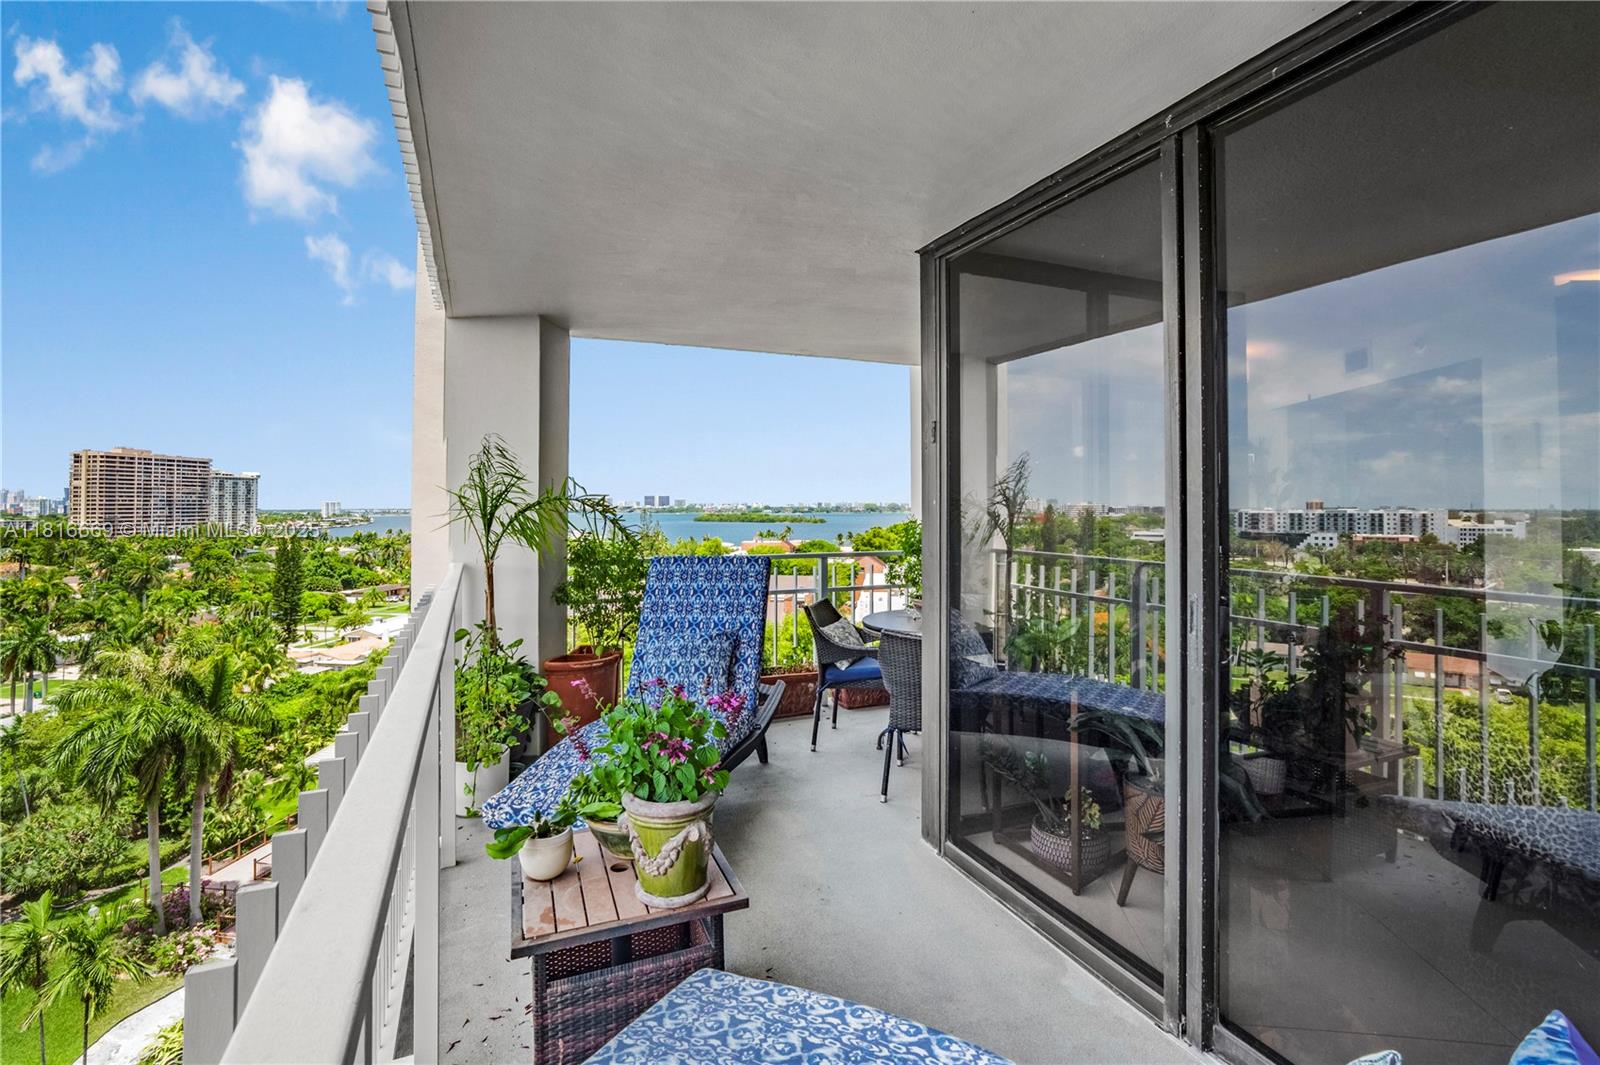
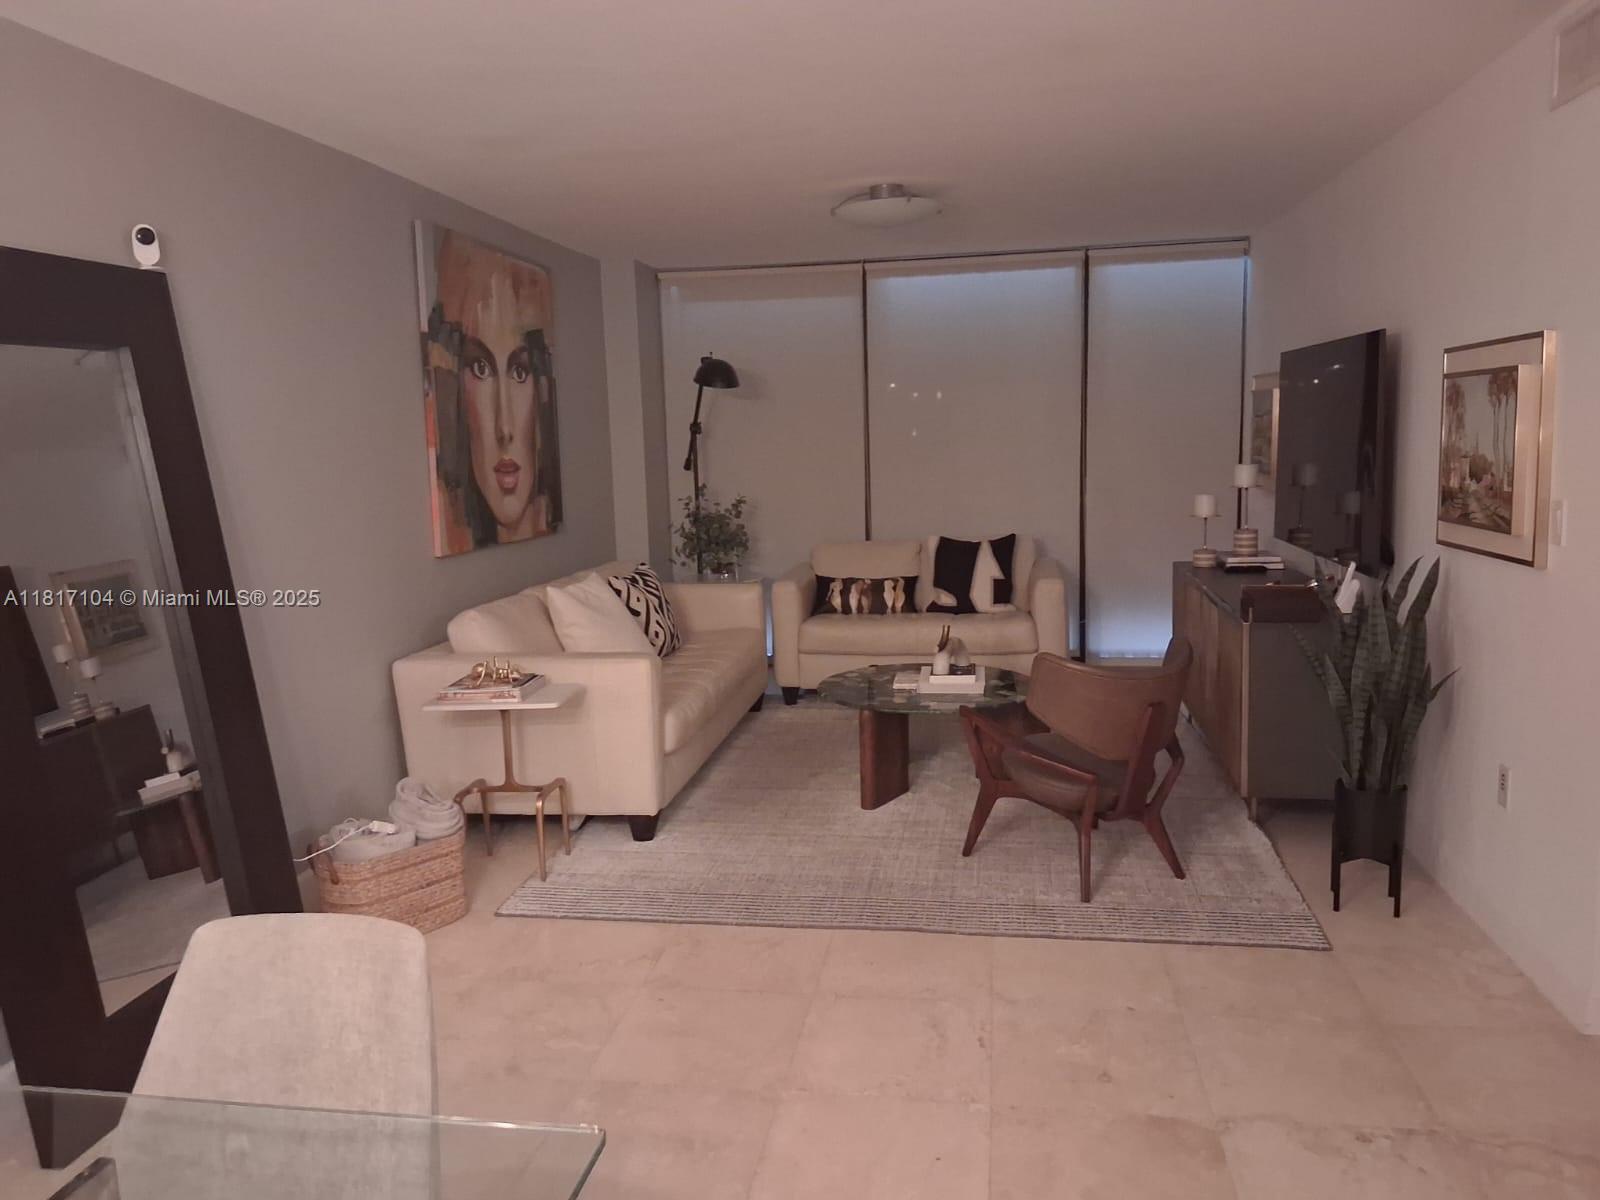
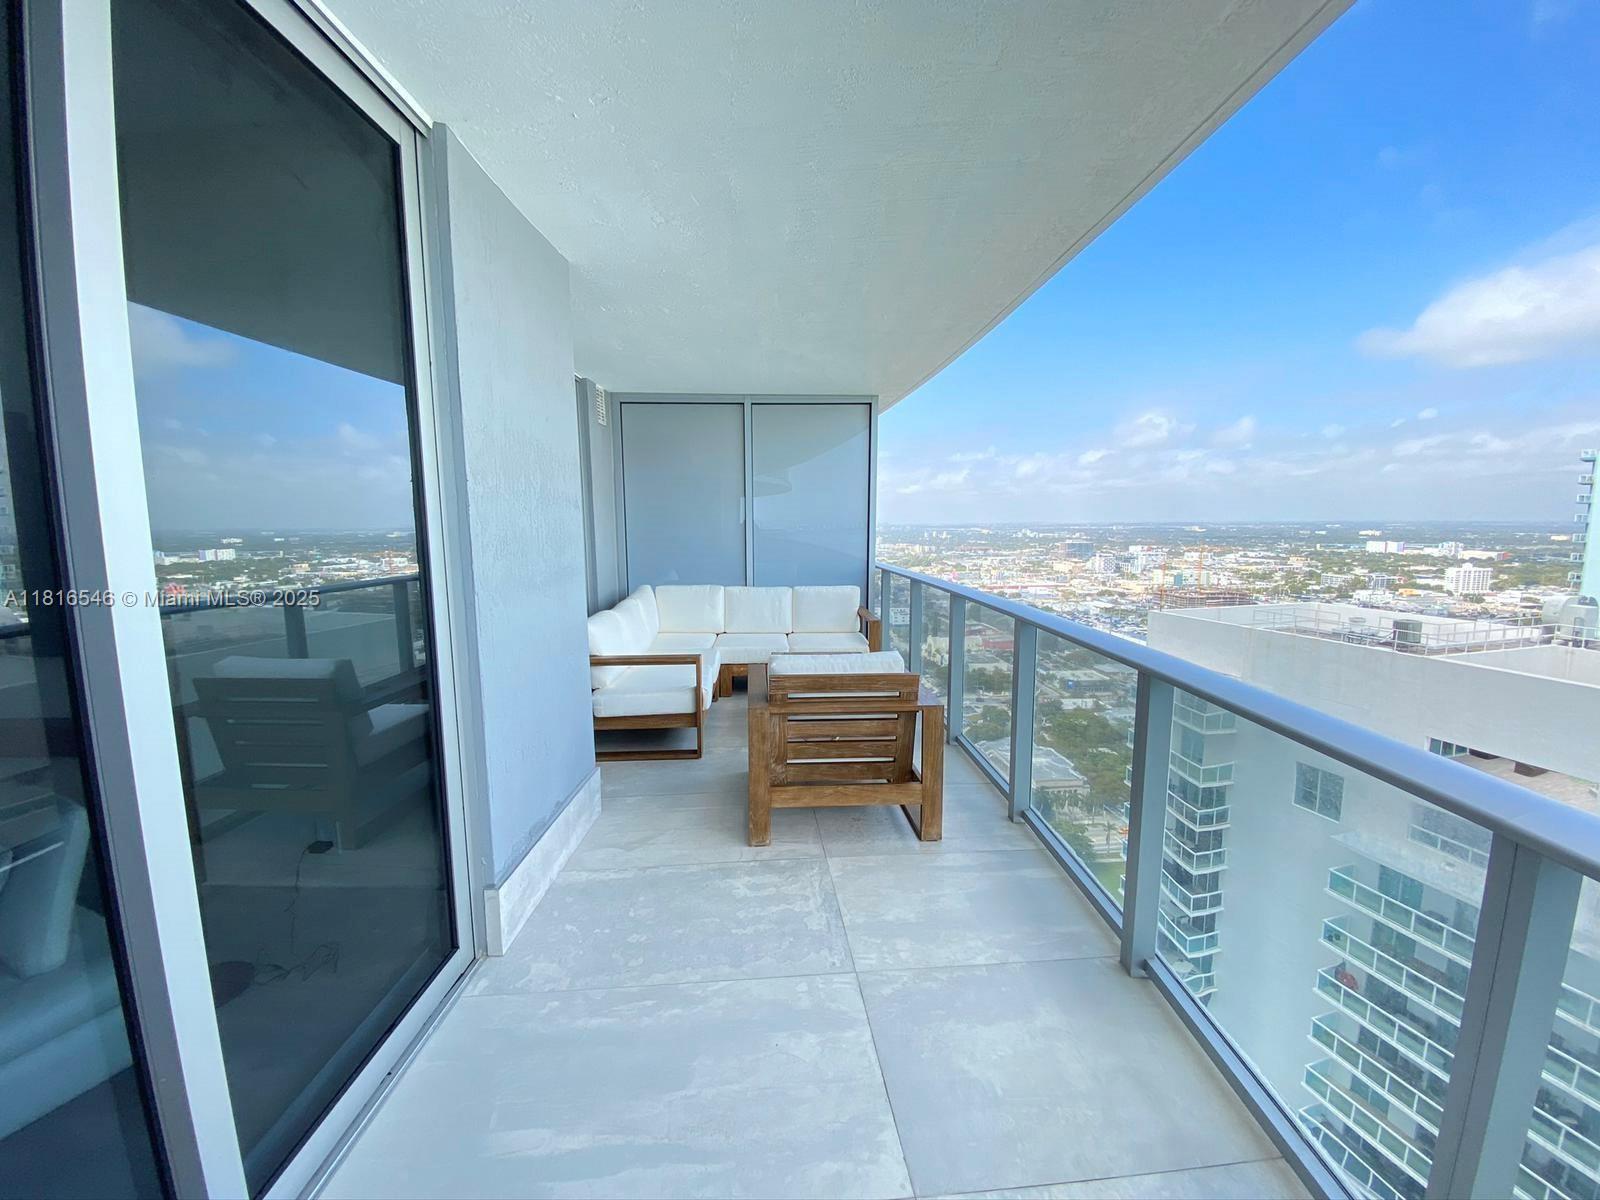
Active
$799,000
1
bds
|
2
ba
|
1,087
sqft
|
built
2001
848 Brickell Key Dr, Miami, FL 33131
$-2,577
Cash flow
-16.8%
Cash-on-Cash Return
2.3%
Cap rate
0.6%
Rent to Value Ratio
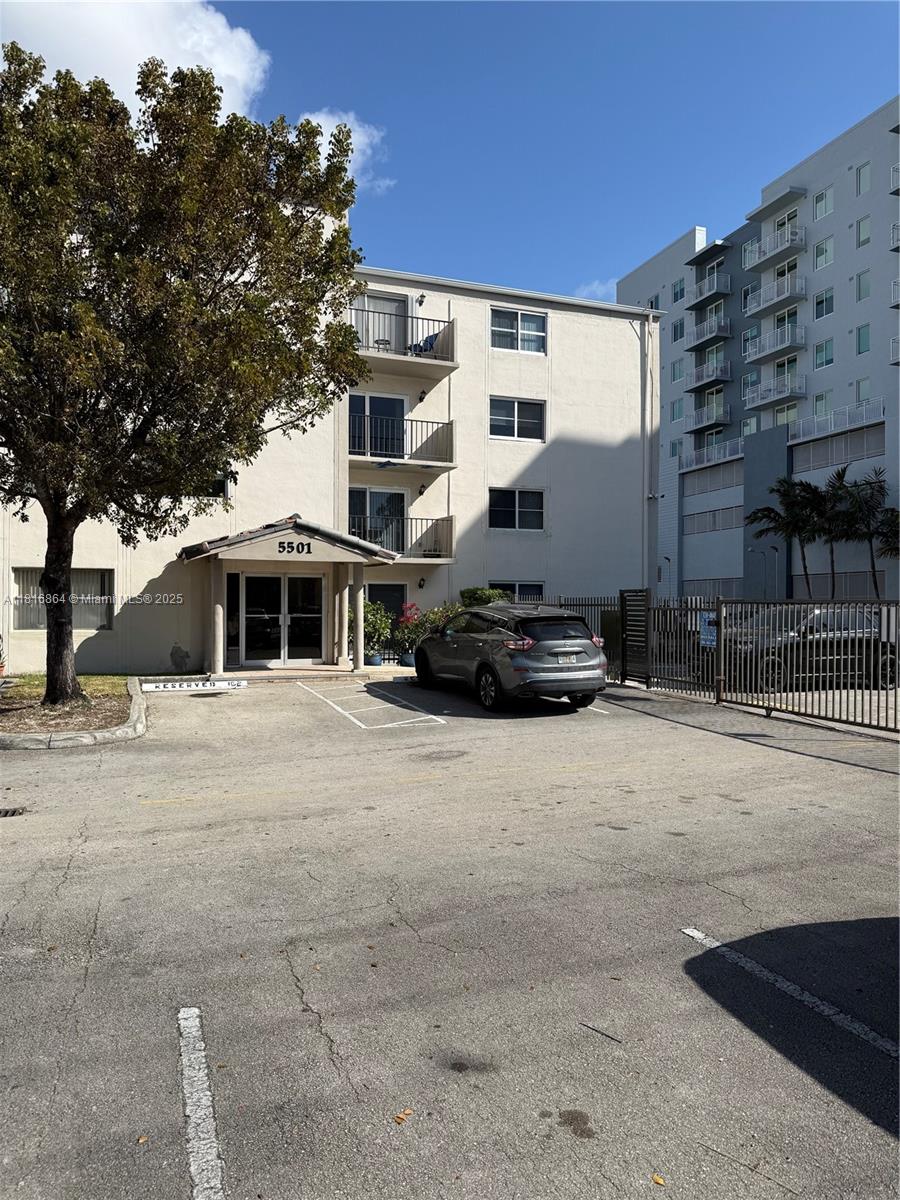
Active
$259,000
2
bds
|
2
ba
|
852
sqft
|
built
1972
5501 NW 7th St, Miami, FL 33126
$-535
Cash flow
-10.8%
Cash-on-Cash Return
3.7%
Cap rate
0.8%
Rent to Value Ratio
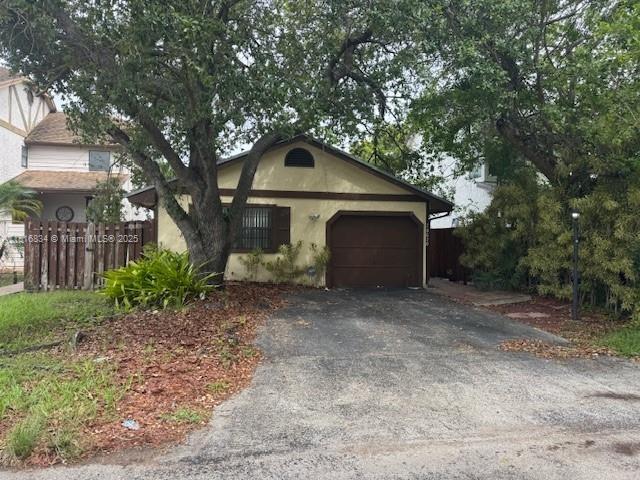
Active
$799,999
4
bds
|
2
ba
|
1,676
sqft
|
built
1980
6710 SW 33rd St, Miami, FL 33155
$-1,193
Cash flow
-7.8%
Cash-on-Cash Return
4.4%
Cap rate
0.6%
Rent to Value Ratio

Active
$699,000
5
bds
|
4
ba
|
1,579
sqft
|
built
1988
14880 SW 56th Ter, Miami, FL 33193
$-2,064
Cash flow
-15.4%
Cash-on-Cash Return
2.6%
Cap rate
0.5%
Rent to Value Ratio
Active
$479,000
3
bds
|
1
ba
|
864
sqft
|
built
1952
2391 NW 132nd St, Miami, FL 33167
$-961
Cash flow
-10.5%
Cash-on-Cash Return
3.7%
Cap rate
0.6%
Rent to Value Ratio
Active
$1,140,000
3
bds
|
2
ba
|
1,470
sqft
|
built
2001
1155 Brickell Bay Dr, Miami, FL 33131
$-2,634
Cash flow
-12.1%
Cash-on-Cash Return
3.4%
Cap rate
0.6%
Rent to Value Ratio
Active
$575,000
3
bds
|
3
ba
|
2,041
sqft
|
built
1994
16054 SW 77th Ter, Miami, FL 33193
$-848
Cash flow
-7.7%
Cash-on-Cash Return
4.4%
Cap rate
0.6%
Rent to Value Ratio
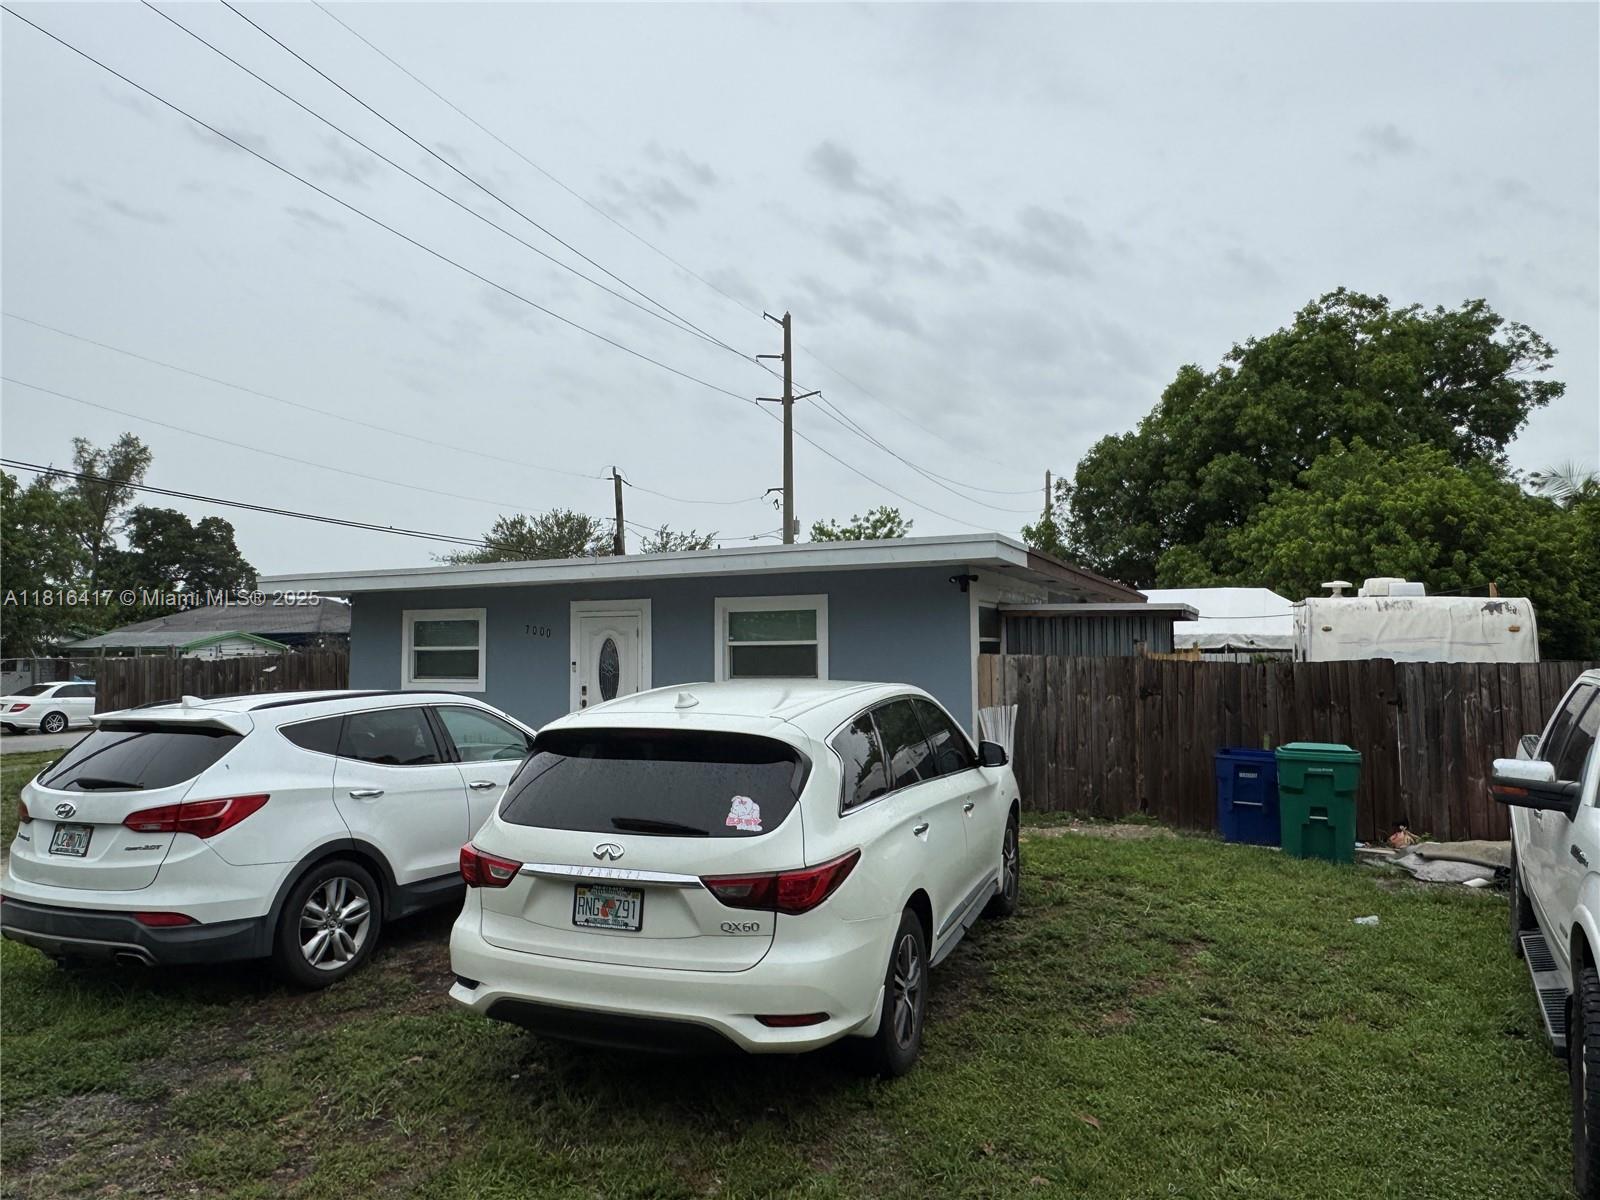
Active
$529,000
4
bds
|
2
ba
|
1,280
sqft
|
built
1959
7000 NW 21st Ave, Miami, FL 33147
$-1,557
Cash flow
-15.4%
Cash-on-Cash Return
2.6%
Cap rate
0.5%
Rent to Value Ratio
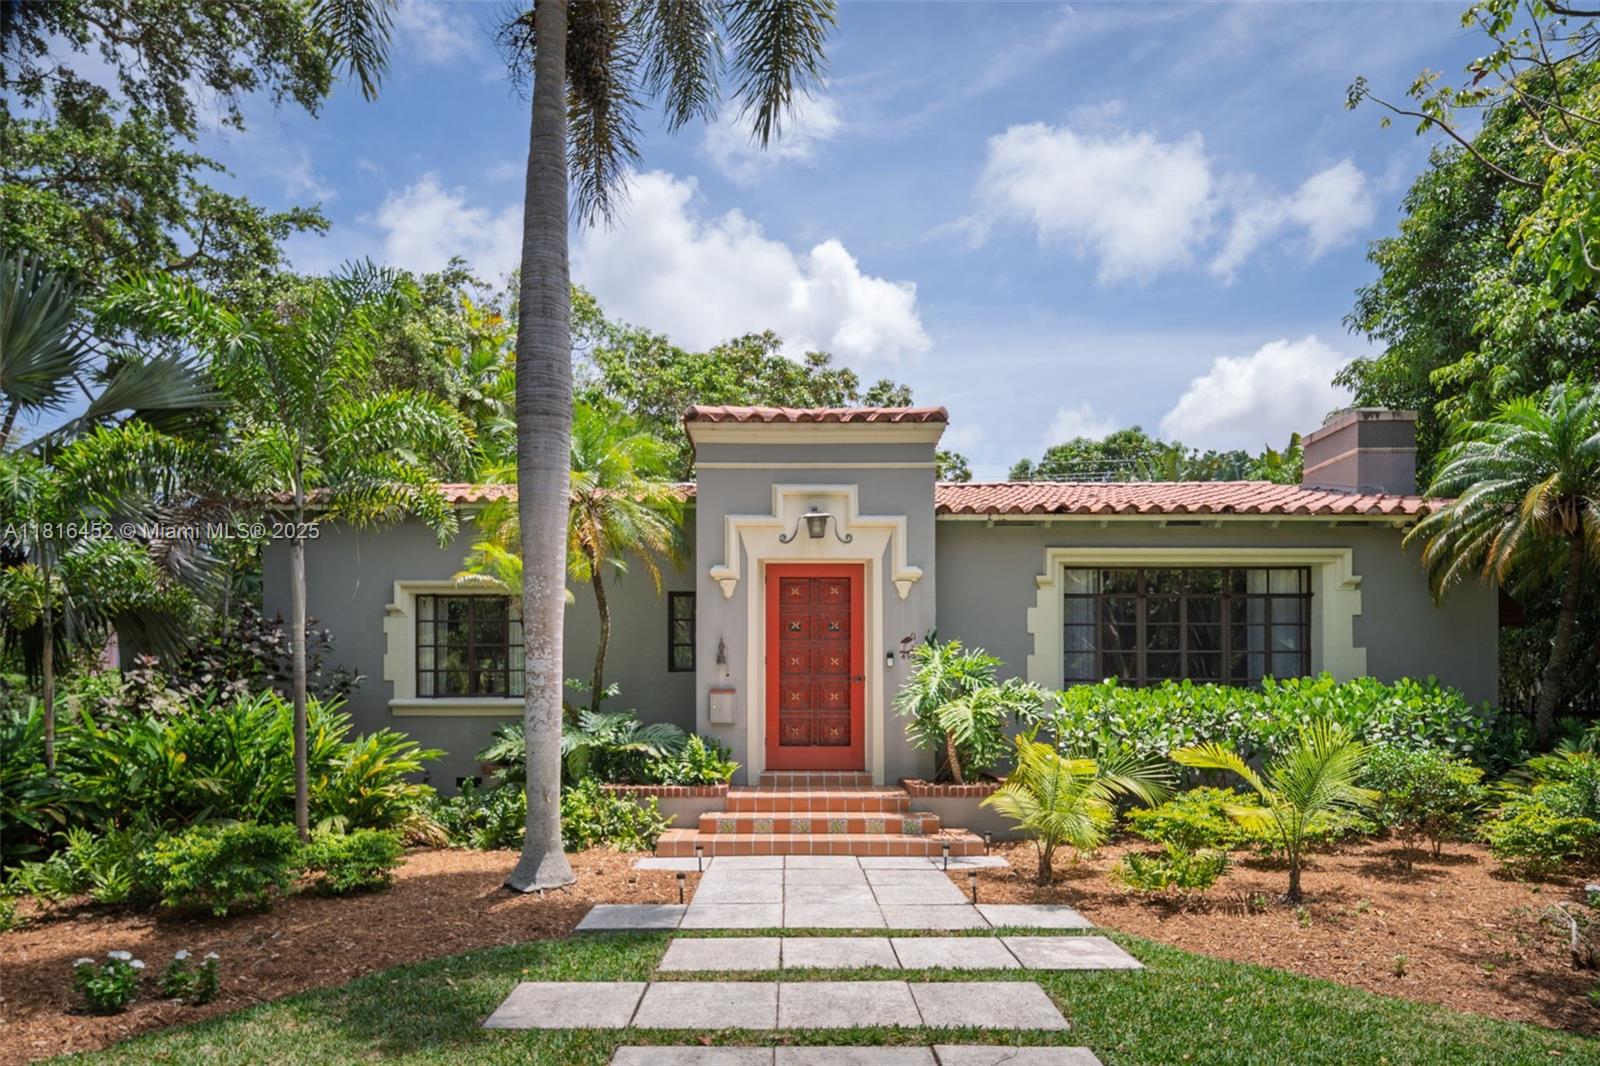
Active
$1,275,000
3
bds
|
3
ba
|
1,572
sqft
|
built
1947
646 NE 83rd St, Miami, FL 33138
$-1,685
Cash flow
-6.9%
Cash-on-Cash Return
4.6%
Cap rate
0.6%
Rent to Value Ratio
Active
$750,000
4
bds
|
2
ba
|
1,884
sqft
|
built
1947
561 NW 53rd St, Miami, FL 33127
$-1,566
Cash flow
-10.9%
Cash-on-Cash Return
3.6%
Cap rate
0.5%
Rent to Value Ratio
Active
$423,000
2
bds
|
2
ba
|
1,223
sqft
|
built
1946
5750 NW 5th Ave, Miami, FL 33127
$-1,413
Cash flow
-17.4%
Cash-on-Cash Return
2.1%
Cap rate
0.4%
Rent to Value Ratio
Active
$865,000
1
bds
|
2
ba
|
959
sqft
|
built
2018
3131 NE 7th Ave, Miami, FL 33137
$-3,055
Cash flow
-18.4%
Cash-on-Cash Return
1.9%
Cap rate
0.6%
Rent to Value Ratio
Active
$465,000
3
bds
|
2
ba
|
1,232
sqft
|
built
1965
1960 NW 50th St, Miami, FL 33142
$-328
Cash flow
-3.7%
Cash-on-Cash Return
5.3%
Cap rate
0.8%
Rent to Value Ratio

Active
$850,000
3
bds
|
2
ba
|
1,408
sqft
|
built
1964
3905 SW 125th Ave, Miami, FL 33175
$-2,162
Cash flow
-13.3%
Cash-on-Cash Return
3.1%
Cap rate
0.5%
Rent to Value Ratio

Active
$440,000
2
bds
|
3
ba
|
1,000
sqft
|
built
1985
4560 SW 68th Court Cir, Miami, FL 33155
$-1,091
Cash flow
-12.9%
Cash-on-Cash Return
3.2%
Cap rate
0.6%
Rent to Value Ratio
Active
$134,900
1
bds
|
2
ba
|
954
sqft
|
built
1967
1400 NE 191st St, Miami, FL 33179
$-114
Cash flow
-4.4%
Cash-on-Cash Return
5.1%
Cap rate
1.3%
Rent to Value Ratio
Active
$325,000
3
bds
|
2
ba
|
1,209
sqft
|
built
1974
14611 SW 88th St, Miami, FL 33186
$-737
Cash flow
-11.8%
Cash-on-Cash Return
3.4%
Cap rate
0.8%
Rent to Value Ratio
Active
$1,325,000
4
bds
|
3
ba
|
2,058
sqft
|
built
2003
9339 SW 98th Pl, Miami, FL 33176
$-4,070
Cash flow
-16.0%
Cash-on-Cash Return
2.5%
Cap rate
0.4%
Rent to Value Ratio
Active
$3,340,000
4
bds
|
5
ba
|
3,336
sqft
|
built
2018
650 NE 32nd St, Miami, FL 33137
$-18,227
Cash flow
-28.5%
Cash-on-Cash Return
-0.4%
Cap rate
0.3%
Rent to Value Ratio

Active
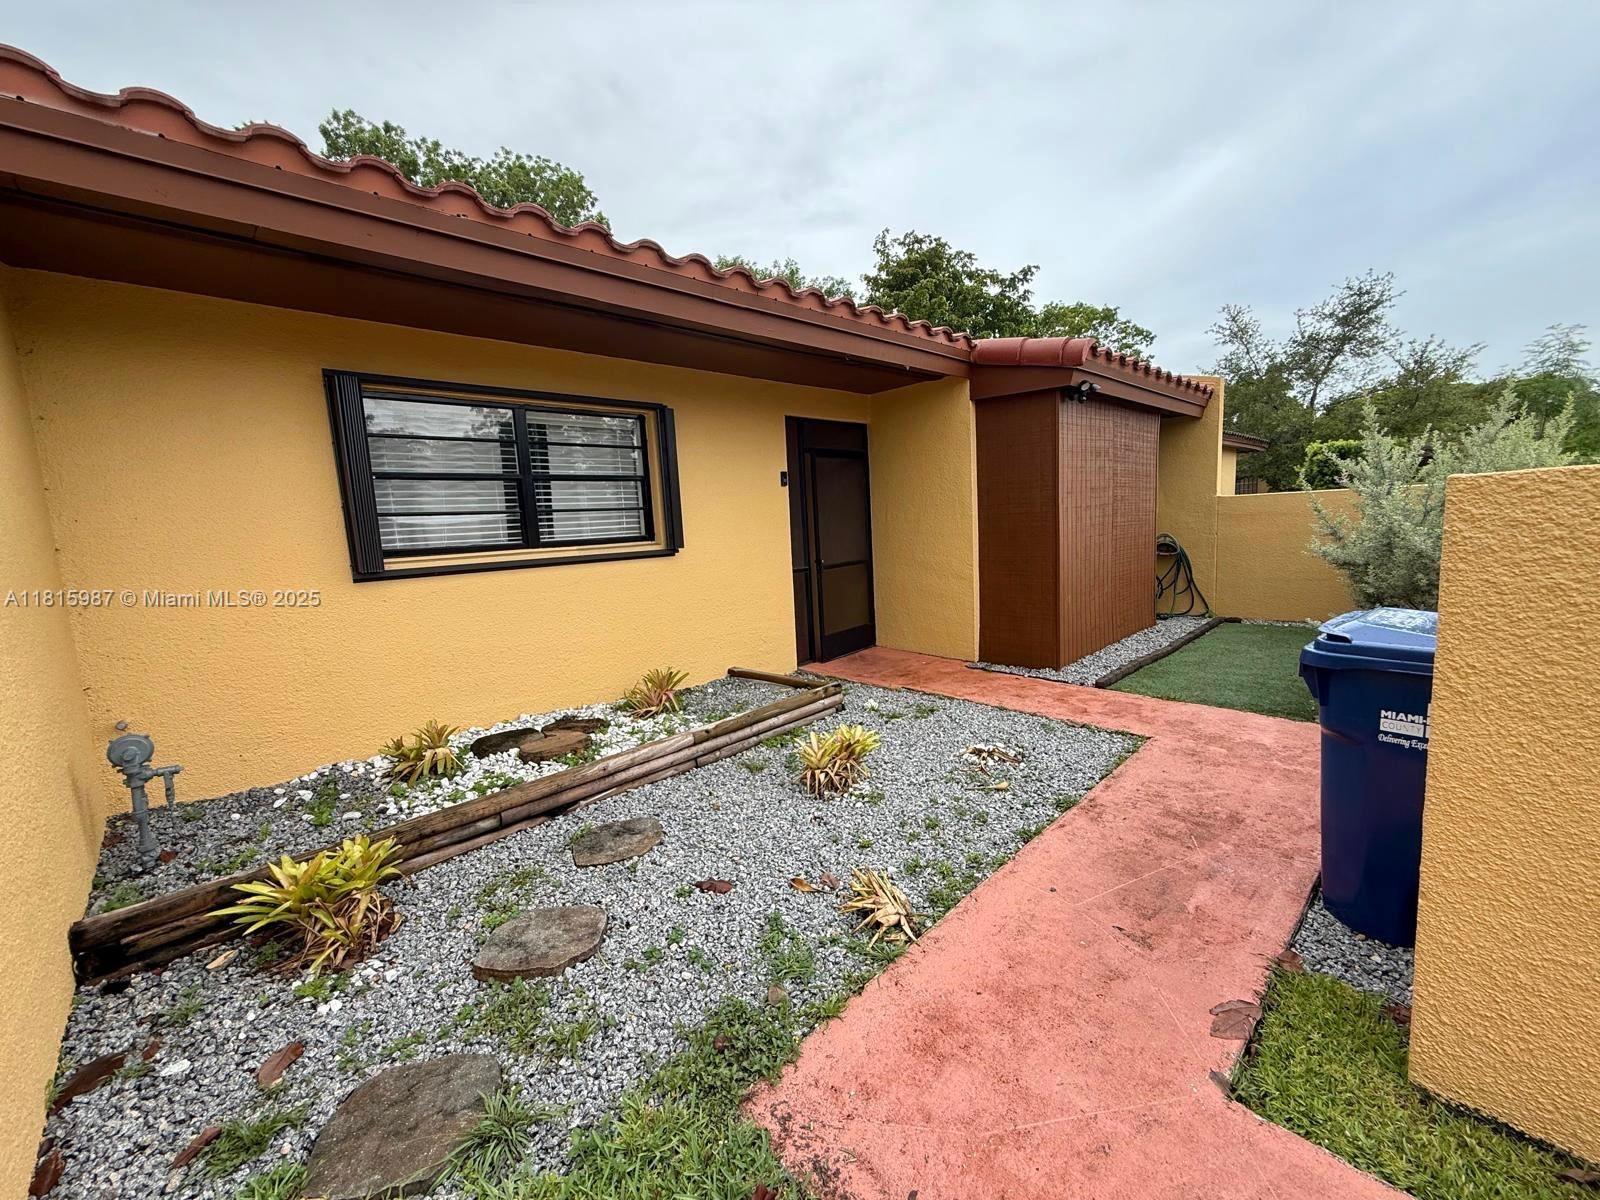
$550,000
3
bds
|
2
ba
|
1,301
sqft
|
built
1991
11830 SW 208th Ter, Miami, FL 33177
$-1,129
Cash flow
-10.7%
Cash-on-Cash Return
3.7%
Cap rate
0.6%
Rent to Value Ratio
Active
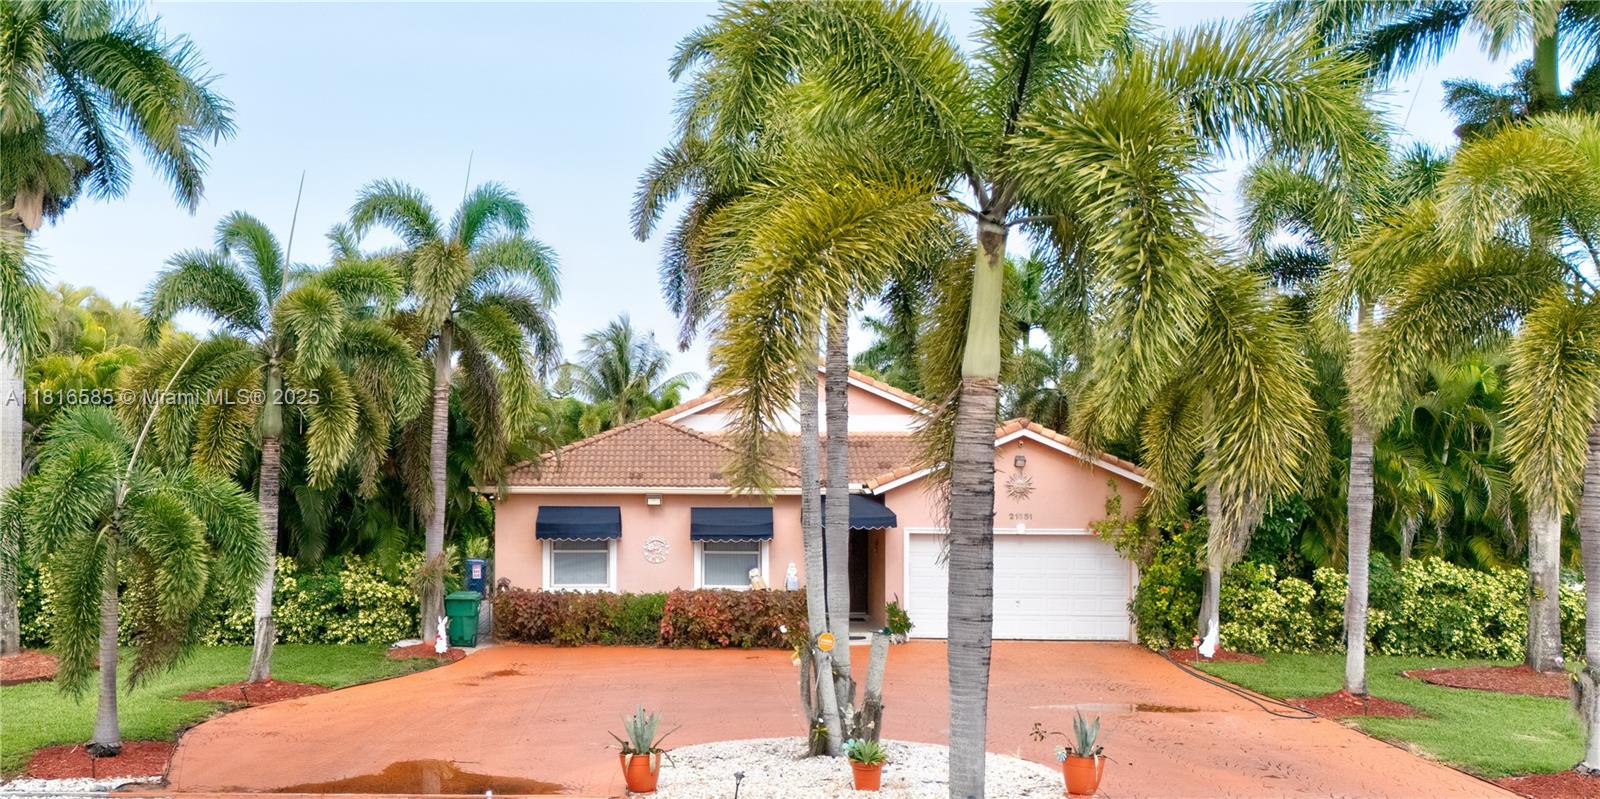
$995,000
4
bds
|
2
ba
|
1,834
sqft
|
built
2002
21551 SW 187th Ave, Miami, FL 33187
$-2,659
Cash flow
-13.9%
Cash-on-Cash Return
2.9%
Cap rate
0.4%
Rent to Value Ratio
Pending
$430,000
3
bds
|
2
ba
|
1,224
sqft
|
built
1975
14734 SW 87th Ter, Miami, FL 33193
$-788
Cash flow
-9.6%
Cash-on-Cash Return
3.9%
Cap rate
0.7%
Rent to Value Ratio

Active
$745,000
4
bds
|
0
ba
|
1,686
sqft
|
built
1955
1226 NE 112th St, Miami, FL 33161
$-3,052
Cash flow
-21.4%
Cash-on-Cash Return
1.2%
Cap rate
0.3%
Rent to Value Ratio
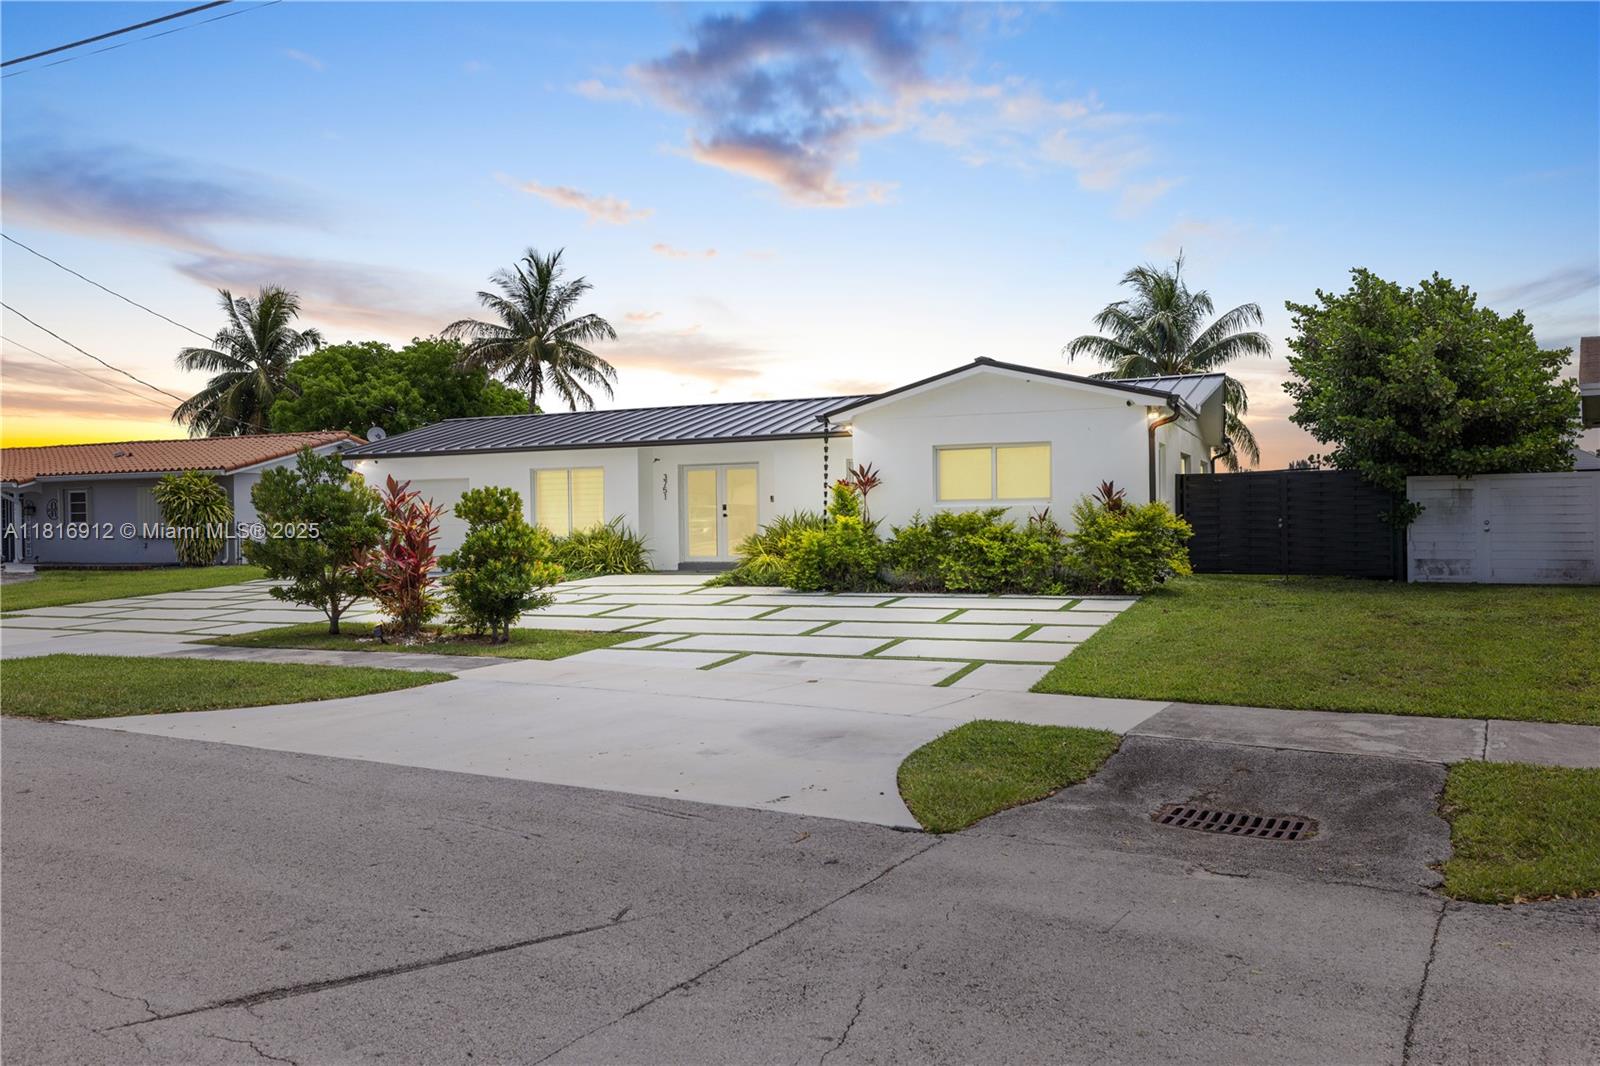
Active
$775,000
4
bds
|
3
ba
|
1,340
sqft
|
built
1965
3751 SW 124th Ct, Miami, FL 33175
$-2,346
Cash flow
-15.8%
Cash-on-Cash Return
2.5%
Cap rate
0.5%
Rent to Value Ratio
Active
$625,000
1
bds
|
1
ba
|
816
sqft
|
built
2008
475 Brickell Ave, Miami, FL 33131
$-2,678
Cash flow
-22.4%
Cash-on-Cash Return
1.0%
Cap rate
0.5%
Rent to Value Ratio
Active
$445,000
2
bds
|
2
ba
|
1,535
sqft
|
built
1981
1000 Quayside Ter, Miami, FL 33138
$-2,544
Cash flow
-29.8%
Cash-on-Cash Return
-0.7%
Cap rate
0.8%
Rent to Value Ratio
Active
$560,000
1
bds
|
2
ba
|
1,030
sqft
|
built
1977
1450 Brickell Bay Dr, Miami, FL 33131
$-1,871
Cash flow
-17.4%
Cash-on-Cash Return
2.1%
Cap rate
0.7%
Rent to Value Ratio
Active
$495,000
4
bds
|
2
ba
|
1,414
sqft
|
built
1981
10626 SW 148th Avenue Dr, Miami, FL 33196
$-952
Cash flow
-10.0%
Cash-on-Cash Return
3.8%
Cap rate
0.6%
Rent to Value Ratio
Active
$1,995,000
3
bds
|
3
ba
|
1,932
sqft
|
built
1938
492 NE 55th St, Miami, FL 33137
$-3,813
Cash flow
-10.0%
Cash-on-Cash Return
3.9%
Cap rate
0.5%
Rent to Value Ratio
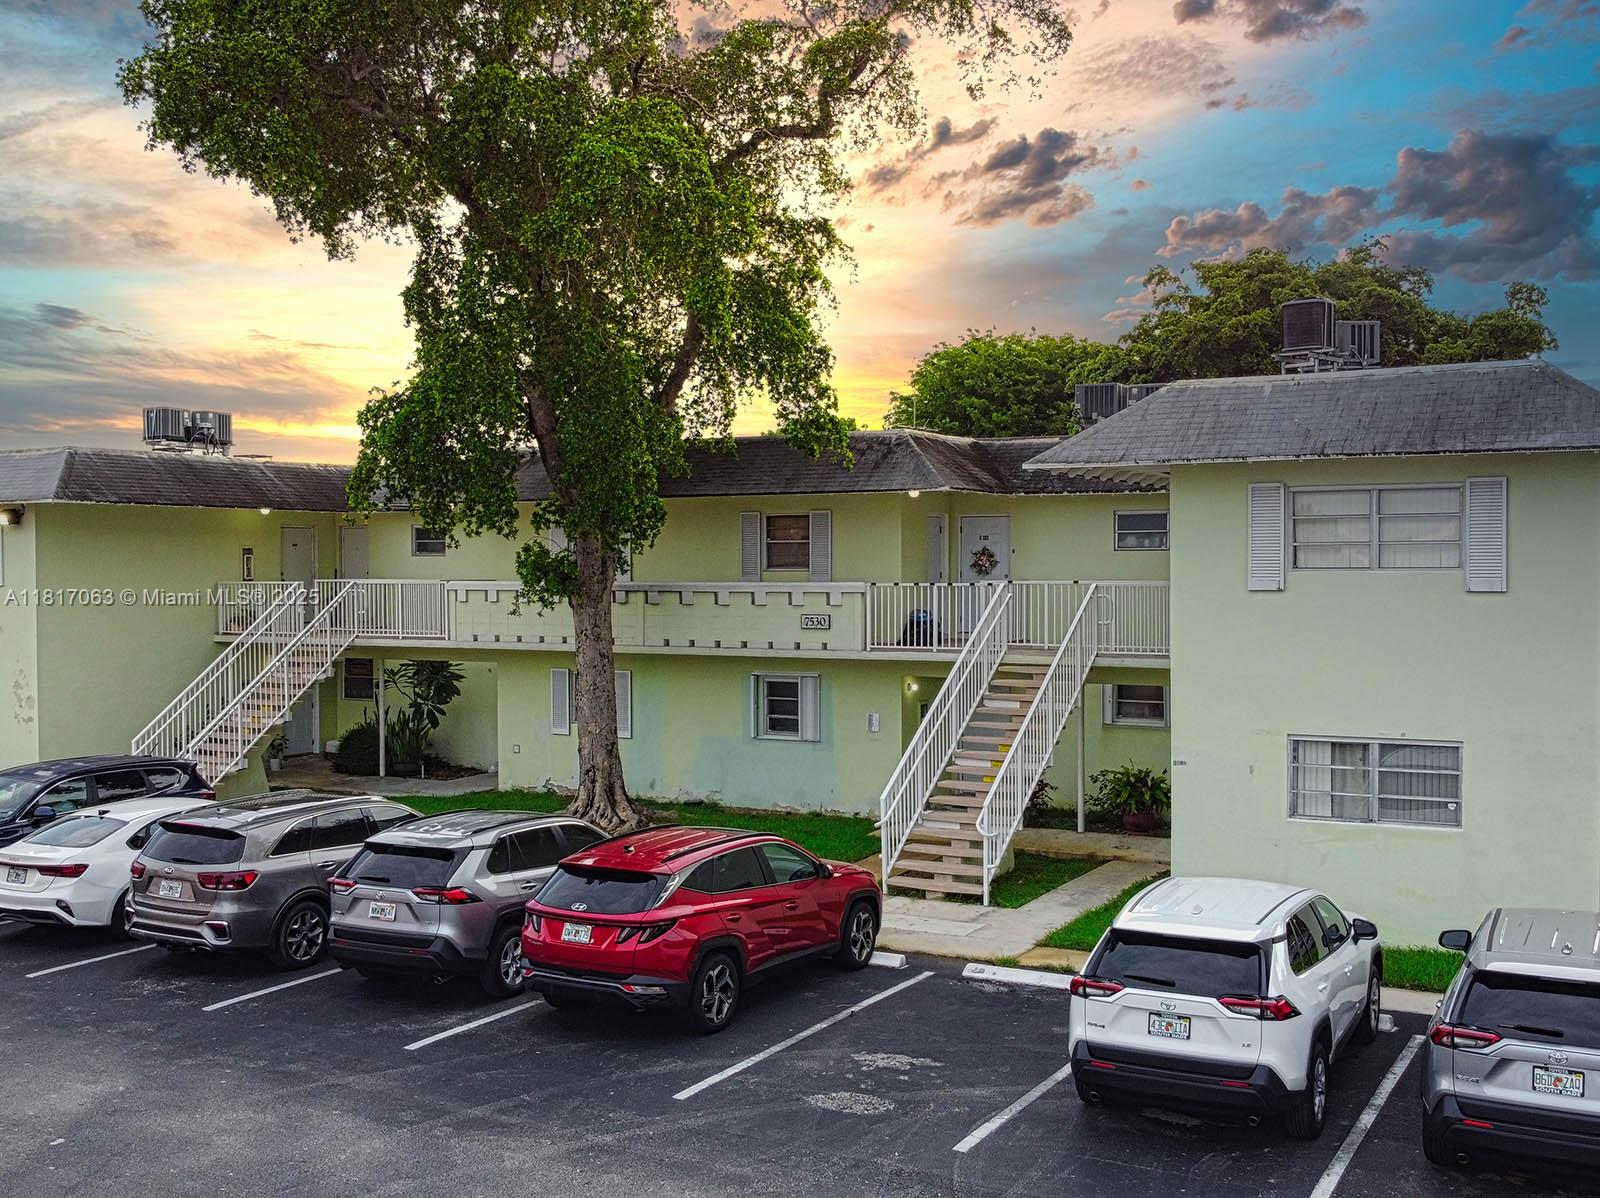
Active
$195,000
1
bds
|
1
ba
|
700
sqft
|
built
1968
7530 SW 82nd St, Miami, FL 33143
$-356
Cash flow
-9.5%
Cash-on-Cash Return
4.0%
Cap rate
0.9%
Rent to Value Ratio
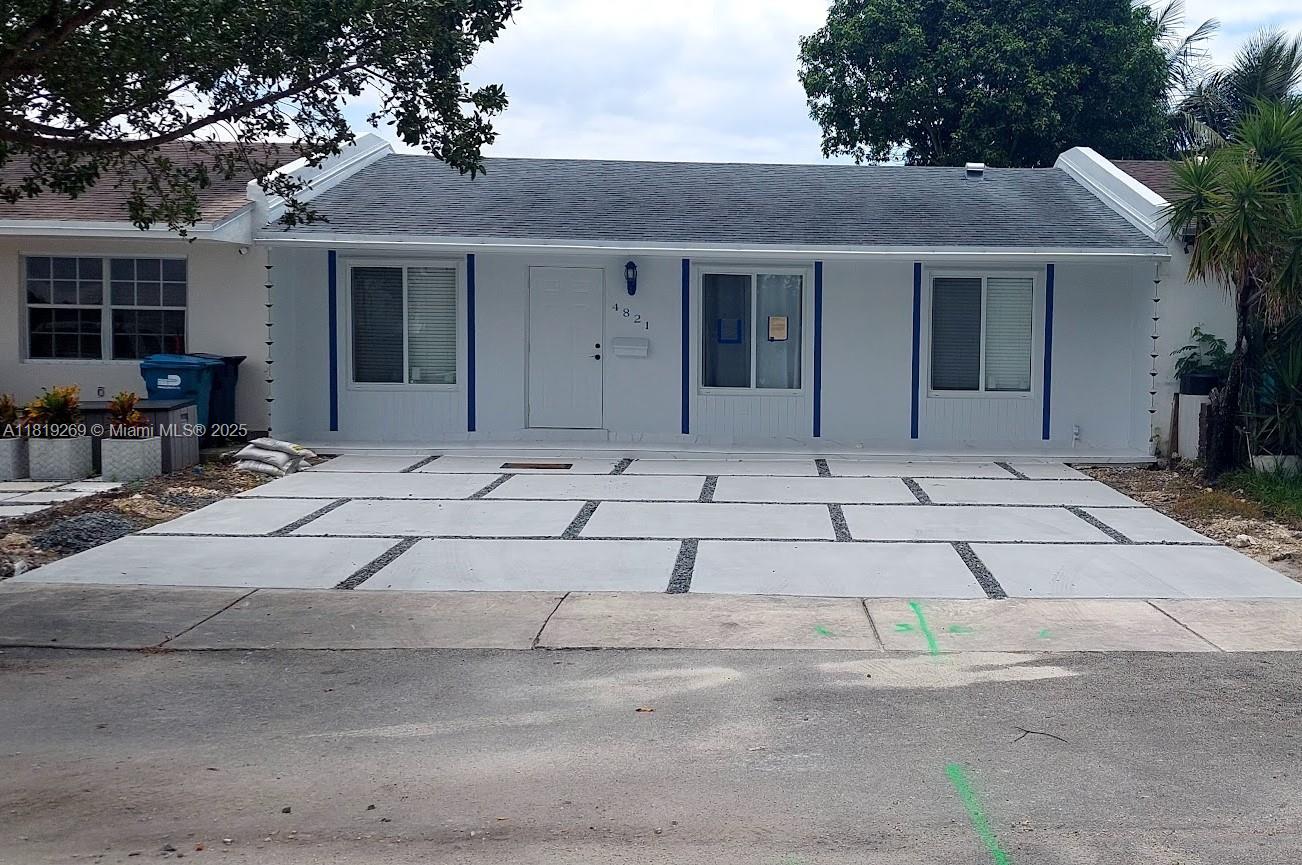
Active
$675,000
3
bds
|
1
ba
|
1,015
sqft
|
built
1971
4821 SW 129th Ave, Miami, FL 33175
$-1,685
Cash flow
-13.0%
Cash-on-Cash Return
3.2%
Cap rate
0.5%
Rent to Value Ratio
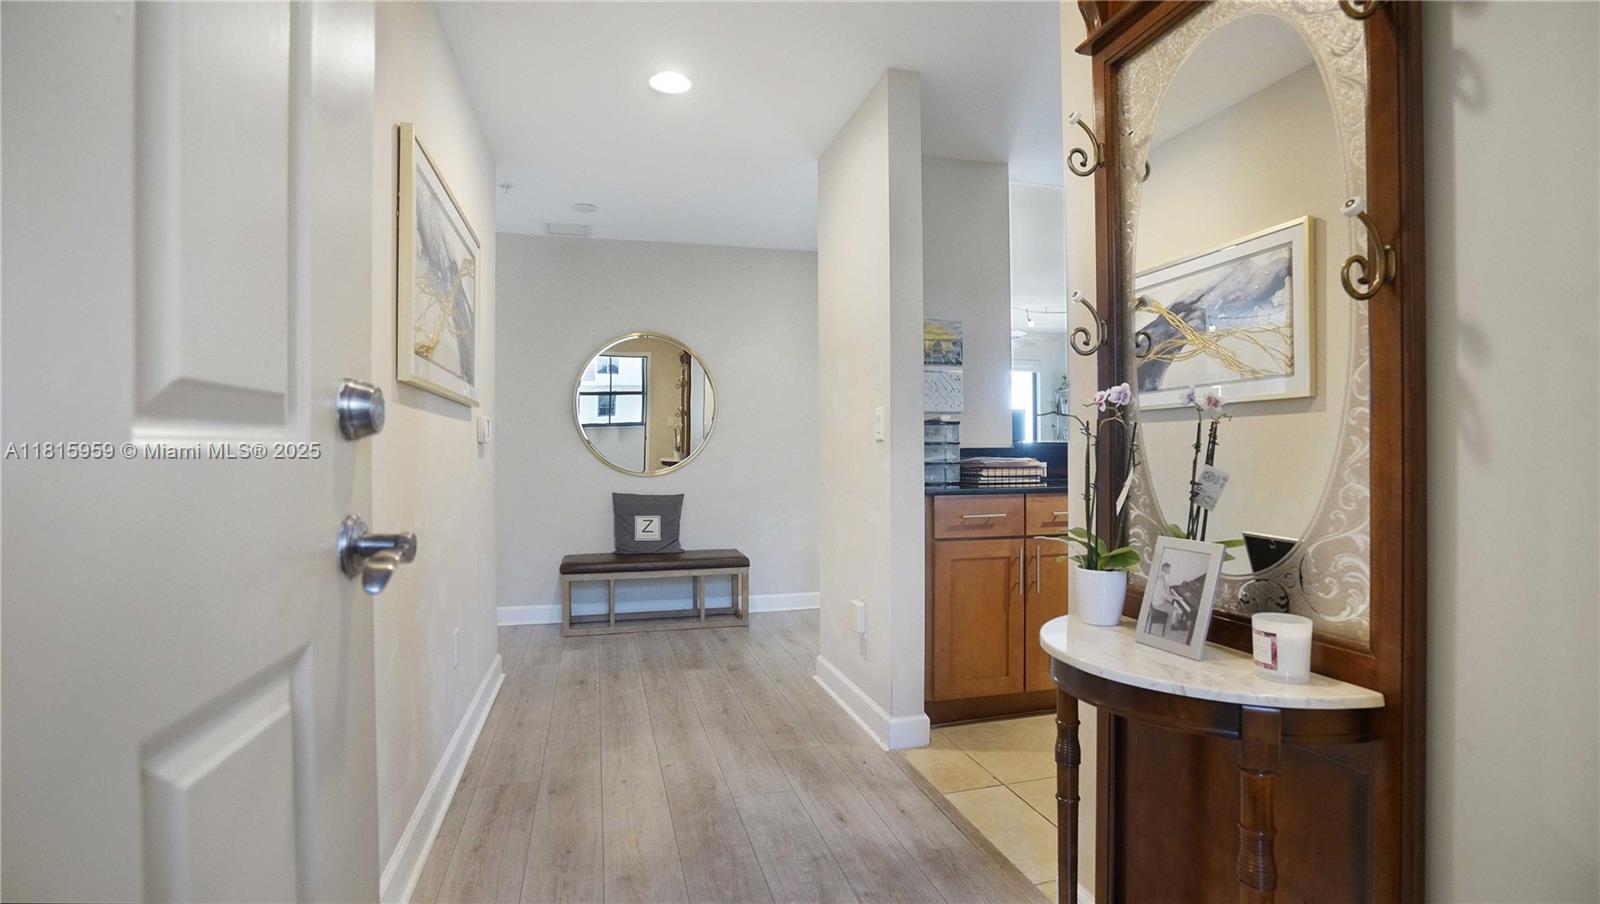
Active
$505,000
2
bds
|
2
ba
|
1,352
sqft
|
built
2007
8390 SW 72nd Ave, Miami, FL 33143
$-843
Cash flow
-8.7%
Cash-on-Cash Return
4.1%
Cap rate
0.7%
Rent to Value Ratio
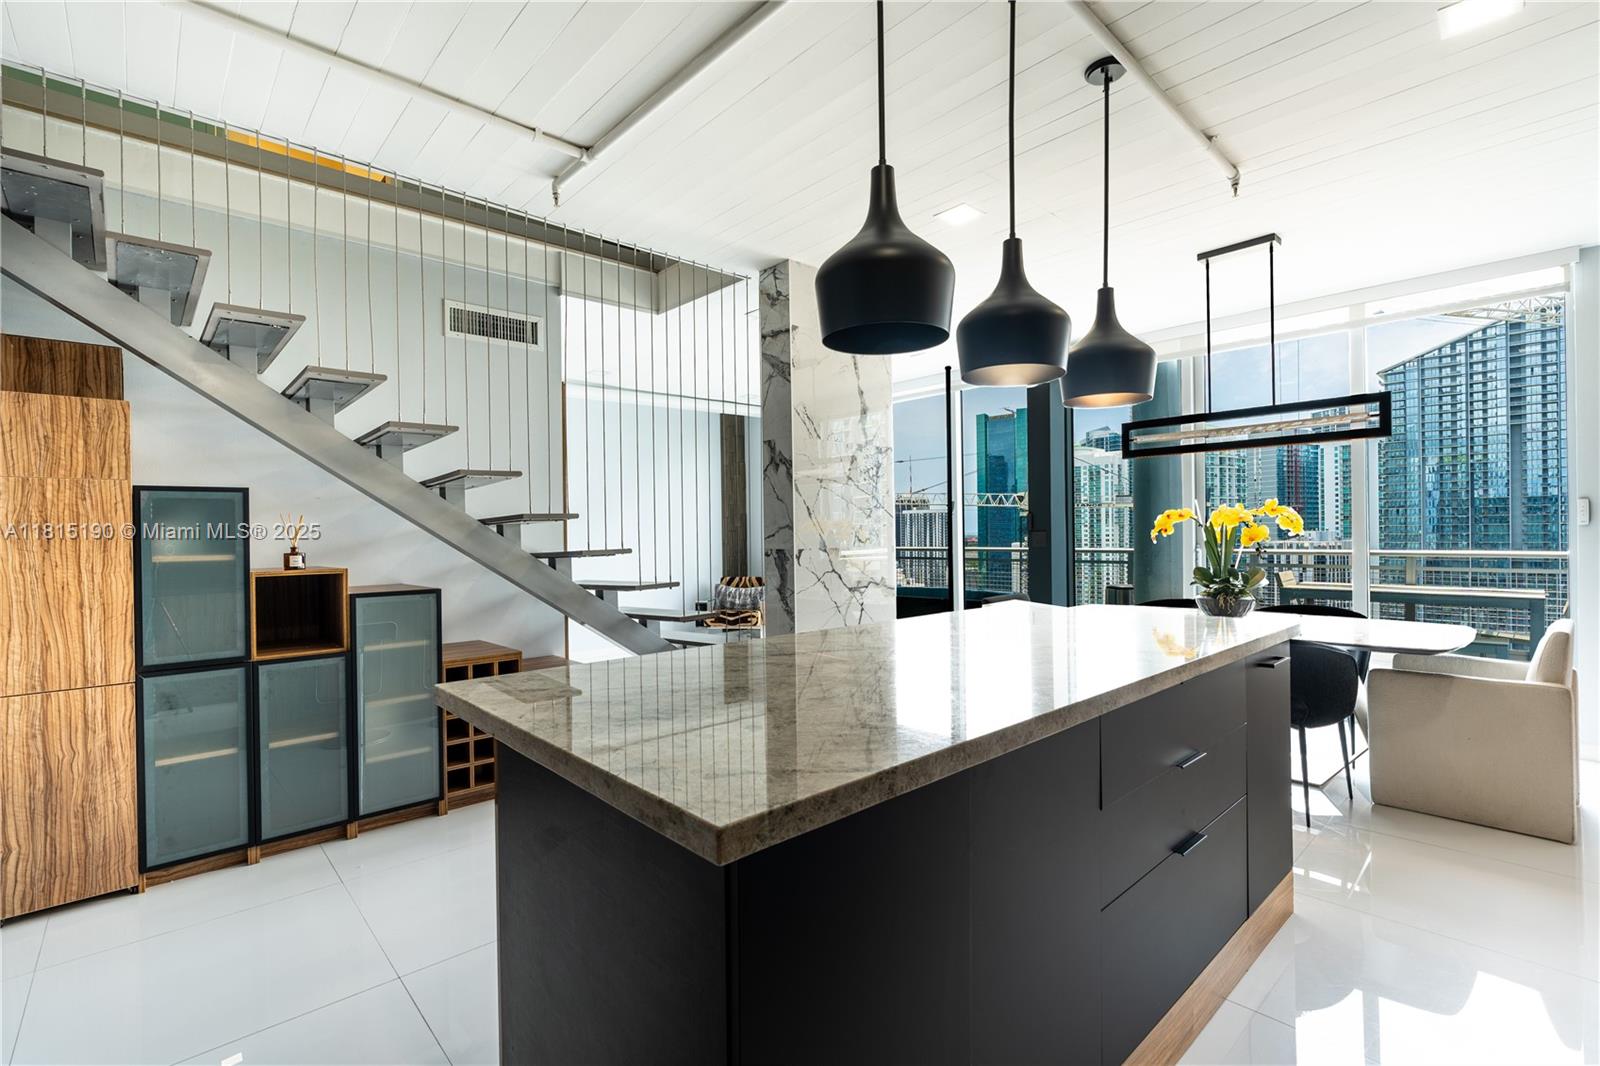
Active
$719,000
2
bds
|
2
ba
|
1,255
sqft
|
built
2006
690 SW 1st Ct, Miami, FL 33130
$-3,142
Cash flow
-22.8%
Cash-on-Cash Return
0.9%
Cap rate
0.6%
Rent to Value Ratio
Active
$980,000
2
bds
|
3
ba
|
1,161
sqft
|
built
2018
488 NE 18th St, Miami, FL 33132
$-3,234
Cash flow
-17.2%
Cash-on-Cash Return
2.2%
Cap rate
0.6%
Rent to Value Ratio
Active
$650,000
2
bds
|
2
ba
|
1,267
sqft
|
built
2006
41 SE 5th St, Miami, FL 33131
$-2,250
Cash flow
-18.1%
Cash-on-Cash Return
2.0%
Cap rate
0.7%
Rent to Value Ratio
Active
$630,000
3
bds
|
4
ba
|
1,370
sqft
|
built
2006
3340 NE 190th St, Miami, FL 33180
$-3,082
Cash flow
-25.5%
Cash-on-Cash Return
0.3%
Cap rate
0.6%
Rent to Value Ratio

Active
$510,000
2
bds
|
2
ba
|
1,110
sqft
|
built
1995
2351 Douglas Rd, Miami, FL 33145
$-1,402
Cash flow
-14.3%
Cash-on-Cash Return
2.8%
Cap rate
0.6%
Rent to Value Ratio
Active
$1,350,000
5
bds
|
0
ba
|
1,920
sqft
|
built
1971
67 NW 34th St, Miami, FL 33127
$-1,422
Cash flow
-5.5%
Cash-on-Cash Return
4.9%
Cap rate
0.6%
Rent to Value Ratio
Active
$1,350,000
7
bds
|
7
ba
|
3,154
sqft
|
built
1957
11445 SW 51st St, Miami, FL 33165
$-4,509
Cash flow
-17.4%
Cash-on-Cash Return
2.1%
Cap rate
0.3%
Rent to Value Ratio