Miami, FL Investment Properties for Sale
Browse homes for sale and investment properties in Miami, FL. Refine your search by price, property type, or more.
Best cash flowing properties in Miami, FL
Active
$143,000
1
bds
|
1
ba
|
465
sqft
|
built
1930
1021 NW 3rd St, Miami, FL 33128
$35
Cash flow
1.3%
Cash-on-Cash Return
6.6%
Cap rate
1.2%
Rent to Value Ratio
Active
$295,000
2
bds
|
2
ba
|
893
sqft
|
built
1986
995 SW 84th Ave, Miami, FL 33144
$-516
Cash flow
-9.1%
Cash-on-Cash Return
4.2%
Cap rate
0.8%
Rent to Value Ratio
6,307 out of 7,161 properties for sale in Miami, FL
Limited Results Shown
Create a free account, or log in to reveal all property listings and enjoy the complete experience.
Active
$610,000
2
bds
|
3
ba
|
1,174
sqft
|
built
2005
601 NE 36th St, Miami, FL 33137
$-2,918
Cash flow
-25.0%
Cash-on-Cash Return
0.5%
Cap rate
0.6%
Rent to Value Ratio
Active
$260,000
1
bds
|
1
ba
|
710
sqft
|
built
1973
7900 Camino Cir, Miami, FL 33143
$-1,074
Cash flow
-21.6%
Cash-on-Cash Return
1.3%
Cap rate
0.8%
Rent to Value Ratio

Active
$359,000
2
bds
|
2
ba
|
1,165
sqft
|
built
1981
20505 E Country Club Dr, Miami, FL 33180
$-1,439
Cash flow
-20.9%
Cash-on-Cash Return
1.5%
Cap rate
0.8%
Rent to Value Ratio
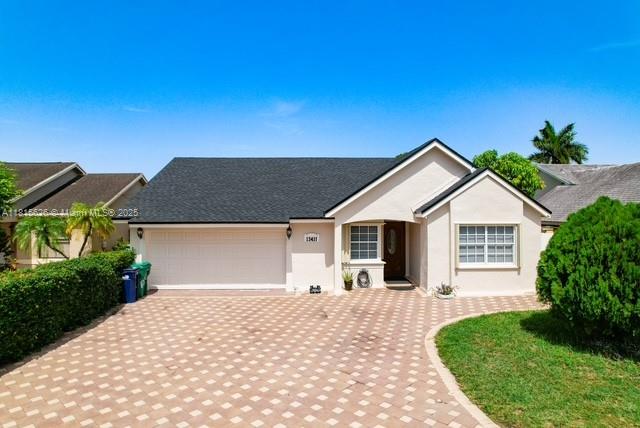
Active
$648,000
4
bds
|
2
ba
|
1,374
sqft
|
built
1986
13411 SW 116th Pl, Miami, FL 33176
$-1,521
Cash flow
-12.2%
Cash-on-Cash Return
3.5%
Cap rate
0.6%
Rent to Value Ratio
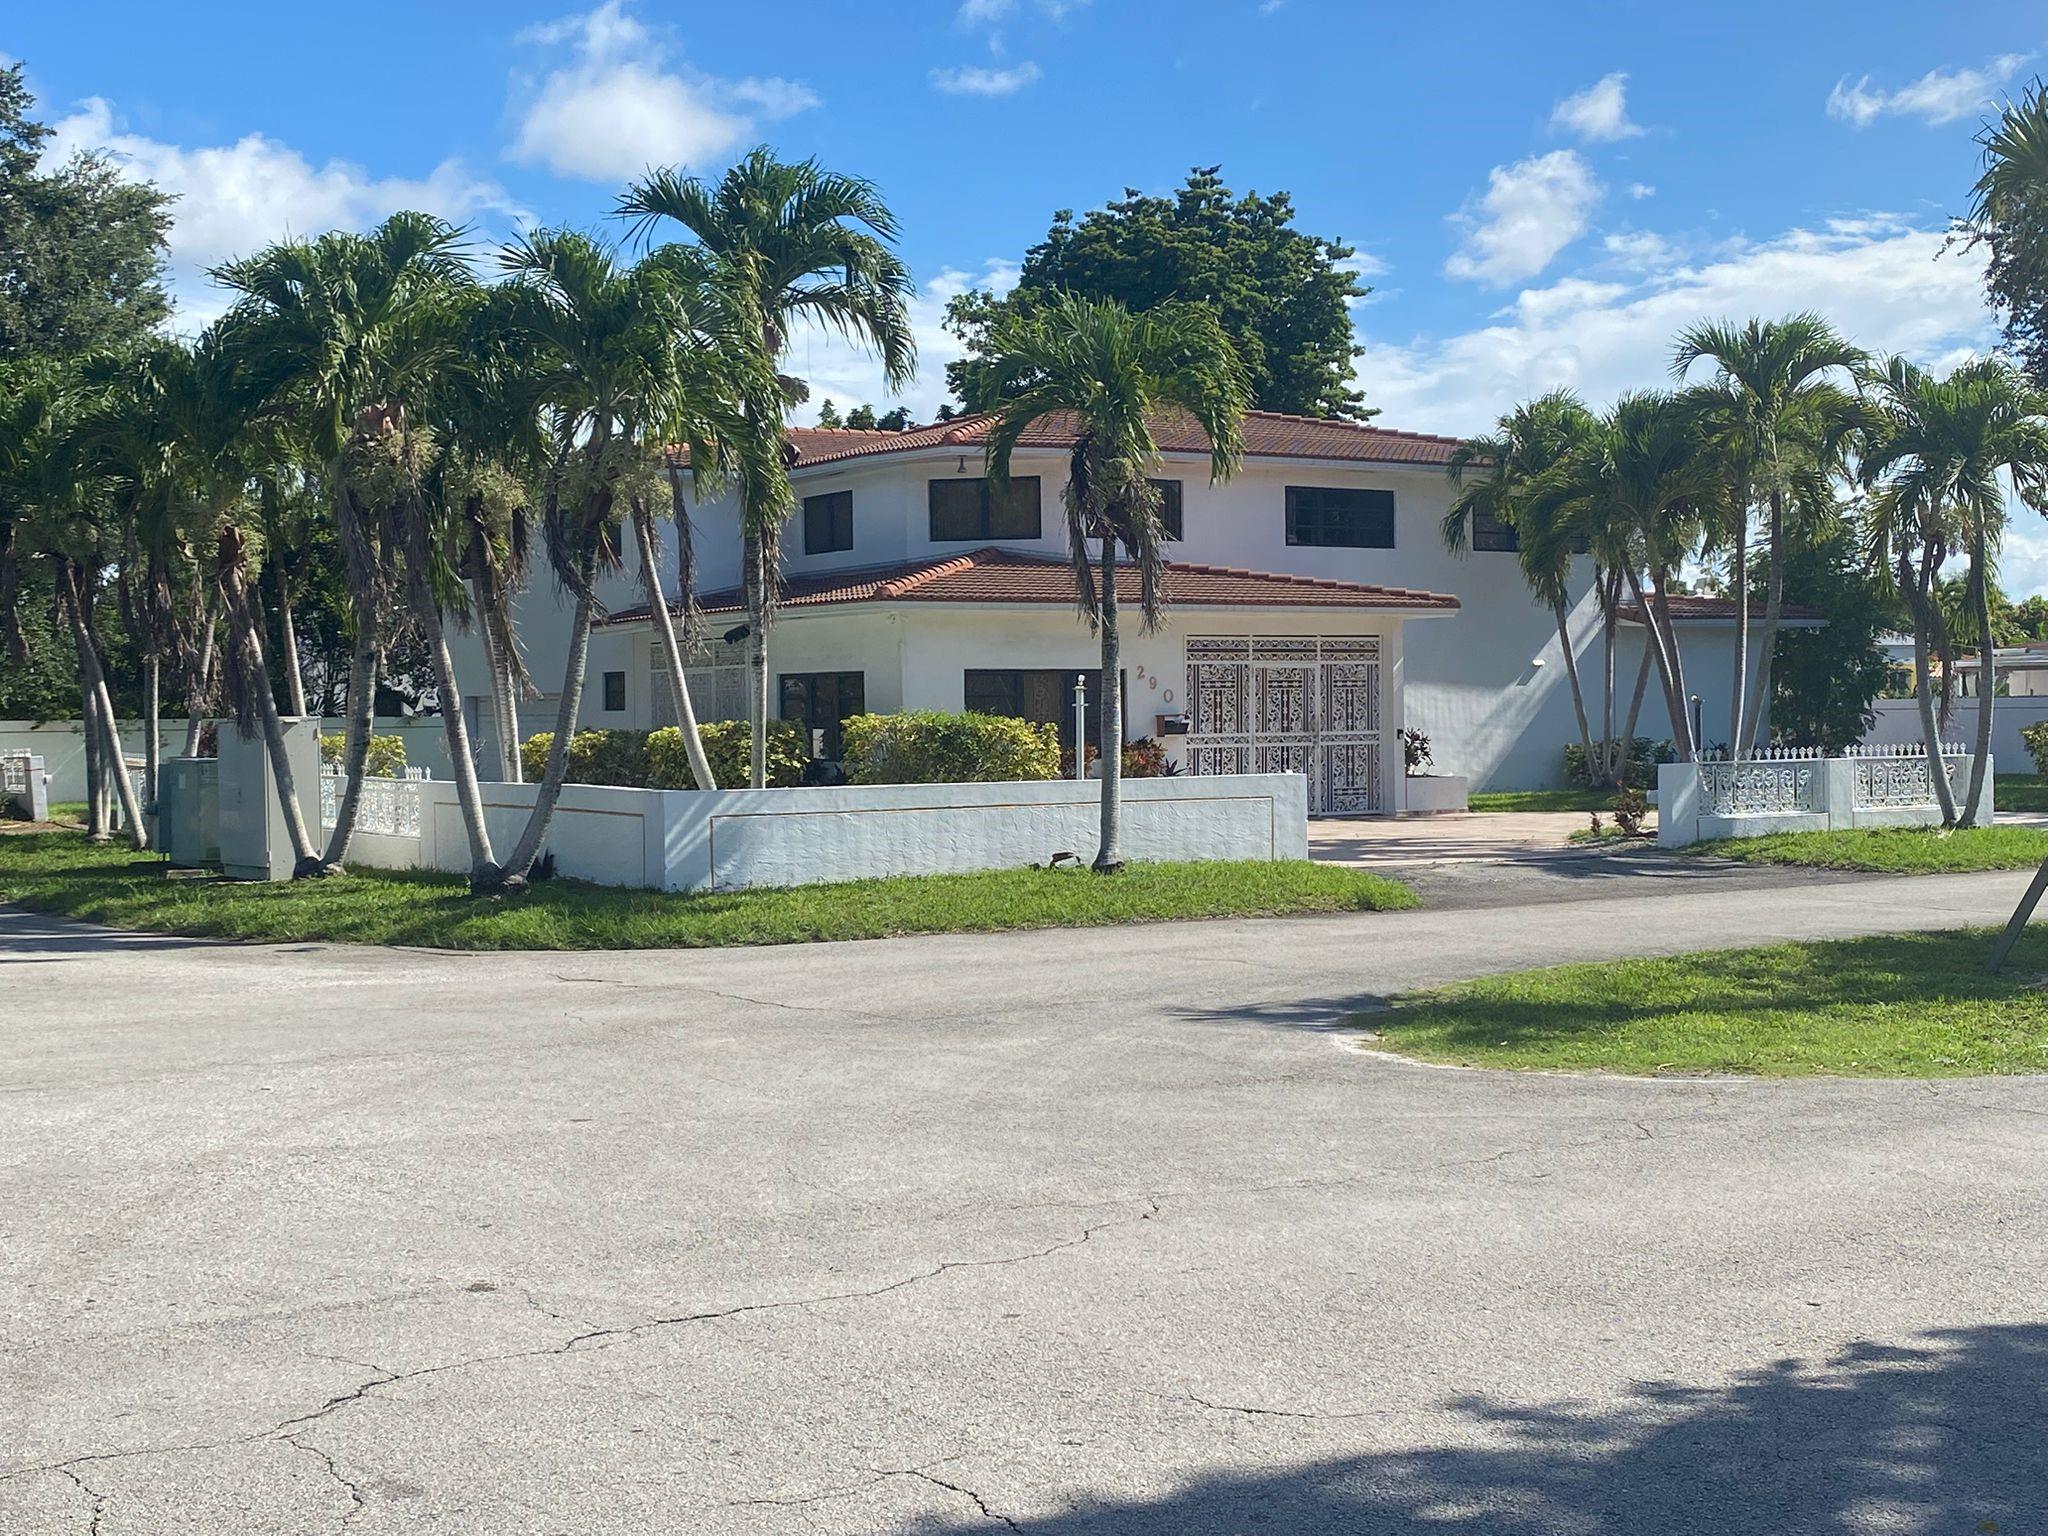
Active
$1,700,000
5
bds
|
6
ba
|
4,561
sqft
|
built
1986
290 NE 108th St, Miami, FL 33161
$-4,152
Cash flow
-12.7%
Cash-on-Cash Return
3.4%
Cap rate
0.5%
Rent to Value Ratio
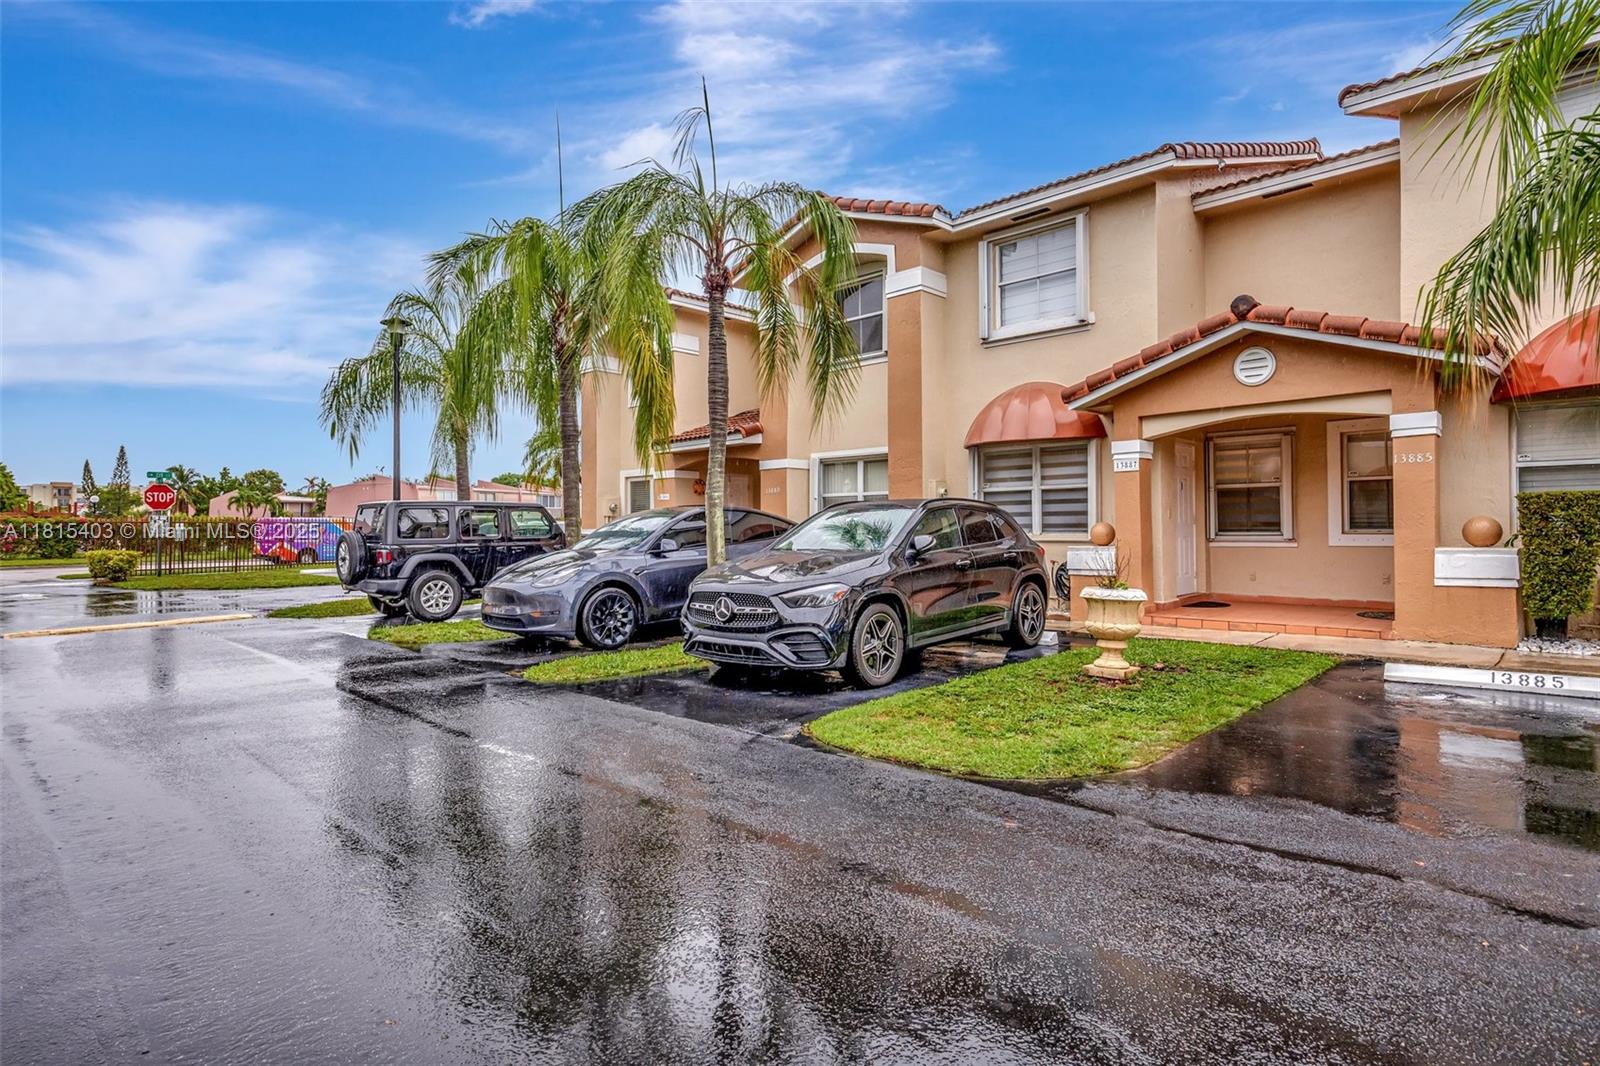
Active
$460,000
2
bds
|
3
ba
|
1,200
sqft
|
built
1995
13887 SW 64th St, Miami, FL 33183
$-1,159
Cash flow
-13.1%
Cash-on-Cash Return
3.3%
Cap rate
0.6%
Rent to Value Ratio
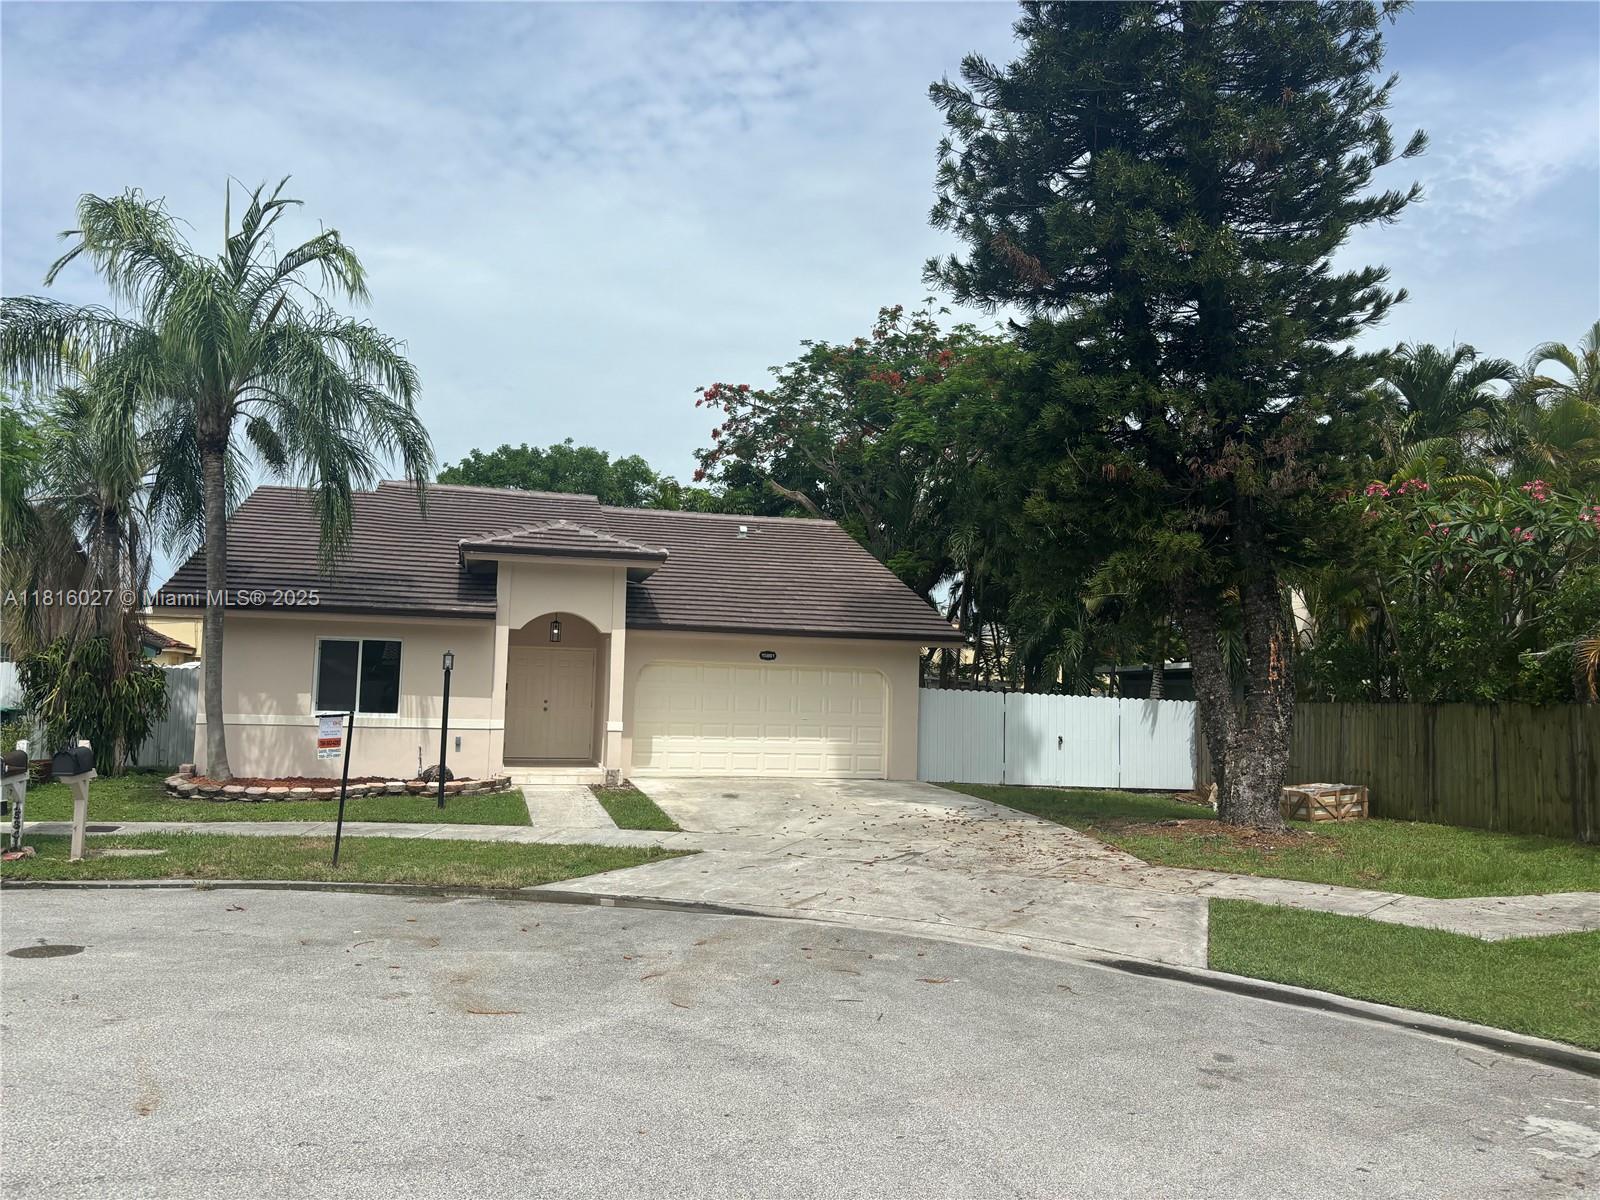
Active under contract
$649,900
4
bds
|
2
ba
|
1,897
sqft
|
built
1990
15861 SW 137th Pl, Miami, FL 33177
$-1,152
Cash flow
-9.2%
Cash-on-Cash Return
4.2%
Cap rate
0.6%
Rent to Value Ratio
Active
$825,000
3
bds
|
2
ba
|
1,406
sqft
|
built
2004
2000 N Bayshore Dr, Miami, FL 33137
$-2,701
Cash flow
-17.1%
Cash-on-Cash Return
2.4%
Cap rate
0.7%
Rent to Value Ratio
Active
$395,000
2
bds
|
2
ba
|
1,207
sqft
|
built
2007
7265 SW 89th St, Miami, FL 33156
$-1,544
Cash flow
-20.4%
Cash-on-Cash Return
1.6%
Cap rate
0.7%
Rent to Value Ratio

Active
$580,000
3
bds
|
3
ba
|
1,812
sqft
|
built
2004
973 SW 149th Ct, Miami, FL 33194
$-1,296
Cash flow
-11.7%
Cash-on-Cash Return
3.6%
Cap rate
0.6%
Rent to Value Ratio
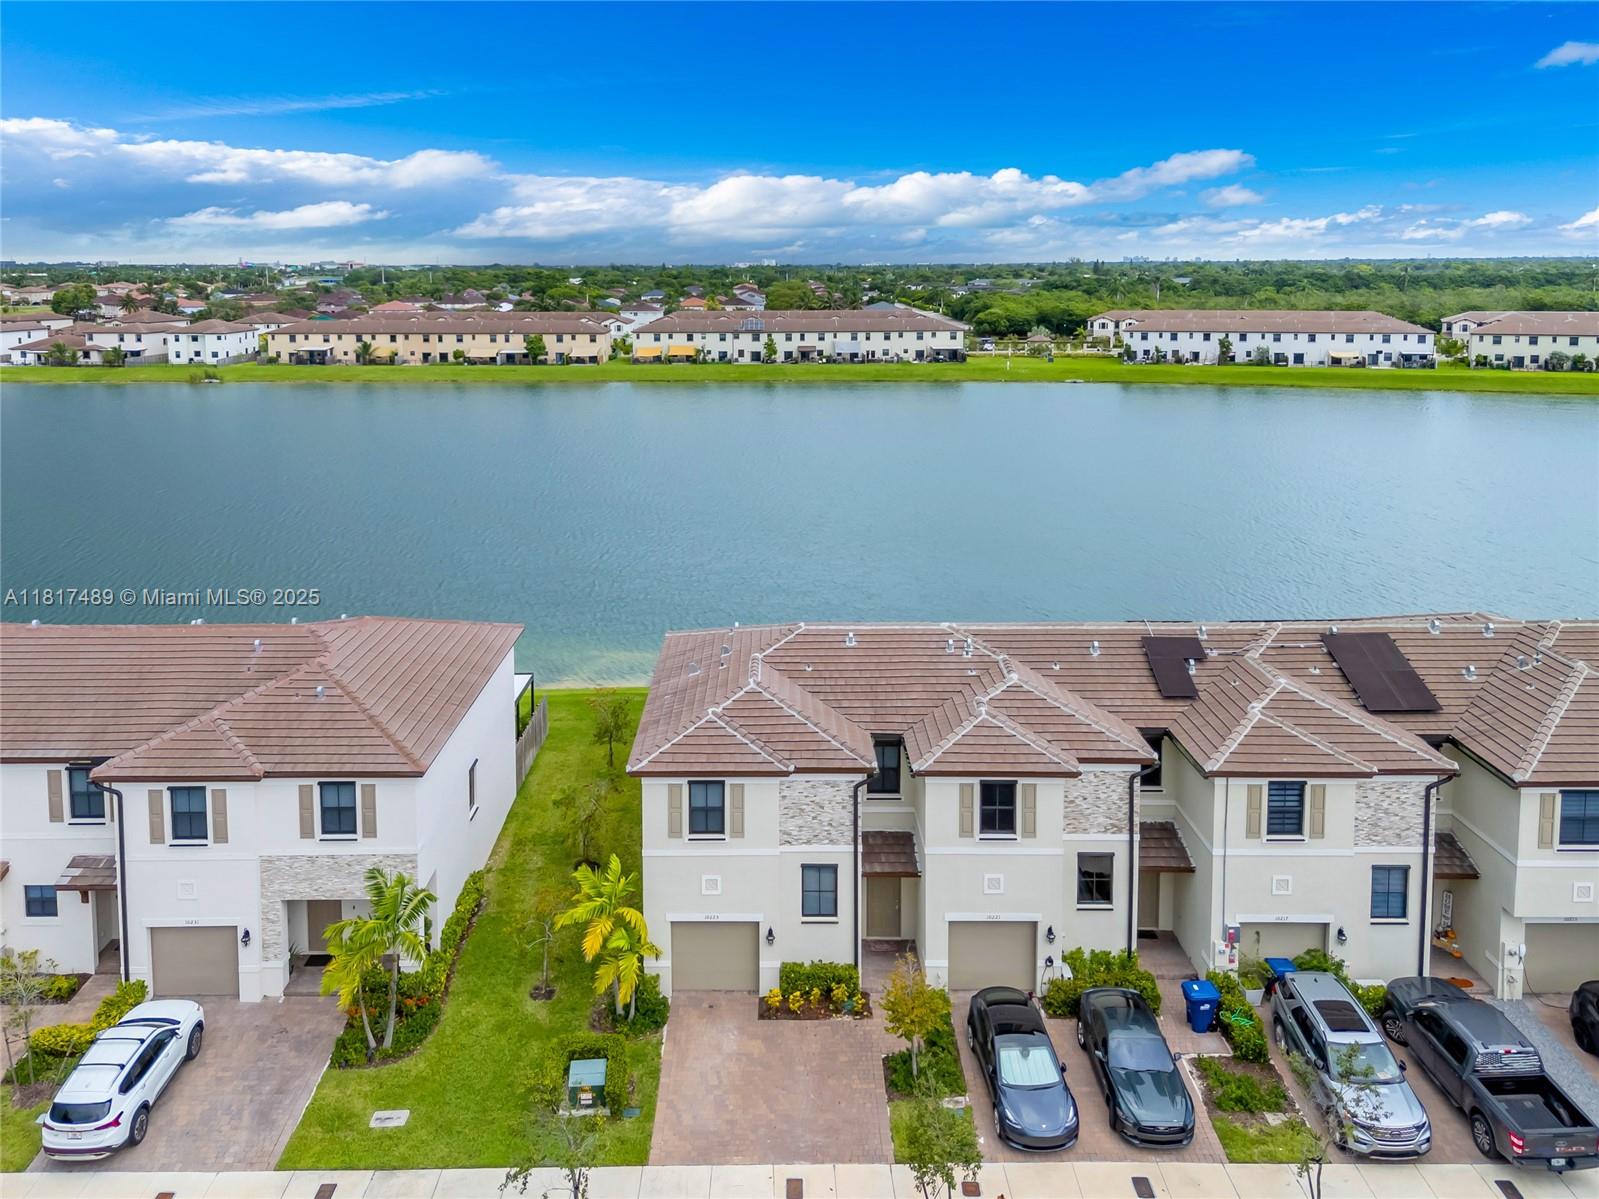
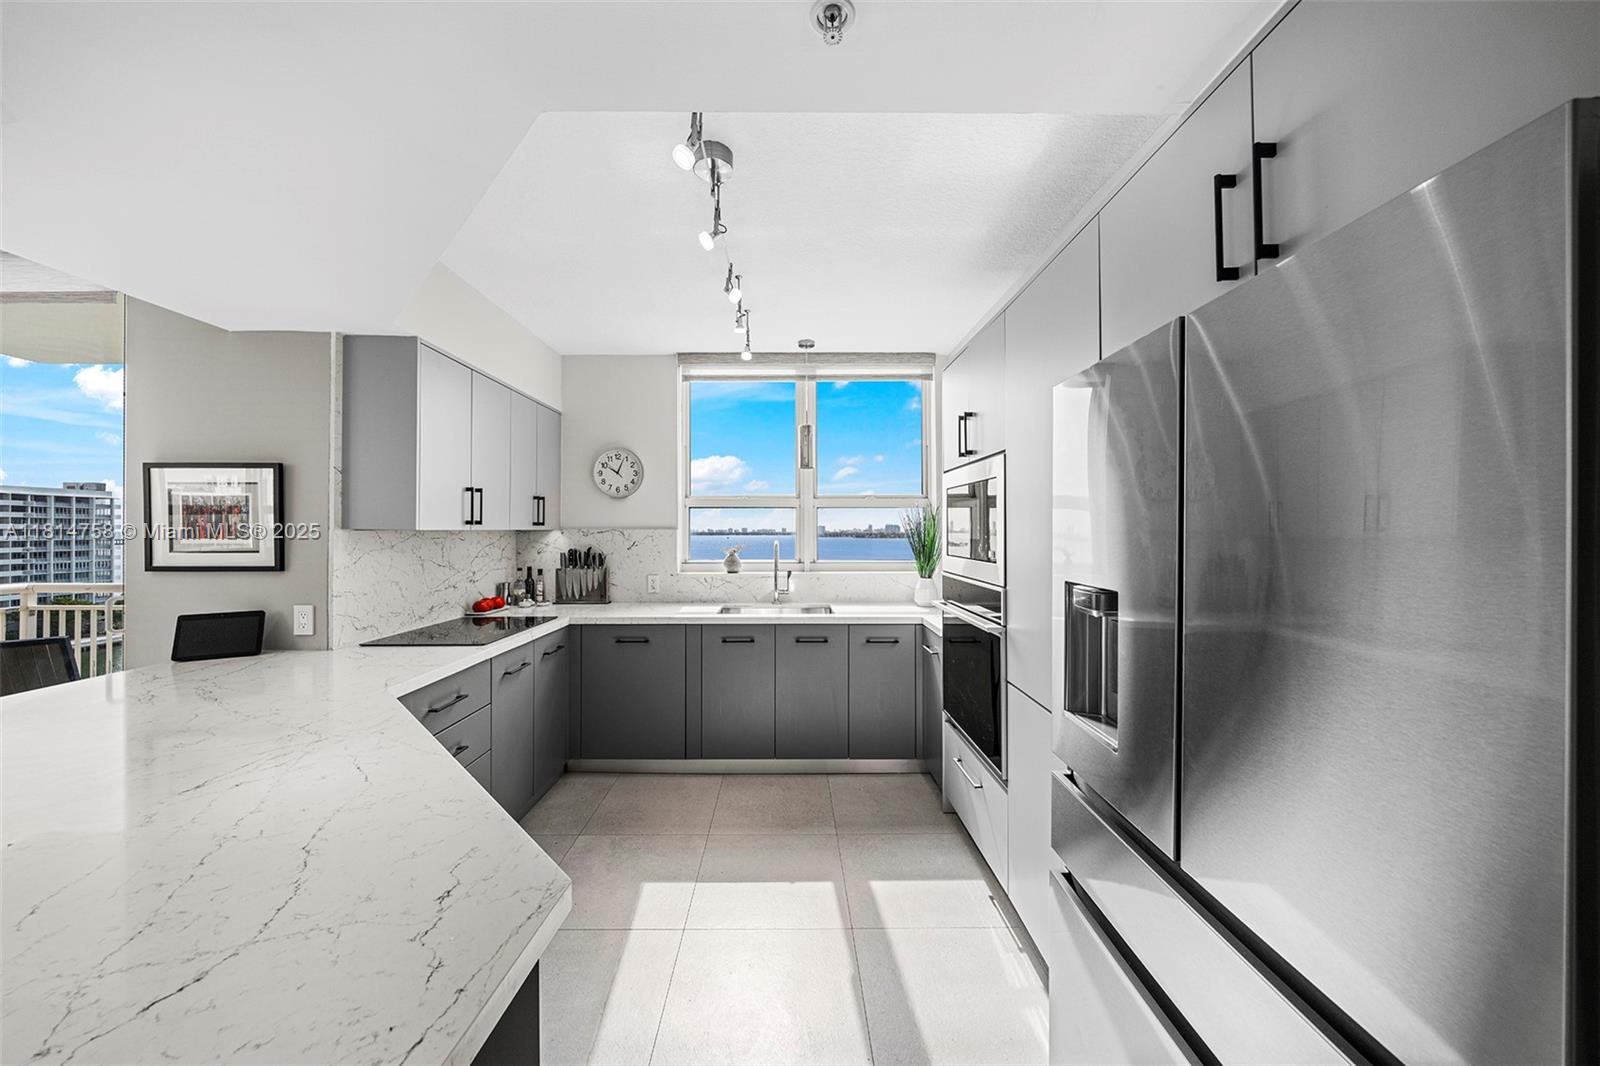
Active
$485,000
3
bds
|
3
ba
|
1,544
sqft
|
built
2021
10225 SW 231st Ln, Miami, FL 33190
$-1,310
Cash flow
-14.1%
Cash-on-Cash Return
3.0%
Cap rate
0.7%
Rent to Value Ratio
Active
$143,000
1
bds
|
1
ba
|
465
sqft
|
built
1930
1021 NW 3rd St, Miami, FL 33128
$35
Cash flow
1.3%
Cash-on-Cash Return
6.6%
Cap rate
1.2%
Rent to Value Ratio
Active
$795,000
3
bds
|
3
ba
|
2,232
sqft
|
built
2005
3082 SW 156th Ave, Miami, FL 33185
$-1,478
Cash flow
-9.7%
Cash-on-Cash Return
4.1%
Cap rate
0.7%
Rent to Value Ratio
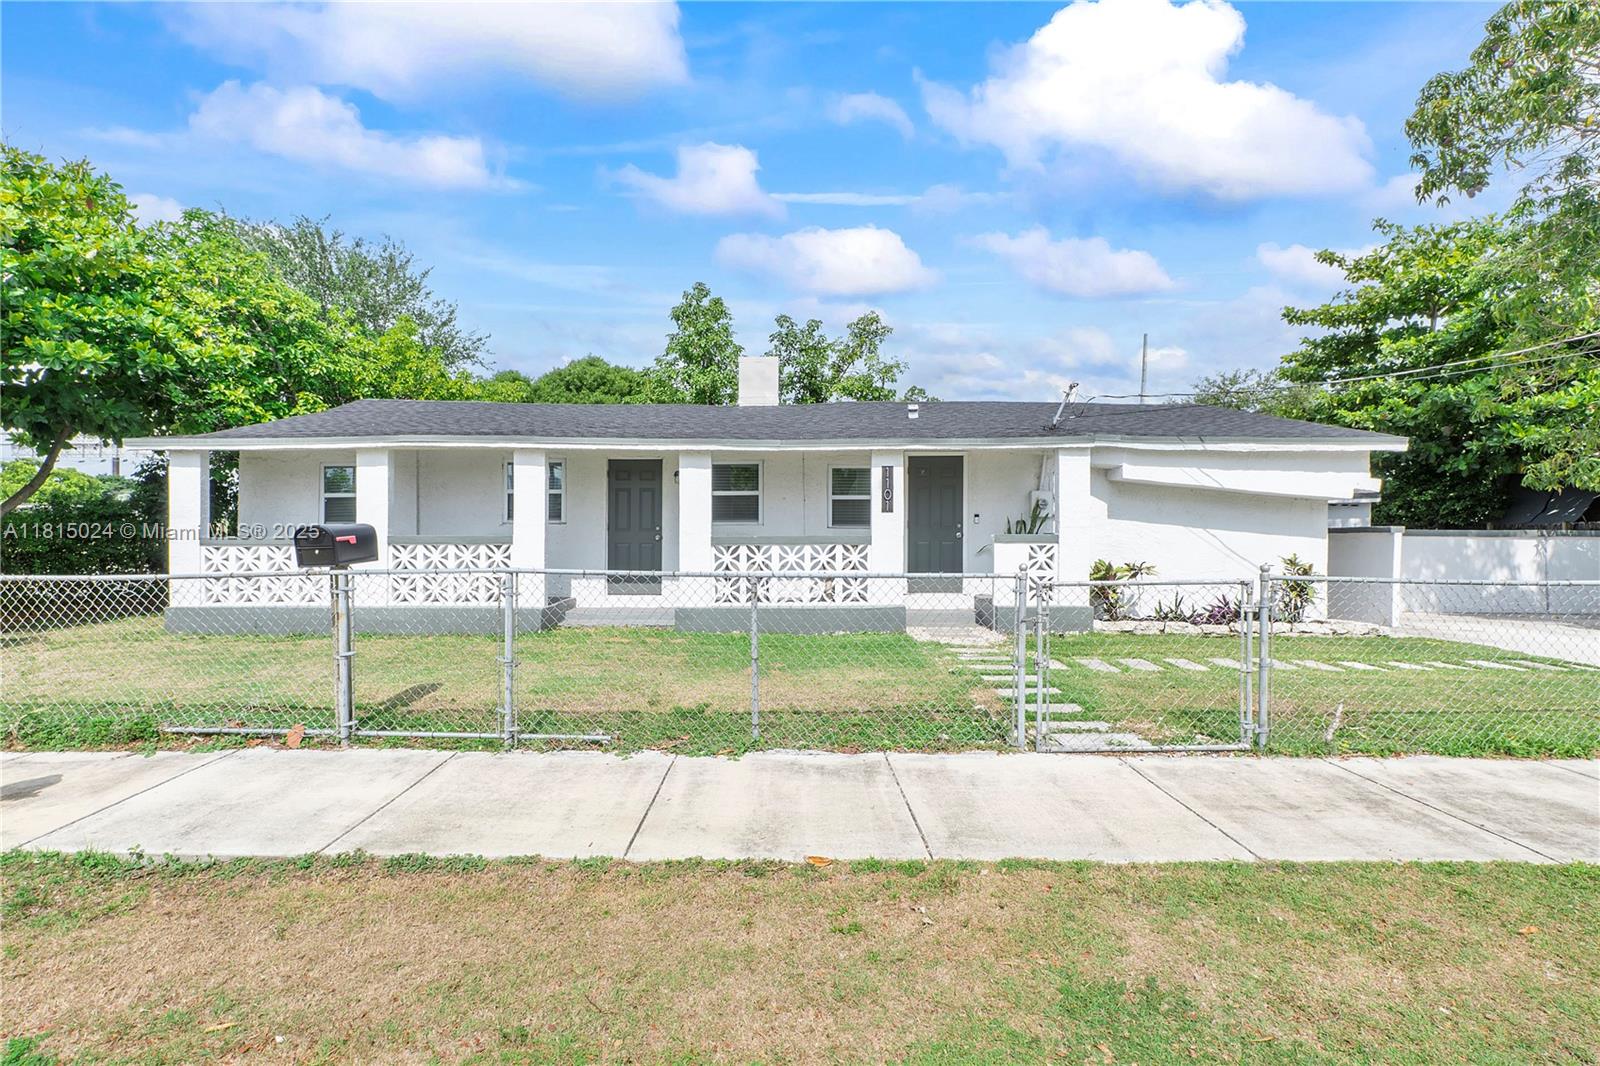
Active
$625,000
4
bds
|
2
ba
|
1,622
sqft
|
built
1934
1101 NW 40th St, Miami, FL 33127
$-1,921
Cash flow
-16.0%
Cash-on-Cash Return
2.6%
Cap rate
0.5%
Rent to Value Ratio
Active
$318,000
3
bds
|
2
ba
|
1,262
sqft
|
built
1973
13700 SW 62nd St, Miami, FL 33183
$-765
Cash flow
-12.6%
Cash-on-Cash Return
3.4%
Cap rate
0.8%
Rent to Value Ratio
Active
$349,900
3
bds
|
2
ba
|
1,279
sqft
|
built
1972
870 NW 87th Ave, Miami, FL 33172
$-789
Cash flow
-11.8%
Cash-on-Cash Return
3.6%
Cap rate
0.8%
Rent to Value Ratio

Active
$625,000
3
bds
|
2
ba
|
1,622
sqft
|
built
1950
14400 Tyler St, Miami, FL 33176
$-2,066
Cash flow
-17.2%
Cash-on-Cash Return
2.3%
Cap rate
0.5%
Rent to Value Ratio
Active
$1,650,000
7
bds
|
4
ba
|
4,245
sqft
|
built
1979
65 NE 152nd St, Miami, FL 33162
$-7,414
Cash flow
-23.4%
Cash-on-Cash Return
0.9%
Cap rate
0.1%
Rent to Value Ratio
Active
$2,500,000
5
bds
|
3
ba
|
5,412
sqft
|
built
1970
30 SW 21st Rd, Miami, FL 33129
$-10,770
Cash flow
-22.5%
Cash-on-Cash Return
1.1%
Cap rate
0.4%
Rent to Value Ratio
Active
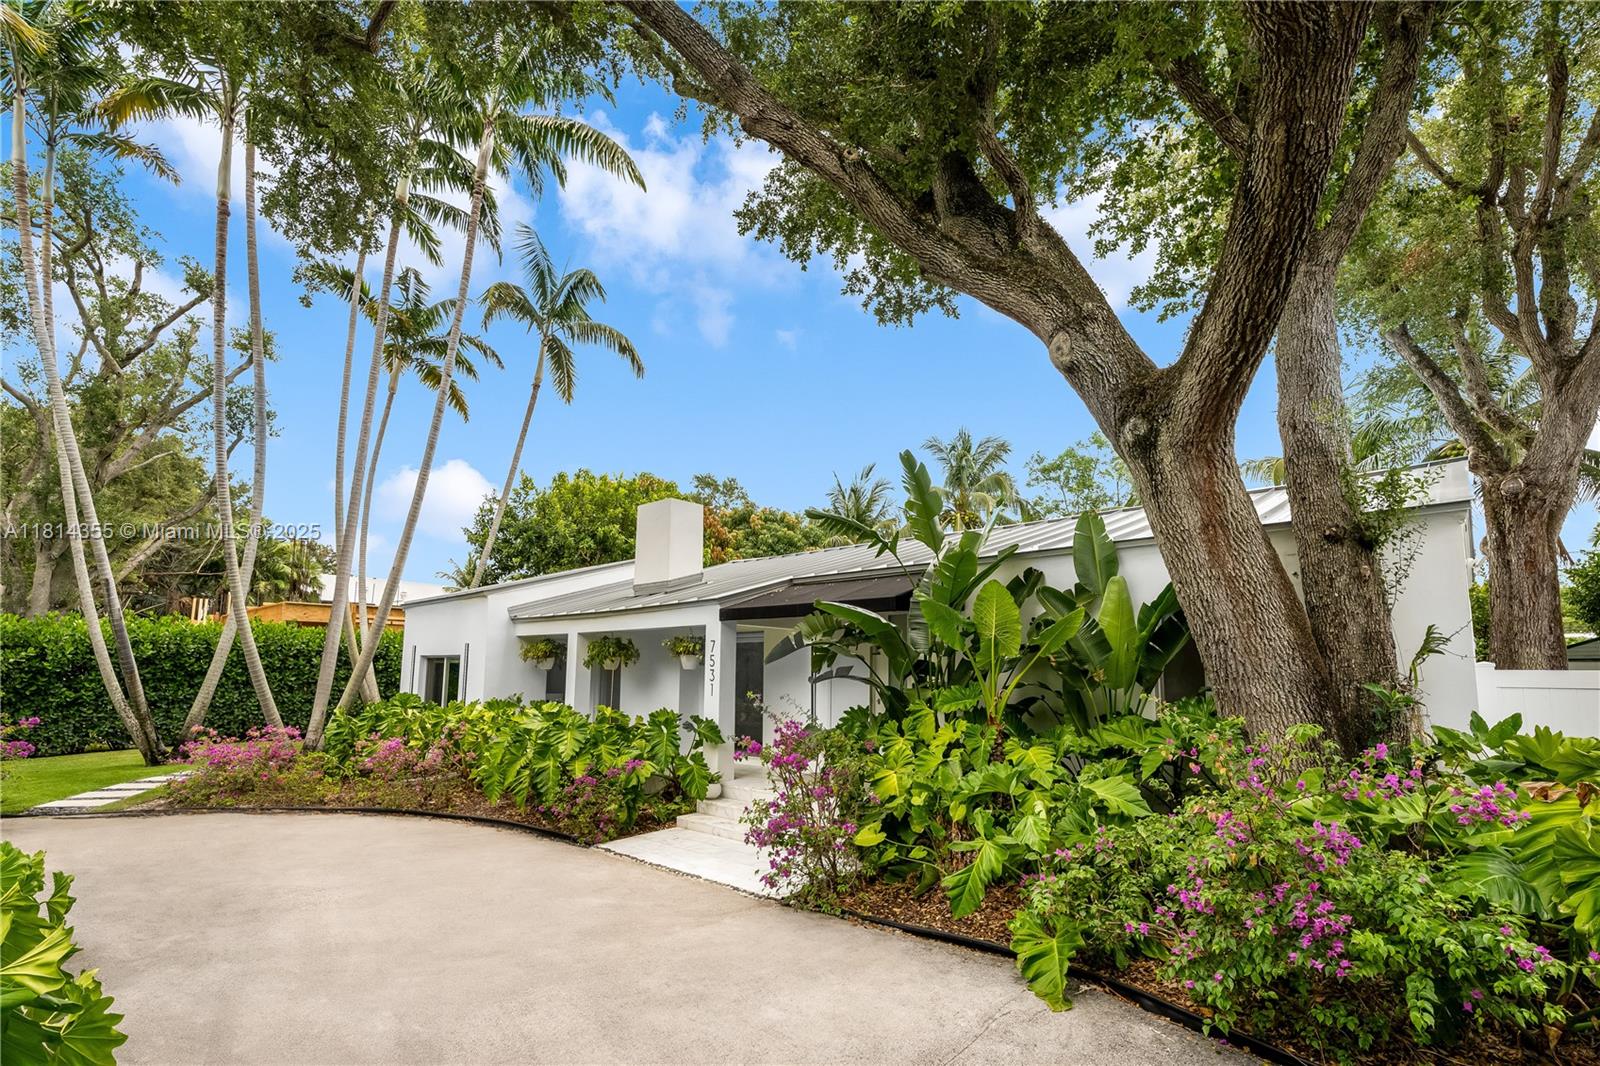
$2,850,000
4
bds
|
3
ba
|
2,314
sqft
|
built
1946
7531 SW 52nd Ct, Miami, FL 33143
$-9,699
Cash flow
-17.8%
Cash-on-Cash Return
2.2%
Cap rate
0.4%
Rent to Value Ratio
Active
$2,200,000
2
bds
|
3
ba
|
1,581
sqft
|
built
2001
3400 SW 27th Ave, Miami, FL 33133
$-10,130
Cash flow
-24.0%
Cash-on-Cash Return
0.8%
Cap rate
0.4%
Rent to Value Ratio

Active
$269,990
2
bds
|
1
ba
|
866
sqft
|
built
1971
2498 SW 17th Ave, Miami, FL 33145
$-599
Cash flow
-11.6%
Cash-on-Cash Return
3.6%
Cap rate
0.9%
Rent to Value Ratio
Active
$1,499,000
3
bds
|
3
ba
|
1,642
sqft
|
built
1954
6332 SW 43rd St, Miami, FL 33155
$-4,197
Cash flow
-14.6%
Cash-on-Cash Return
2.9%
Cap rate
0.5%
Rent to Value Ratio
Active
$824,900
2
bds
|
2
ba
|
1,200
sqft
|
built
1977
2591 Trapp Ave, Miami, FL 33133
$-2,663
Cash flow
-16.8%
Cash-on-Cash Return
2.4%
Cap rate
0.5%
Rent to Value Ratio
Active
$550,000
4
bds
|
3
ba
|
1,926
sqft
|
built
2004
8495 SW 165th Pl, Miami, FL 33193
$-1,224
Cash flow
-11.6%
Cash-on-Cash Return
3.6%
Cap rate
0.6%
Rent to Value Ratio
Active
$765,000
4
bds
|
3
ba
|
2,287
sqft
|
built
2002
1102 SW 144th Ct, Miami, FL 33184
$-2,032
Cash flow
-13.9%
Cash-on-Cash Return
3.1%
Cap rate
0.5%
Rent to Value Ratio
Active
$289,500
1
bds
|
1
ba
|
685
sqft
|
built
2003
5077 NW 7th St, Miami, FL 33126
$-743
Cash flow
-13.4%
Cash-on-Cash Return
3.2%
Cap rate
0.8%
Rent to Value Ratio
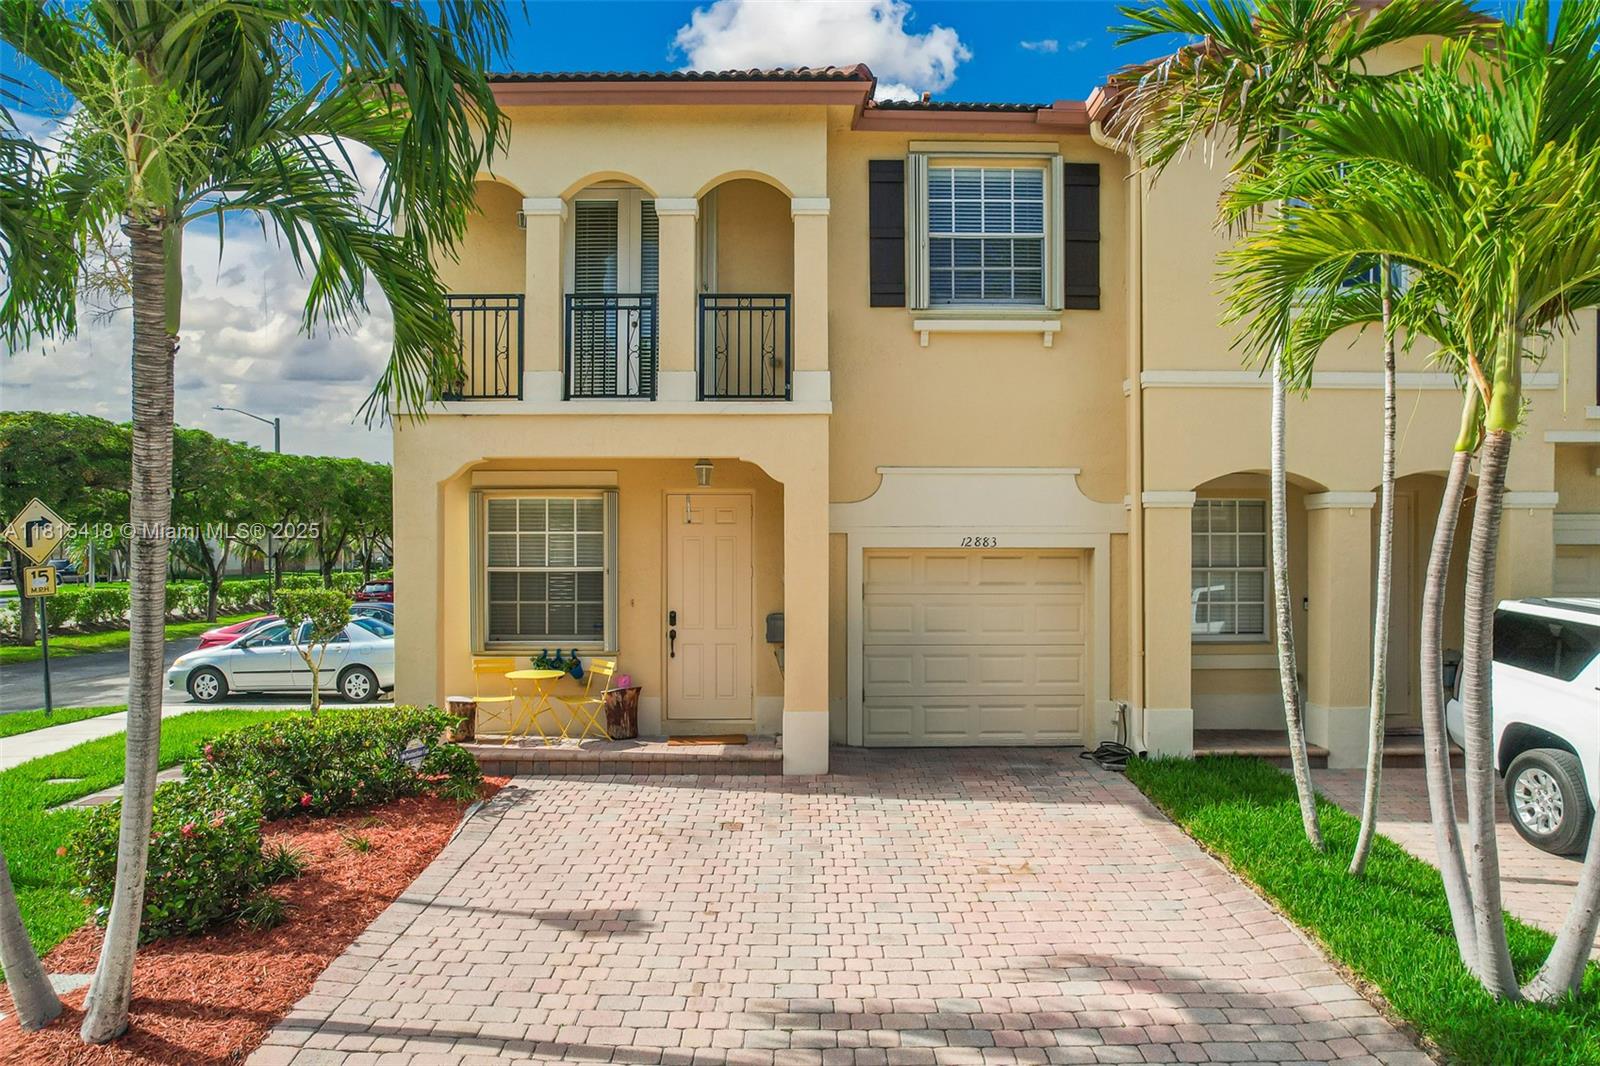
Active
$510,000
3
bds
|
3
ba
|
1,758
sqft
|
built
2005
12883 SW 134th Ter, Miami, FL 33186
$-1,468
Cash flow
-15.0%
Cash-on-Cash Return
2.8%
Cap rate
0.6%
Rent to Value Ratio
Active
$635,000
2
bds
|
2
ba
|
1,129
sqft
|
built
2008
90 SW 3rd St, Miami, FL 33130
$-1,918
Cash flow
-15.8%
Cash-on-Cash Return
2.7%
Cap rate
0.7%
Rent to Value Ratio
Active under contract
$575,000
4
bds
|
3
ba
|
2,722
sqft
|
built
1962
11615 SW 142nd Ter, Miami, FL 33176
$-1,046
Cash flow
-9.5%
Cash-on-Cash Return
4.1%
Cap rate
0.6%
Rent to Value Ratio
Active
$295,000
2
bds
|
2
ba
|
893
sqft
|
built
1986
995 SW 84th Ave, Miami, FL 33144
$-516
Cash flow
-9.1%
Cash-on-Cash Return
4.2%
Cap rate
0.8%
Rent to Value Ratio

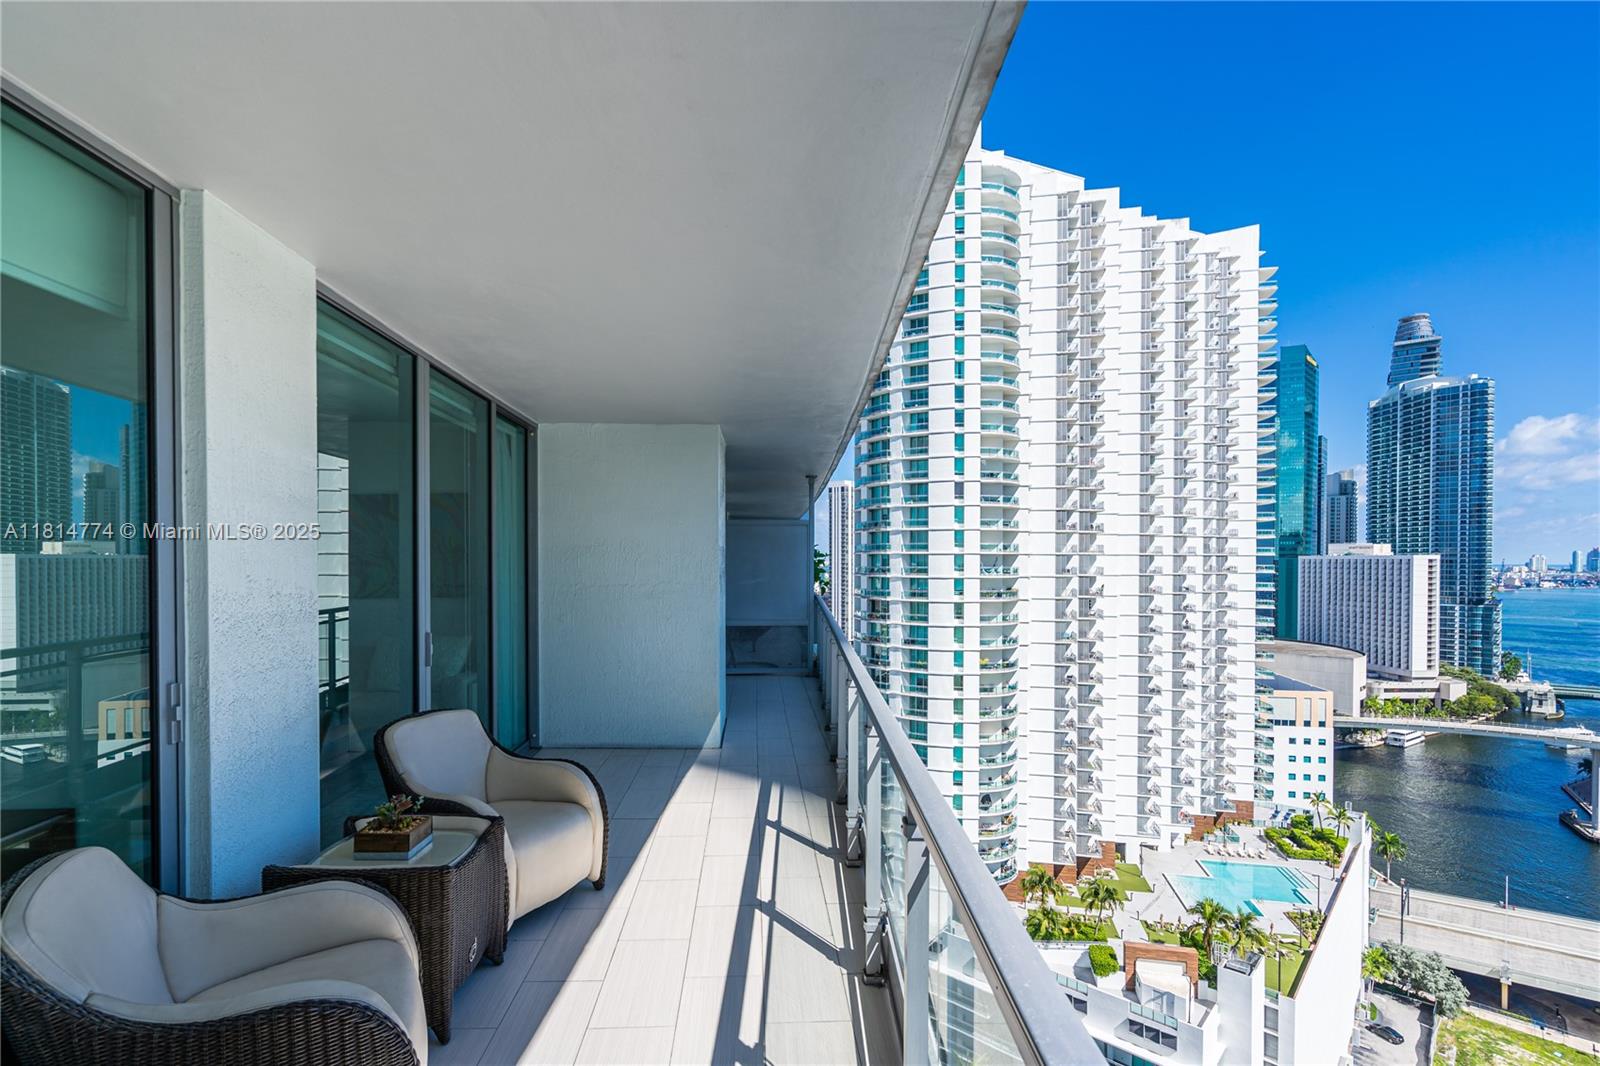
Active
$645,000
2
bds
|
2
ba
|
1,100
sqft
|
built
1974
2333 Brickell Ave, Miami, FL 33129
$-2,600
Cash flow
-21.0%
Cash-on-Cash Return
1.4%
Cap rate
0.6%
Rent to Value Ratio
Active
$2,495,000
6
bds
|
4
ba
|
4,947
sqft
|
built
1971
9470 SW 97th St, Miami, FL 33176
$-7,749
Cash flow
-16.2%
Cash-on-Cash Return
2.6%
Cap rate
0.4%
Rent to Value Ratio
Active
$1,450,000
3
bds
|
3
ba
|
1,577
sqft
|
built
2007
3470 E Coast Ave, Miami, FL 33137
$-3,609
Cash flow
-13.0%
Cash-on-Cash Return
3.3%
Cap rate
0.6%
Rent to Value Ratio
Active
$519,900
2
bds
|
3
ba
|
1,113
sqft
|
built
2006
690 SW 1st Ct, Miami, FL 33130
$-2,272
Cash flow
-22.8%
Cash-on-Cash Return
1.0%
Cap rate
0.7%
Rent to Value Ratio
Active
$359,000
bds
|
1
ba
|
425
sqft
|
built
2005
1200 Brickell Bay Dr, Miami, FL 33131
$-1,477
Cash flow
-21.5%
Cash-on-Cash Return
1.3%
Cap rate
0.6%
Rent to Value Ratio

Active
$350,000
bds
|
1
ba
|
545
sqft
|
built
2014
31 SE 6th St, Miami, FL 33131
$-1,235
Cash flow
-18.4%
Cash-on-Cash Return
2.1%
Cap rate
0.8%
Rent to Value Ratio
Active
$446,000
3
bds
|
3
ba
|
1,450
sqft
|
built
1987
10350 SW 154th Circle Ct, Miami, FL 33196
$-1,529
Cash flow
-17.9%
Cash-on-Cash Return
2.2%
Cap rate
0.6%
Rent to Value Ratio
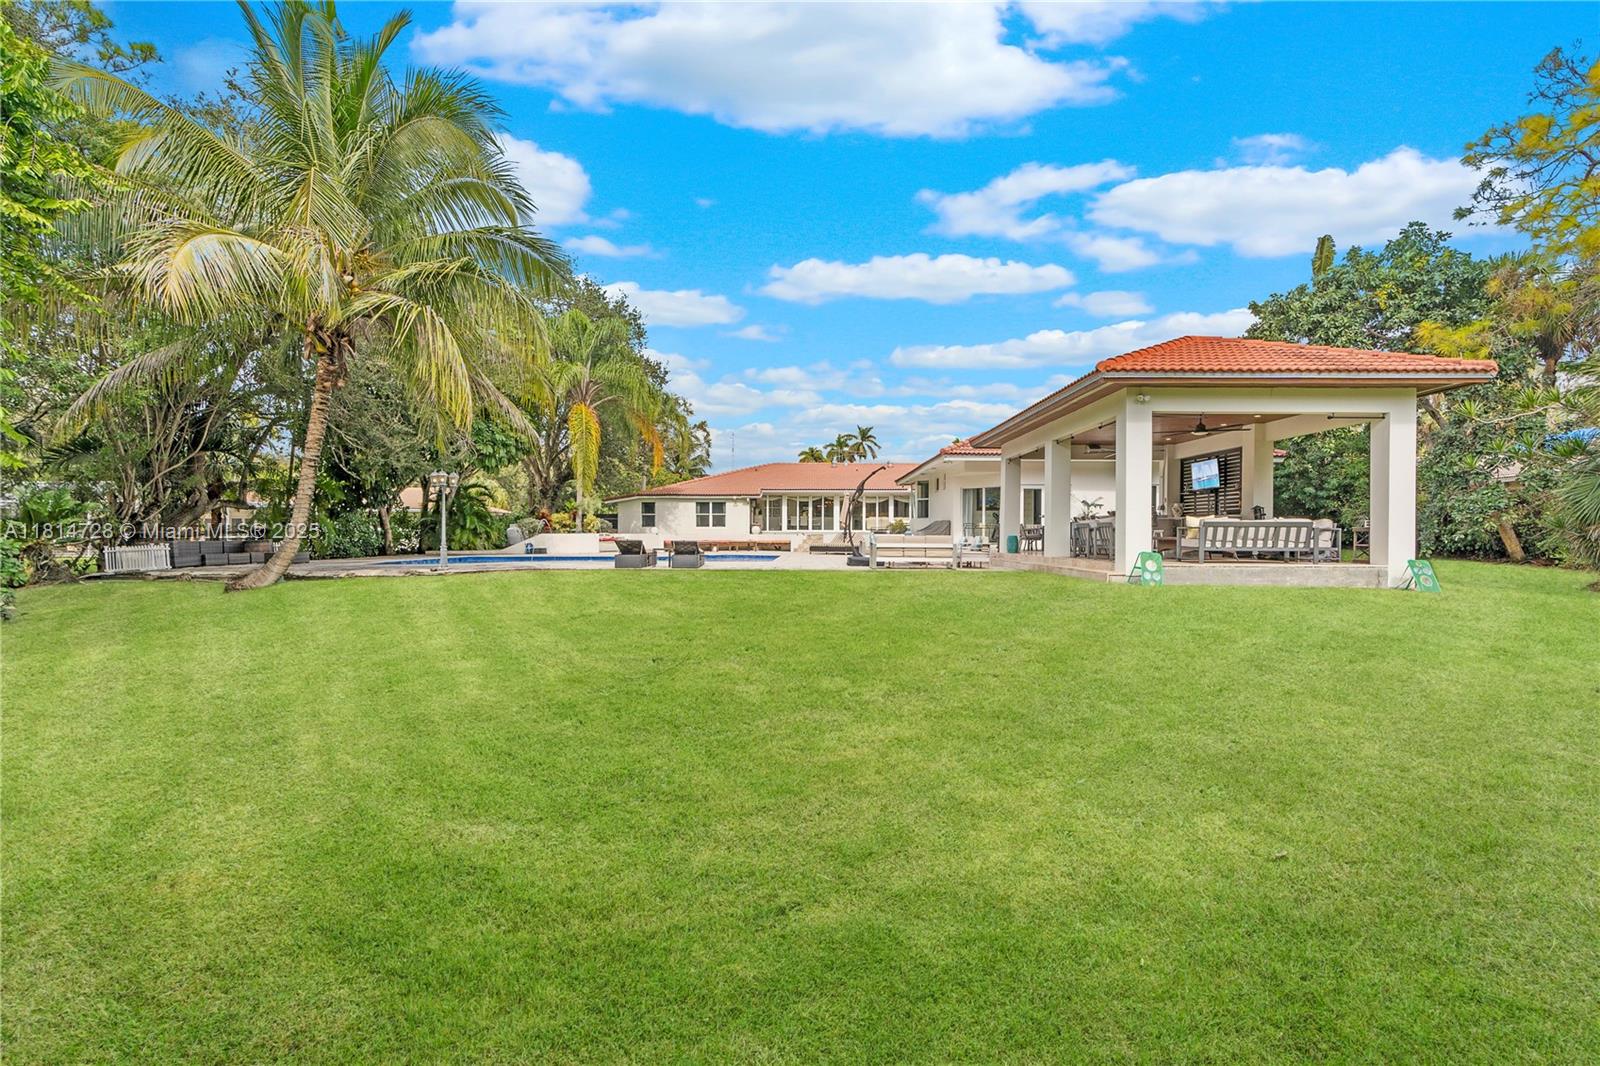
Active
$900,000
5
bds
|
4
ba
|
2,110
sqft
|
built
1958
11520 SW 57th St, Miami, FL 33173
$-2,164
Cash flow
-12.5%
Cash-on-Cash Return
3.4%
Cap rate
0.6%
Rent to Value Ratio
Active
$260,000
2
bds
|
2
ba
|
965
sqft
|
built
1981
8520 SW 133rd Avenue Rd, Miami, FL 33183
$-570
Cash flow
-11.4%
Cash-on-Cash Return
3.7%
Cap rate
0.9%
Rent to Value Ratio