Miami, FL Investment Properties for Sale
Browse homes for sale and investment properties in Miami, FL. Refine your search by price, property type, or more.
Best cash flowing properties in Miami, FL
Active
$165,000
1
bds
|
1
ba
|
840
sqft
|
built
1972
15600 NW 7th Ave, Miami, FL 33169
$-252
Cash flow
-8.0%
Cash-on-Cash Return
4.4%
Cap rate
1.0%
Rent to Value Ratio
Active
$165,000
1
bds
|
1
ba
|
840
sqft
|
built
1972
15600 NW 7th Ave, Miami, FL 33169
$-295
Cash flow
-9.3%
Cash-on-Cash Return
4.1%
Cap rate
0.9%
Rent to Value Ratio
6,092 out of 6,920 properties for sale in Miami, FL
Limited Results Shown
Create a free account, or log in to reveal all property listings and enjoy the complete experience.

Active
$295,000
3
bds
|
2
ba
|
1,040
sqft
|
built
1981
8420 SW 133rd Avenue Rd, Miami, FL 33183
$-607
Cash flow
-10.7%
Cash-on-Cash Return
3.8%
Cap rate
0.9%
Rent to Value Ratio
Active
$785,000
1
bds
|
1
ba
|
443
sqft
|
built
2022
398 NE 5th St, Miami, FL 33132
$-3,124
Cash flow
-20.8%
Cash-on-Cash Return
1.5%
Cap rate
0.4%
Rent to Value Ratio

Active
$825,000
2
bds
|
2
ba
|
1,242
sqft
|
built
2007
3470 E Coast Ave, Miami, FL 33137
$-3,524
Cash flow
-22.3%
Cash-on-Cash Return
1.1%
Cap rate
0.6%
Rent to Value Ratio

Active
$545,000
1
bds
|
1
ba
|
597
sqft
|
built
2008
465 Brickell Ave, Miami, FL 33131
$-1,997
Cash flow
-19.1%
Cash-on-Cash Return
1.9%
Cap rate
0.6%
Rent to Value Ratio
Active
$2,150,000
5
bds
|
3
ba
|
4,202
sqft
|
built
1973
50 SW 130th Ave, Miami, FL 33184
$-7,158
Cash flow
-17.4%
Cash-on-Cash Return
2.3%
Cap rate
0.3%
Rent to Value Ratio
Active
$899,000
2
bds
|
2
ba
|
1,143
sqft
|
built
2015
460 NE 28th St, Miami, FL 33137
$-3,209
Cash flow
-18.6%
Cash-on-Cash Return
2.0%
Cap rate
0.7%
Rent to Value Ratio

Pending
$204,000
1
bds
|
1
ba
|
777
sqft
|
built
1977
8501 NW 8th St, Miami, FL 33126
$-378
Cash flow
-9.7%
Cash-on-Cash Return
4.0%
Cap rate
0.9%
Rent to Value Ratio

Active
$1,199,000
4
bds
|
0
ba
|
3,134
sqft
|
built
1910
676 SW 1st St, Miami, FL 33130
$-3,433
Cash flow
-14.9%
Cash-on-Cash Return
2.8%
Cap rate
0.4%
Rent to Value Ratio
Active
$549,900
3
bds
|
2
ba
|
1,634
sqft
|
built
1985
19224 SW 122nd Ct, Miami, FL 33177
$-1,040
Cash flow
-9.9%
Cash-on-Cash Return
4.0%
Cap rate
0.6%
Rent to Value Ratio
Active
$475,000
bds
|
1
ba
|
341
sqft
|
built
2022
398 NE 5th St, Miami, FL 33132
$-1,256
Cash flow
-13.8%
Cash-on-Cash Return
3.1%
Cap rate
0.7%
Rent to Value Ratio
Active
$425,000
1
bds
|
1
ba
|
672
sqft
|
built
2015
4250 Biscayne Blvd, Miami, FL 33137
$-1,810
Cash flow
-22.2%
Cash-on-Cash Return
1.2%
Cap rate
0.7%
Rent to Value Ratio
Active
$4,650,000
6
bds
|
5
ba
|
3,370
sqft
|
built
1960
3566 Rockerman Rd, Miami, FL 33133
$-18,941
Cash flow
-21.3%
Cash-on-Cash Return
1.4%
Cap rate
0.2%
Rent to Value Ratio
Active
$369,000
1
bds
|
1
ba
|
710
sqft
|
built
2005
900 SW 8th St, Miami, FL 33130
$-1,061
Cash flow
-15.0%
Cash-on-Cash Return
2.8%
Cap rate
0.7%
Rent to Value Ratio
Active
$625,000
2
bds
|
3
ba
|
1,300
sqft
|
built
2007
185 SW 7th St, Miami, FL 33130
$-2,523
Cash flow
-21.1%
Cash-on-Cash Return
1.4%
Cap rate
0.6%
Rent to Value Ratio
Active
$165,000
1
bds
|
1
ba
|
840
sqft
|
built
1972
15600 NW 7th Ave, Miami, FL 33169
$-252
Cash flow
-8.0%
Cash-on-Cash Return
4.4%
Cap rate
1.0%
Rent to Value Ratio
Active
$465,000
1
bds
|
2
ba
|
761
sqft
|
built
2008
3301 NE 1st Ave, Miami, FL 33137
$-1,778
Cash flow
-19.9%
Cash-on-Cash Return
1.7%
Cap rate
0.6%
Rent to Value Ratio
Active
$165,000
1
bds
|
1
ba
|
840
sqft
|
built
1972
15600 NW 7th Ave, Miami, FL 33169
$-295
Cash flow
-9.3%
Cash-on-Cash Return
4.1%
Cap rate
0.9%
Rent to Value Ratio

Active
$1,325,000
3
bds
|
2
ba
|
1,568
sqft
|
built
1940
761 NE 77th St, Miami, FL 33138
$-3,486
Cash flow
-13.7%
Cash-on-Cash Return
3.1%
Cap rate
0.5%
Rent to Value Ratio

Active
$500,000
1
bds
|
2
ba
|
987
sqft
|
built
2006
41 SE 5th St, Miami, FL 33131
$-1,564
Cash flow
-16.3%
Cash-on-Cash Return
2.5%
Cap rate
0.6%
Rent to Value Ratio
Active
$539,000
3
bds
|
3
ba
|
1,328
sqft
|
built
2023
12227 NW 23rd Path, Miami, FL 33167
$-1,076
Cash flow
-10.4%
Cash-on-Cash Return
3.9%
Cap rate
0.7%
Rent to Value Ratio
Active
$700,000
2
bds
|
2
ba
|
1,227
sqft
|
built
2005
335 S Biscayne Blvd, Miami, FL 33131
$-2,686
Cash flow
-20.0%
Cash-on-Cash Return
1.7%
Cap rate
0.7%
Rent to Value Ratio

Active
$6,380,000
5
bds
|
5
ba
|
9,904
sqft
|
built
2022
12455 SW 45th St, Miami, FL 33175
$-28,153
Cash flow
-23.0%
Cash-on-Cash Return
1.0%
Cap rate
0.2%
Rent to Value Ratio

Active
$1,035,000
4
bds
|
4
ba
|
2,709
sqft
|
built
1963
19450 SW 125th Ave, Miami, FL 33177
$-968
Cash flow
-4.9%
Cash-on-Cash Return
5.1%
Cap rate
0.8%
Rent to Value Ratio
Active
$725,500
2
bds
|
2
ba
|
1,181
sqft
|
built
2008
3301 NE 1st Ave, Miami, FL 33137
$-2,863
Cash flow
-20.6%
Cash-on-Cash Return
1.5%
Cap rate
0.7%
Rent to Value Ratio
Active
$419,900
1
bds
|
1
ba
|
794
sqft
|
built
2007
1900 N Bayshore Dr, Miami, FL 33132
$-1,363
Cash flow
-16.9%
Cash-on-Cash Return
2.4%
Cap rate
0.7%
Rent to Value Ratio
Active
$299,000
1
bds
|
1
ba
|
575
sqft
|
built
2002
3500 Coral Way, Miami, FL 33145
$-462
Cash flow
-8.1%
Cash-on-Cash Return
4.4%
Cap rate
0.7%
Rent to Value Ratio
Active
$2,650,000
5
bds
|
4
ba
|
1,438
sqft
|
built
2025
350 SW 34th Ave, Miami, FL 33135
$-13,903
Cash flow
-27.4%
Cash-on-Cash Return
0.0%
Cap rate
0.1%
Rent to Value Ratio

Active
$980,000
3
bds
|
2
ba
|
1,110
sqft
|
built
2018
501 NE 31st St, Miami, FL 33137
$-1,273
Cash flow
-6.8%
Cash-on-Cash Return
4.7%
Cap rate
0.9%
Rent to Value Ratio

Active
$459,000
2
bds
|
2
ba
|
1,579
sqft
|
built
1974
19464 NE 26th Ave, Miami, FL 33180
$-1,221
Cash flow
-13.9%
Cash-on-Cash Return
3.1%
Cap rate
0.8%
Rent to Value Ratio
Active
$219,000
1
bds
|
2
ba
|
741
sqft
|
built
1971
3475 N Country Club Dr, Miami, FL 33180
$-418
Cash flow
-10.0%
Cash-on-Cash Return
4.0%
Cap rate
1.0%
Rent to Value Ratio

Active
$499,000
2
bds
|
2
ba
|
1,069
sqft
|
built
2004
1250 S Miami Ave, Miami, FL 33130
$-1,956
Cash flow
-20.5%
Cash-on-Cash Return
1.6%
Cap rate
0.7%
Rent to Value Ratio
Active
$310,000
2
bds
|
2
ba
|
1,000
sqft
|
built
1995
1699 SW 7th St, Miami, FL 33135
$-548
Cash flow
-9.2%
Cash-on-Cash Return
4.1%
Cap rate
0.8%
Rent to Value Ratio
Active
$500,000
1
bds
|
1
ba
|
822
sqft
|
built
1961
3301 NE 5th Ave, Miami, FL 33137
$-1,635
Cash flow
-17.1%
Cash-on-Cash Return
2.3%
Cap rate
0.6%
Rent to Value Ratio

Active
$530,000
1
bds
|
2
ba
|
981
sqft
|
built
2006
41 SE 5th St, Miami, FL 33131
$-1,860
Cash flow
-18.3%
Cash-on-Cash Return
2.1%
Cap rate
0.7%
Rent to Value Ratio

Active
$500,000
3
bds
|
3
ba
|
1,638
sqft
|
built
1937
8024 NW 36th Ct, Miami, FL 33147
$-776
Cash flow
-8.1%
Cash-on-Cash Return
4.4%
Cap rate
0.6%
Rent to Value Ratio
Active
$875,000
3
bds
|
3
ba
|
1,505
sqft
|
built
2015
600 NE 27th St, Miami, FL 33137
$-2,099
Cash flow
-12.5%
Cash-on-Cash Return
3.4%
Cap rate
0.8%
Rent to Value Ratio
Active
$1,700,000
5
bds
|
4
ba
|
2,799
sqft
|
built
2001
10601 SW 128th St, Miami, FL 33176
$-4,824
Cash flow
-14.8%
Cash-on-Cash Return
2.9%
Cap rate
0.4%
Rent to Value Ratio

Active
$500,000
2
bds
|
2
ba
|
1,160
sqft
|
built
2004
2000 N Bayshore Dr, Miami, FL 33137
$-1,873
Cash flow
-19.5%
Cash-on-Cash Return
1.8%
Cap rate
0.7%
Rent to Value Ratio
Active
$670,000
2
bds
|
2
ba
|
834
sqft
|
built
1940
585 NW 51st St, Miami, FL 33127
$-2,404
Cash flow
-18.7%
Cash-on-Cash Return
2.0%
Cap rate
0.4%
Rent to Value Ratio
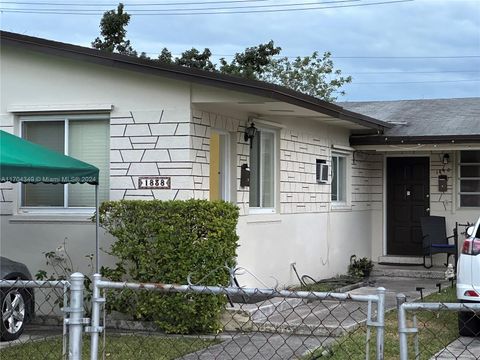
Active
$749,500
4
bds
|
0
ba
|
1,904
sqft
|
built
1963
1838 NW 18th St, Miami, FL 33125
$-3,089
Cash flow
-21.5%
Cash-on-Cash Return
1.3%
Cap rate
0.3%
Rent to Value Ratio