Miami, FL Investment Properties for Sale
Browse homes for sale and investment properties in Miami, FL. Refine your search by price, property type, or more.
Best cash flowing properties in Miami, FL
Active
$159,999
1
bds
|
2
ba
|
861
sqft
|
built
1969
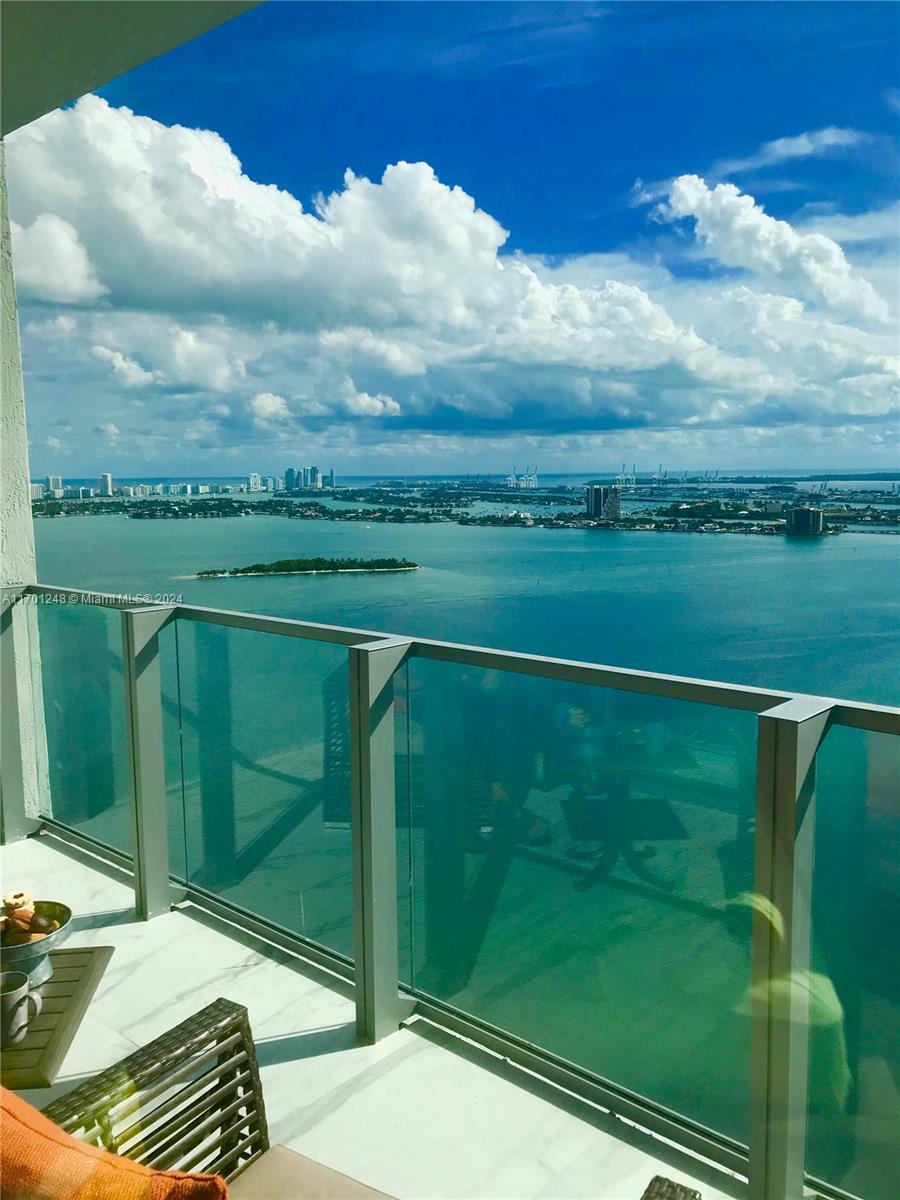
1351 NE Miami Gardens Dr, Miami, FL 33179
$194
Cash flow
6.3%
Cash-on-Cash Return
7.6%
Cap rate
1.1%
Rent to Value Ratio
Active
$198,000
2
bds
|
1
ba
|
930
sqft
|
built
1958
483 NW 84th Ln, Miami, FL 33150
$71
Cash flow
1.9%
Cash-on-Cash Return
6.6%
Cap rate
1.1%
Rent to Value Ratio
6,119 out of 6,950 properties for sale in Miami, FL
Limited Results Shown
Create a free account, or log in to reveal all property listings and enjoy the complete experience.
Active
$1,025,000
3
bds
|
0
ba
|
2,752
sqft
|
built
1937
236 SW 10th Ave, Miami, FL 33130
$-4,471
Cash flow
-22.8%
Cash-on-Cash Return
0.9%
Cap rate
0.2%
Rent to Value Ratio
Active
$660,000
2
bds
|
2
ba
|
1,226
sqft
|
built
2016
601 NE 27th St, Miami, FL 33137
$-2,560
Cash flow
-20.2%
Cash-on-Cash Return
1.5%
Cap rate
0.6%
Rent to Value Ratio

Active
$1,080,000
2
bds
|
2
ba
|
1,029
sqft
|
built
2017
2900 NE 7th Ave, Miami, FL 33137
$-3,845
Cash flow
-18.6%
Cash-on-Cash Return
1.9%
Cap rate
0.5%
Rent to Value Ratio
Active
$990,000
1
bds
|
1
ba
|
509
sqft
|
built
2022
398 NE 5th St, Miami, FL 33132
$-3,581
Cash flow
-18.9%
Cash-on-Cash Return
1.8%
Cap rate
0.5%
Rent to Value Ratio

Active
$1,100,000
2
bds
|
3
ba
|
1,450
sqft
|
built
2008
900 Biscayne Blvd, Miami, FL 33132
$-3,412
Cash flow
-16.2%
Cash-on-Cash Return
2.4%
Cap rate
0.7%
Rent to Value Ratio

Active
$184,000
1
bds
|
1
ba
|
688
sqft
|
built
1972
677 SW 9th Ave, Miami, FL 33130
$-300
Cash flow
-8.5%
Cash-on-Cash Return
4.2%
Cap rate
1.0%
Rent to Value Ratio

Active
$438,000
1
bds
|
1
ba
|
1,186
sqft
|
built
2007
7350 SW 89th St, Miami, FL 33156
$-2,076
Cash flow
-24.7%
Cash-on-Cash Return
0.5%
Cap rate
0.6%
Rent to Value Ratio
Active
$3,900,000
3
bds
|
0
ba
|
2,105
sqft
|
built
1946
280 NW 33rd St, Miami, FL 33127
$-19,127
Cash flow
-25.6%
Cash-on-Cash Return
0.3%
Cap rate
0.1%
Rent to Value Ratio
Active
$1,950,000
4
bds
|
4
ba
|
2,188
sqft
|
built
2019
851 NE 1st Ave, Miami, FL 33132
$-9,377
Cash flow
-25.1%
Cash-on-Cash Return
0.4%
Cap rate
0.5%
Rent to Value Ratio
Active
$275,000
3
bds
|
2
ba
|
1,085
sqft
|
built
1989
2020 NW 119th St, Miami, FL 33167
$-302
Cash flow
-5.7%
Cash-on-Cash Return
4.8%
Cap rate
0.9%
Rent to Value Ratio
Active
$599,999
2
bds
|
2
ba
|
1,144
sqft
|
built
2007
1800 N Bayshore Dr, Miami, FL 33132
$-2,352
Cash flow
-20.5%
Cash-on-Cash Return
1.4%
Cap rate
0.6%
Rent to Value Ratio
Active
$665,000
2
bds
|
2
ba
|
1,051
sqft
|
built
2006
31 SE 5th St, Miami, FL 33131
$-2,419
Cash flow
-19.0%
Cash-on-Cash Return
1.8%
Cap rate
0.6%
Rent to Value Ratio
Active
$2,300,000
2
bds
|
3
ba
|
1,801
sqft
|
built
2003
1435 Brickell Ave, Miami, FL 33131
$-15,688
Cash flow
-35.6%
Cash-on-Cash Return
-2.0%
Cap rate
0.1%
Rent to Value Ratio
Active
$299,999
2
bds
|
2
ba
|
1,164
sqft
|
built
1982
4000 Towerside Ter, Miami, FL 33138
$-945
Cash flow
-16.4%
Cash-on-Cash Return
2.4%
Cap rate
1.2%
Rent to Value Ratio
Active
$205,000
1
bds
|
1
ba
|
801
sqft
|
built
1968
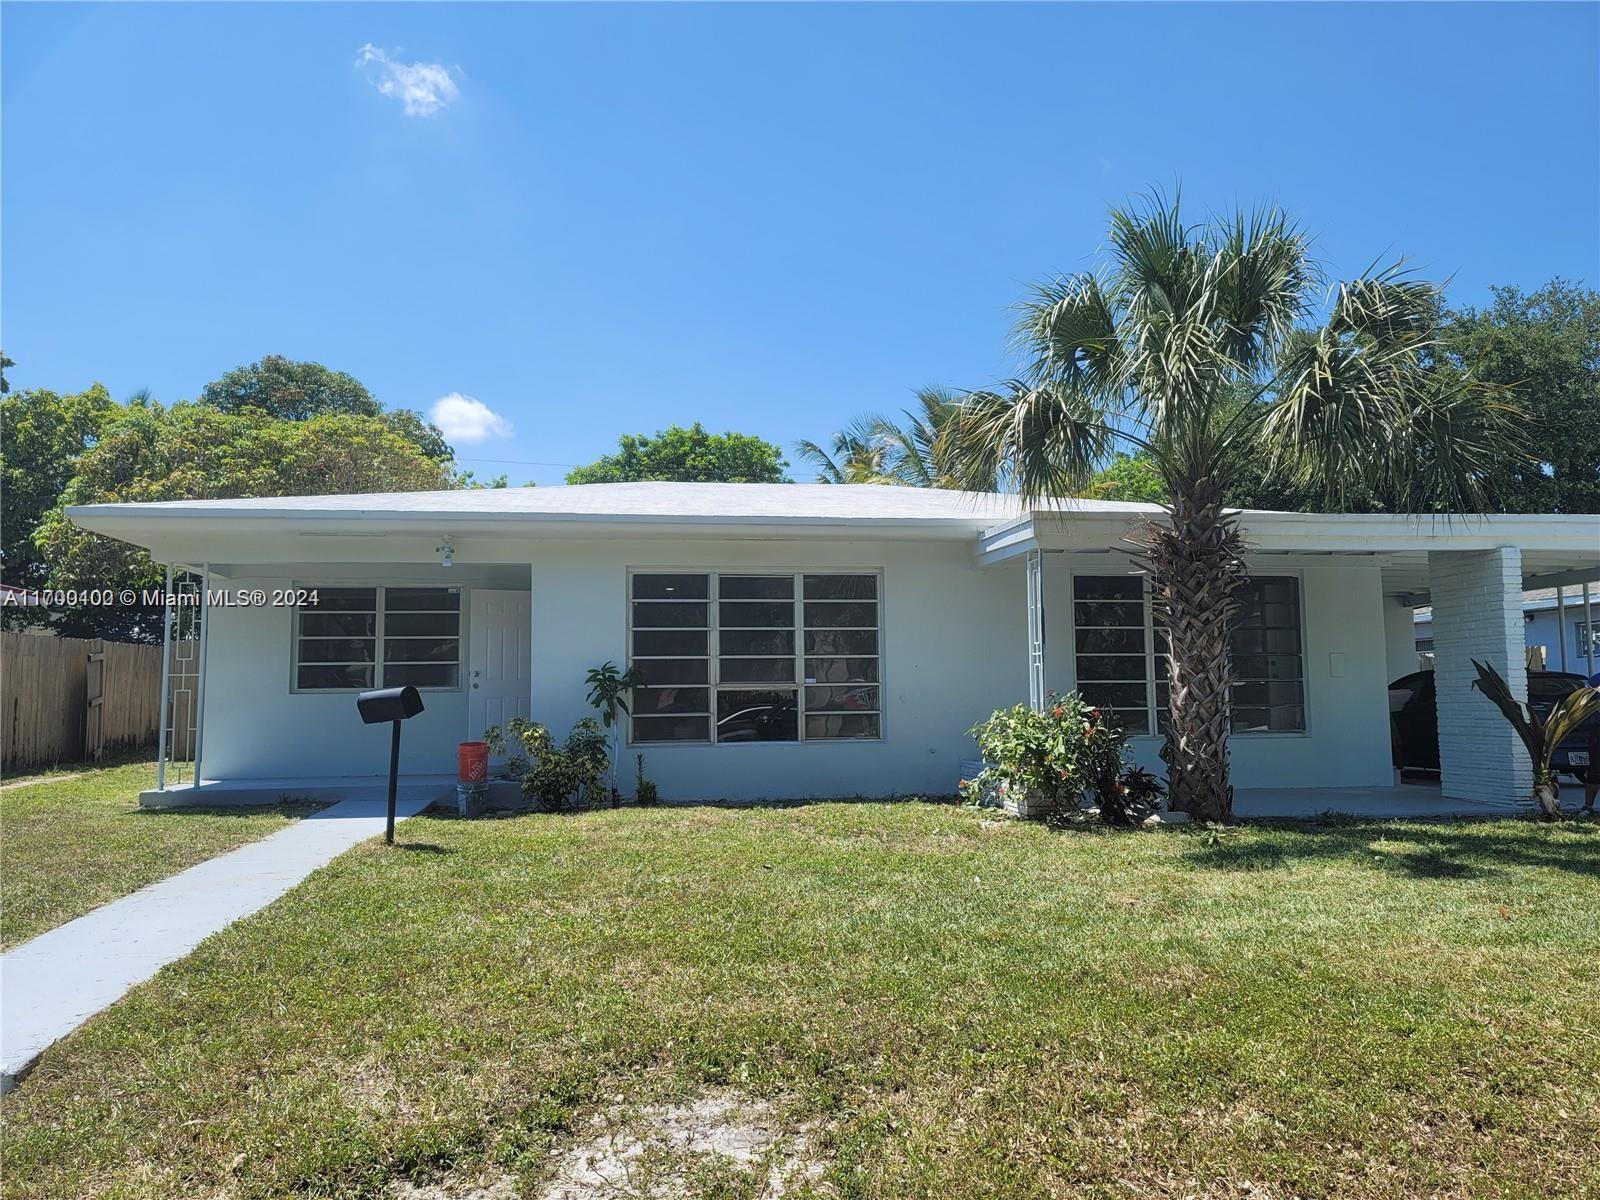
1301 NE Miami Gardens Dr, Miami, FL 33179
$-293
Cash flow
-7.5%
Cash-on-Cash Return
4.4%
Cap rate
1.0%
Rent to Value Ratio
Active
$850,000
3
bds
|
2
ba
|
1,840
sqft
|
built
1986
1717 N Bayshore Dr, Miami, FL 33132
$-2,243
Cash flow
-13.8%
Cash-on-Cash Return
3.0%
Cap rate
0.7%
Rent to Value Ratio
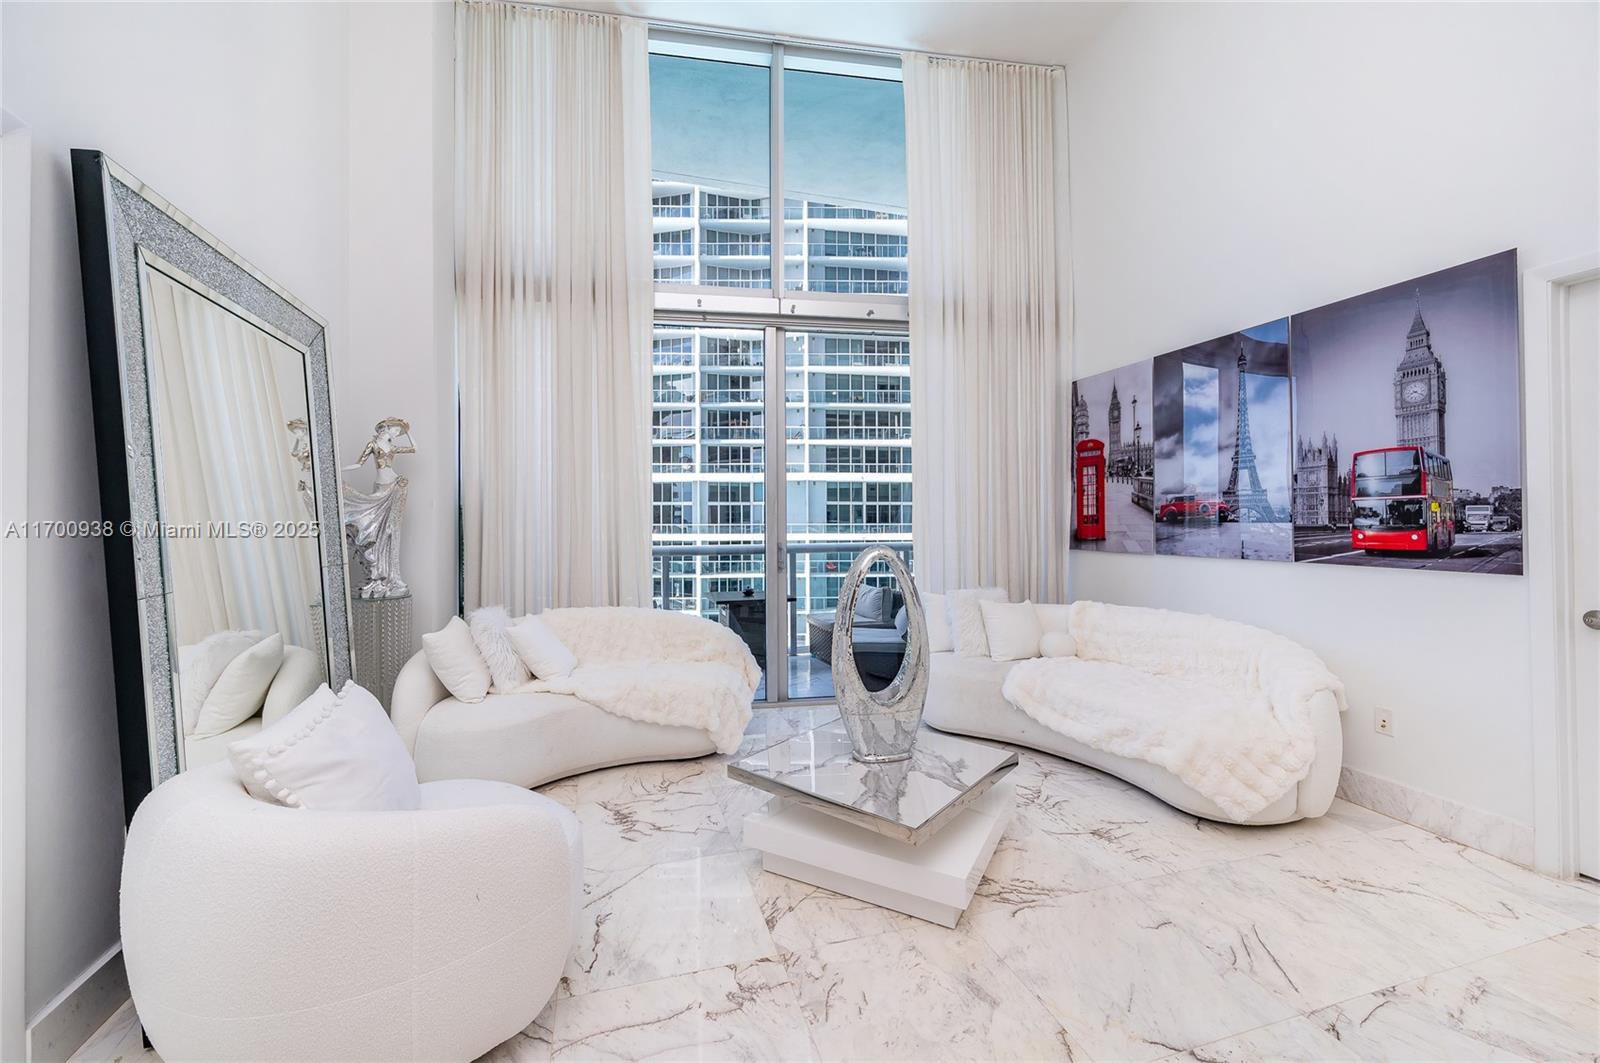
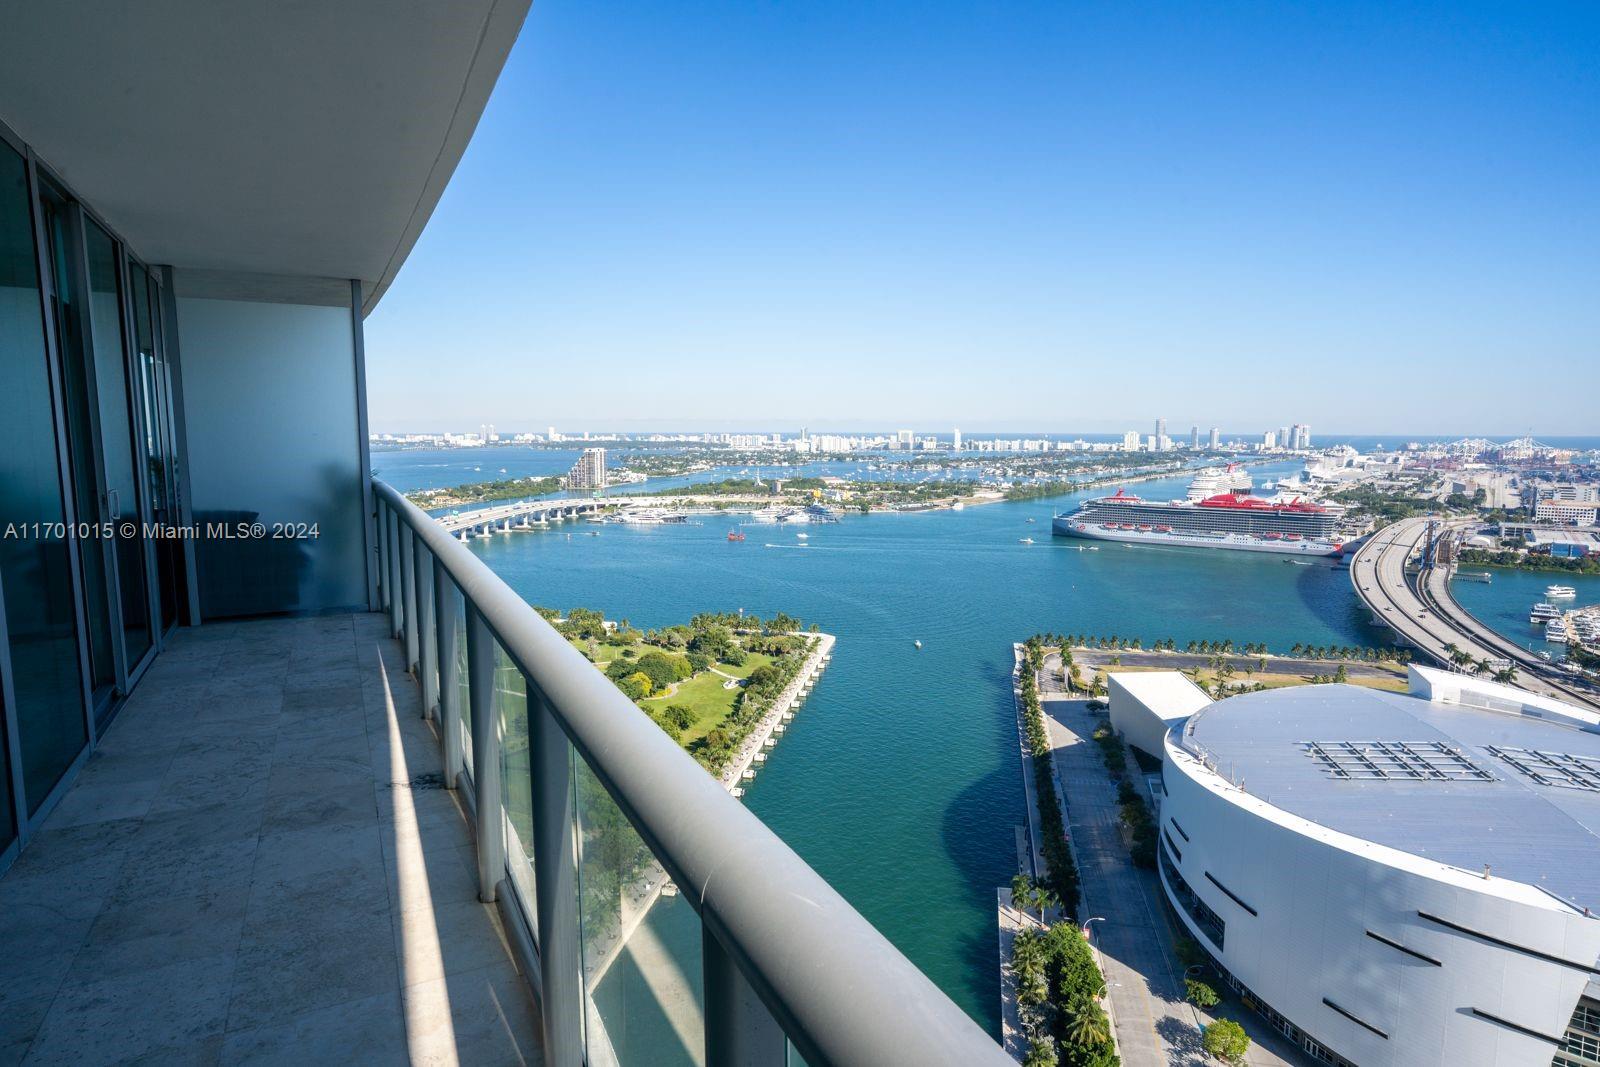
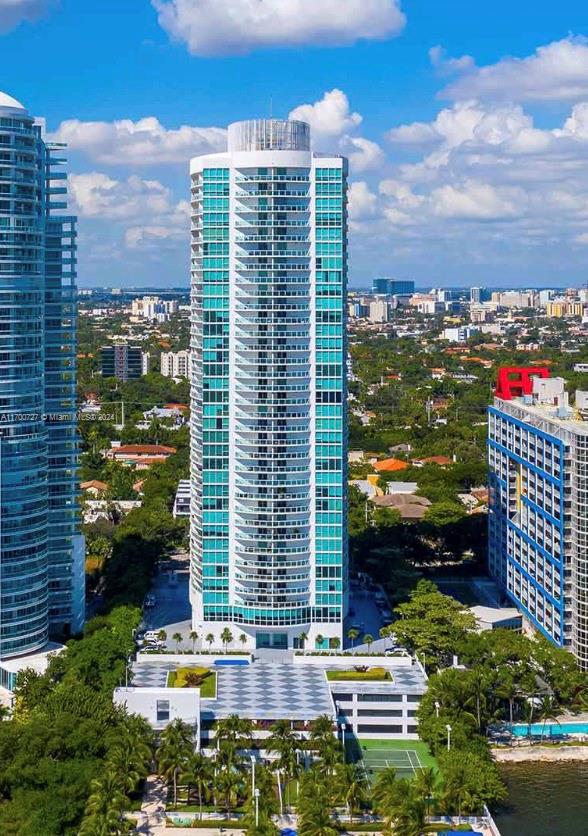
Active
$649,000
1
bds
|
2
ba
|
696
sqft
|
built
2014
1300 Brickell Bay Dr, Miami, FL 33131
$-2,172
Cash flow
-17.5%
Cash-on-Cash Return
2.1%
Cap rate
0.5%
Rent to Value Ratio
Active
$1,450,000
3
bds
|
3
ba
|
1,981
sqft
|
built
1947
354 NW 43rd St, Miami, FL 33127
$-1,762
Cash flow
-6.3%
Cash-on-Cash Return
4.7%
Cap rate
0.6%
Rent to Value Ratio

Active
$8,950,000
5
bds
|
6
ba
|
3,607
sqft
|
built
2016
2675 S Bayshore Dr, Miami, FL 33133
$-51,832
Cash flow
-30.2%
Cash-on-Cash Return
-0.8%
Cap rate
0.1%
Rent to Value Ratio

Active
$1,800,000
3
bds
|
4
ba
|
1,451
sqft
|
built
1925
161 NW 35th St, Miami, FL 33127
$-7,760
Cash flow
-22.5%
Cash-on-Cash Return
1.0%
Cap rate
0.3%
Rent to Value Ratio

Active
$997,000
1
bds
|
2
ba
|
1,022
sqft
|
built
2019
1000 Brickell Ave, Miami, FL 33131
$-4,319
Cash flow
-22.6%
Cash-on-Cash Return
0.9%
Cap rate
0.5%
Rent to Value Ratio
Active
$699,000
1
bds
|
2
ba
|
790
sqft
|
built
2017
2900 NE 7th Ave, Miami, FL 33137
$-2,733
Cash flow
-20.4%
Cash-on-Cash Return
1.5%
Cap rate
0.6%
Rent to Value Ratio
Active
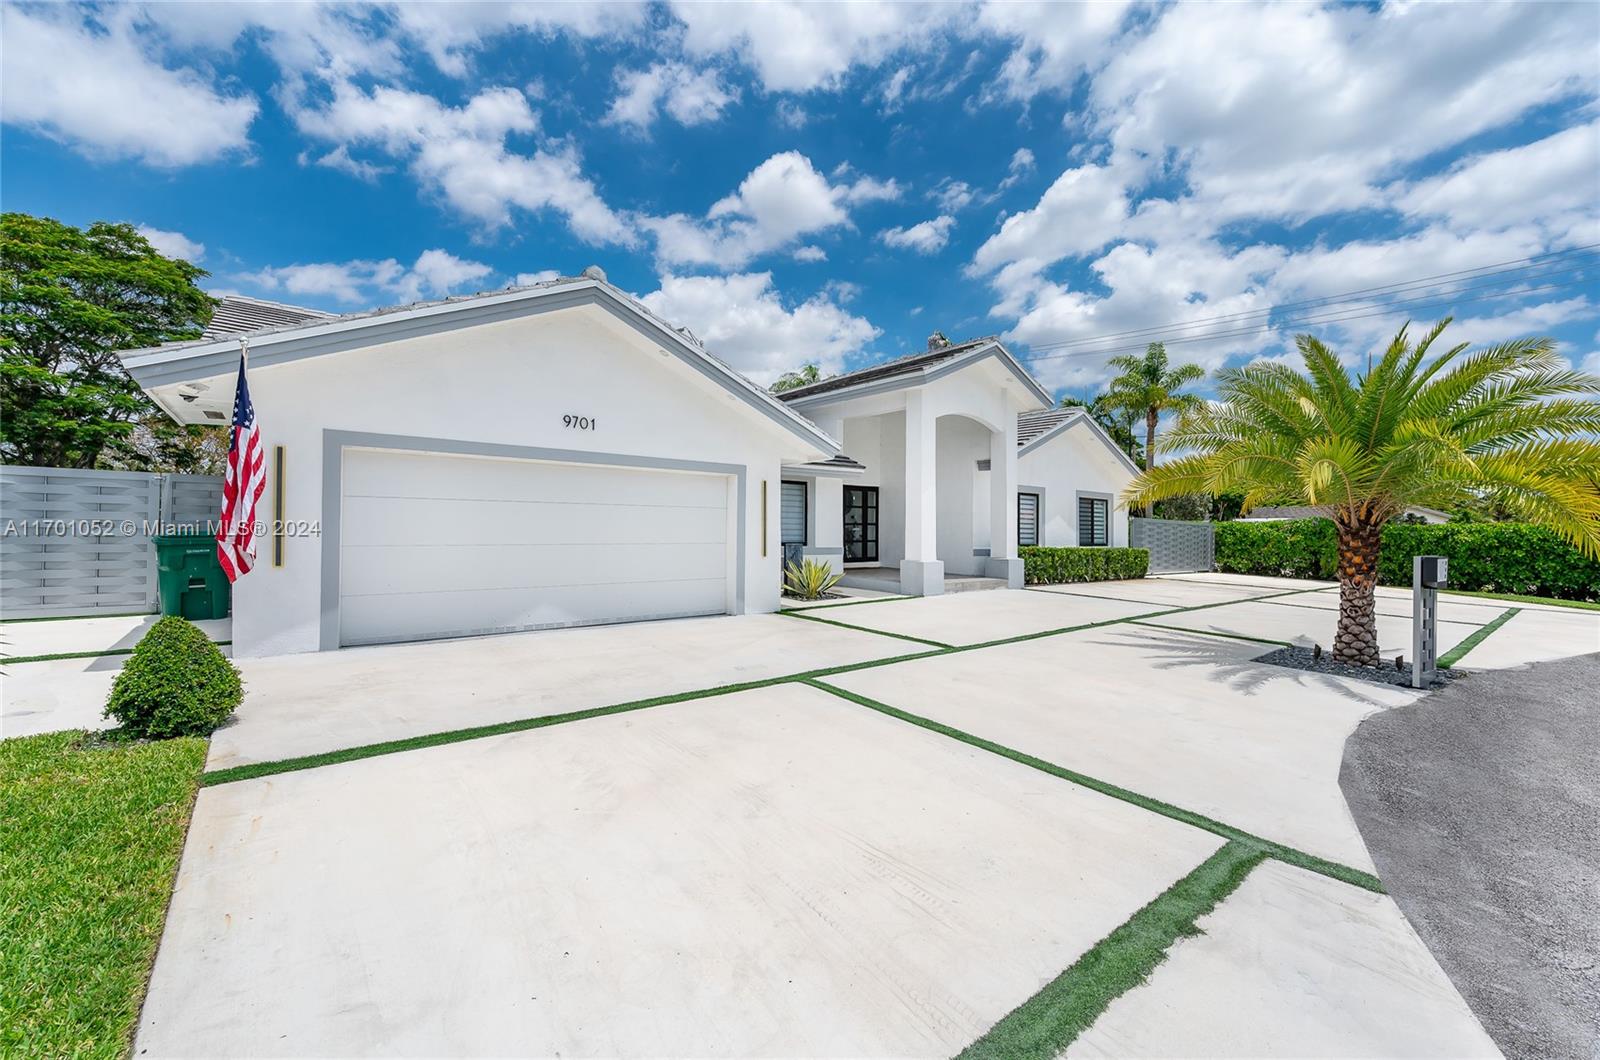
$1,490,000
4
bds
|
4
ba
|
2,578
sqft
|
built
1996
9701 SW 56th Ter, Miami, FL 33173
$-1,884
Cash flow
-6.6%
Cash-on-Cash Return
4.6%
Cap rate
0.7%
Rent to Value Ratio
Active
$1,549,000
2
bds
|
3
ba
|
1,730
sqft
|
built
2004
1331 Brickell Bay Dr, Miami, FL 33131
$-8,702
Cash flow
-29.3%
Cash-on-Cash Return
-0.6%
Cap rate
0.5%
Rent to Value Ratio

Active
$649,000
bds
|
1
ba
|
341
sqft
|
built
2022
398 NE 5th St, Miami, FL 33132
$-2,109
Cash flow
-17.0%
Cash-on-Cash Return
2.2%
Cap rate
0.6%
Rent to Value Ratio
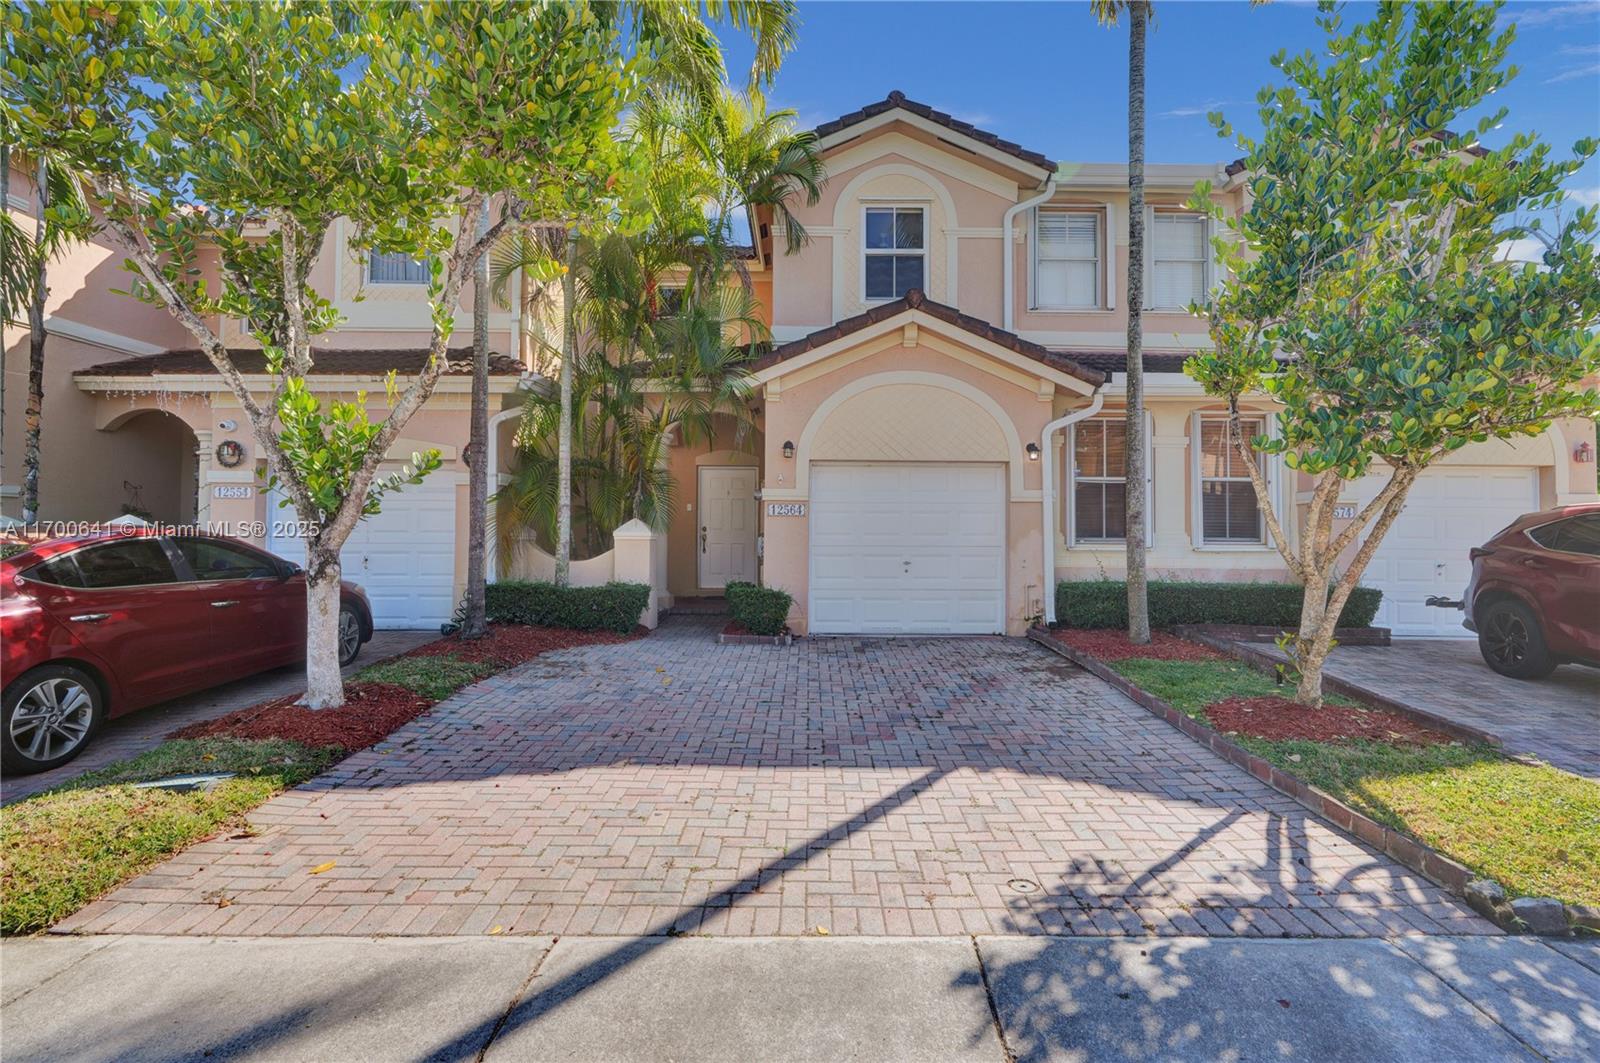
Active
$525,000
3
bds
|
3
ba
|
1,602
sqft
|
built
2002
12564 SW 121st Way, Miami, FL 33186
$-1,415
Cash flow
-14.1%
Cash-on-Cash Return
2.9%
Cap rate
0.6%
Rent to Value Ratio
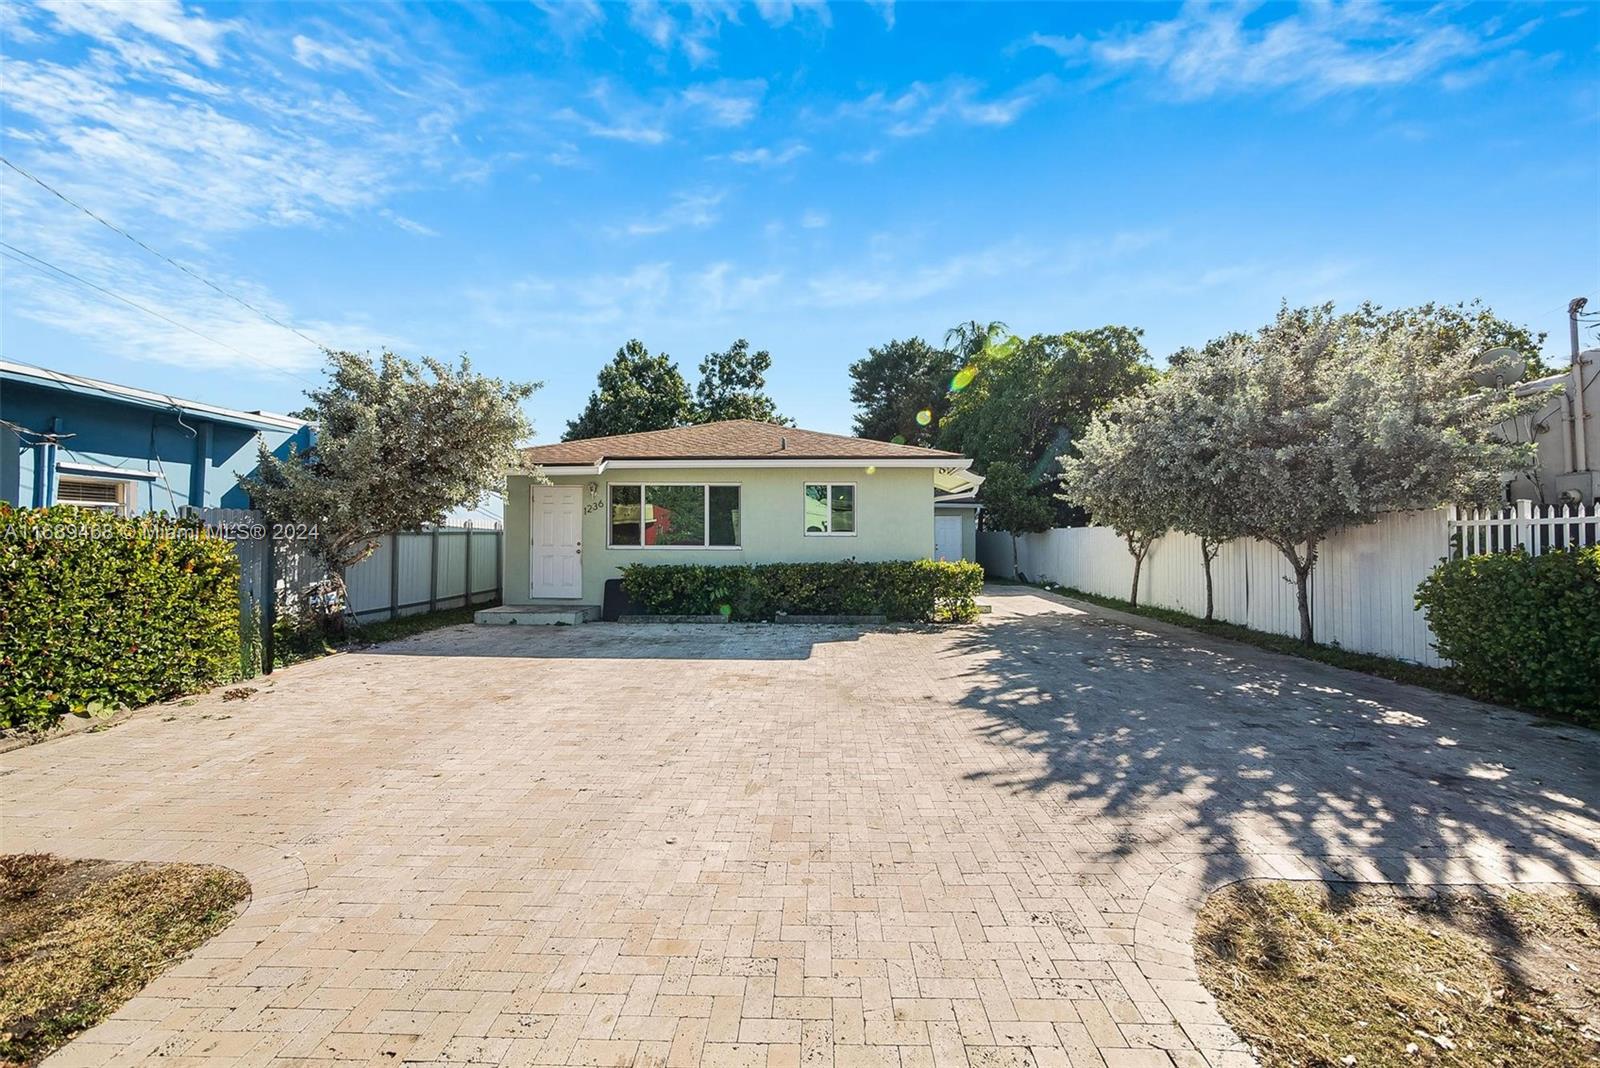
Active
$995,000
6
bds
|
0
ba
|
2,091
sqft
|
built
2020
1236 NW 27th St, Miami, FL 33142
$-3,682
Cash flow
-19.3%
Cash-on-Cash Return
1.7%
Cap rate
0.3%
Rent to Value Ratio
Active
$198,000
2
bds
|
1
ba
|
930
sqft
|
built
1958
483 NW 84th Ln, Miami, FL 33150
$71
Cash flow
1.9%
Cash-on-Cash Return
6.6%
Cap rate
1.1%
Rent to Value Ratio
Active
$1,100,000
2
bds
|
2
ba
|
1,167
sqft
|
built
2008
475 Brickell Ave, Miami, FL 33131
$-4,159
Cash flow
-19.7%
Cash-on-Cash Return
1.6%
Cap rate
0.5%
Rent to Value Ratio
Active
$665,000
1
bds
|
2
ba
|
948
sqft
|
built
2008
888 Biscayne Blvd, Miami, FL 33132
$-1,980
Cash flow
-15.5%
Cash-on-Cash Return
2.6%
Cap rate
0.7%
Rent to Value Ratio
Active
$489,000
1
bds
|
1
ba
|
869
sqft
|
built
2004
2101 Brickell Ave, Miami, FL 33129
$-2,021
Cash flow
-21.6%
Cash-on-Cash Return
1.2%
Cap rate
0.6%
Rent to Value Ratio
Active
$10,875,000
6
bds
|
6
ba
|
4,229
sqft
|
built
1991
4710 Pine Dr, Miami, FL 33143
$-53,818
Cash flow
-25.8%
Cash-on-Cash Return
0.2%
Cap rate
0.1%
Rent to Value Ratio

Active
$1,450,000
3
bds
|
3
ba
|
1,452
sqft
|
built
2018
801 S Miami Ave, Miami, FL 33130
$-6,182
Cash flow
-22.2%
Cash-on-Cash Return
1.0%
Cap rate
0.6%
Rent to Value Ratio
Active
$159,999
1
bds
|
2
ba
|
861
sqft
|
built
1969
1351 NE Miami Gardens Dr, Miami, FL 33179
$194
Cash flow
6.3%
Cash-on-Cash Return
7.6%
Cap rate
1.1%
Rent to Value Ratio
Active
$699,900
3
bds
|
0
ba
|
1,663
sqft
|
built
1948
3041 NW 10th Ave, Miami, FL 33127
$-2,443
Cash flow
-18.2%
Cash-on-Cash Return
2.0%
Cap rate
0.4%
Rent to Value Ratio
Active
$480,000
3
bds
|
2
ba
|
1,240
sqft
|
built
1984
7730 SW 156th Ct, Miami, FL 33193
$-666
Cash flow
-7.2%
Cash-on-Cash Return
4.5%
Cap rate
0.7%
Rent to Value Ratio
Active
$3,000,000
6
bds
|
7
ba
|
3,742
sqft
|
built
1994
1000 NE 89th St, Miami, FL 33138
$-12,008
Cash flow
-20.9%
Cash-on-Cash Return
1.3%
Cap rate
0.3%
Rent to Value Ratio
Active
$699,900
6
bds
|
0
ba
|
2,483
sqft
|
built
1955
16900 NE 23rd Ave, Miami, FL 33160
$-2,036
Cash flow
-15.2%
Cash-on-Cash Return
2.7%
Cap rate
0.4%
Rent to Value Ratio
Active
$485,000
1
bds
|
1
ba
|
846
sqft
|
built
2005
325 S Biscayne Blvd, Miami, FL 33131
$-6,811
Cash flow
-73.3%
Cash-on-Cash Return
-10.7%
Cap rate
0.6%
Rent to Value Ratio
Active
$409,000
2
bds
|
1
ba
|
966
sqft
|
built
1937
1304 NW 43rd St, Miami, FL 33142
$-645
Cash flow
-8.2%
Cash-on-Cash Return
4.3%
Cap rate
0.7%
Rent to Value Ratio