Miami, FL Investment Properties for Sale
Browse homes for sale and investment properties in Miami, FL. Refine your search by price, property type, or more.
Best cash flowing properties in Miami, FL
Active
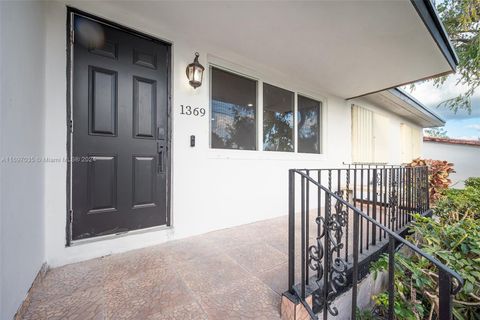
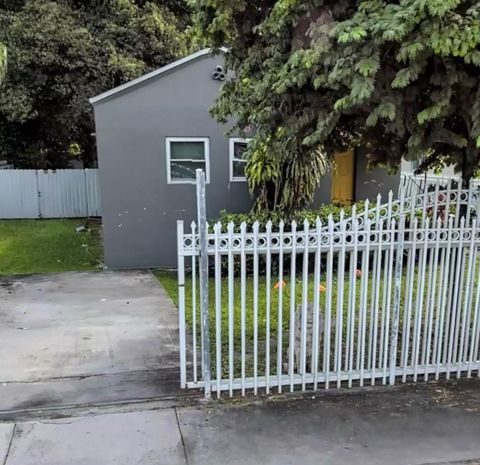
$518,000
3
bds
|
2
ba
|
1,553
sqft
|
built
1959
1369 NW 96th St, Miami, FL 33147
$-223
Cash flow
-2.2%
Cash-on-Cash Return
5.6%
Cap rate
0.8%
Rent to Value Ratio

Active
$255,000
2
bds
|
1
ba
|
775
sqft
|
built
1968
11195 SW 1st St, Miami, FL 33174
$-391
Cash flow
-8.0%
Cash-on-Cash Return
4.3%
Cap rate
0.9%
Rent to Value Ratio
6,092 out of 6,920 properties for sale in Miami, FL
Limited Results Shown
Create a free account, or log in to reveal all property listings and enjoy the complete experience.

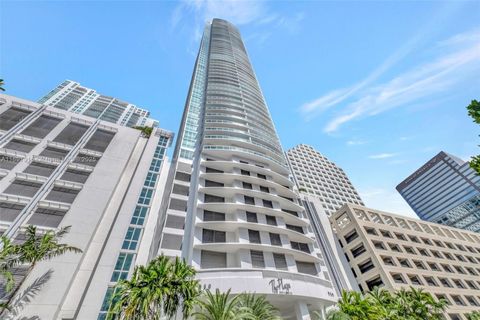
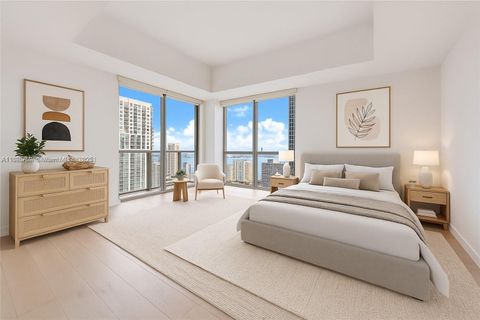
Active
$739,000
2
bds
|
2
ba
|
1,197
sqft
|
built
2008
500 Brickell Ave, Miami, FL 33131
$-2,420
Cash flow
-17.1%
Cash-on-Cash Return
2.2%
Cap rate
0.6%
Rent to Value Ratio

Active
$400,000
2
bds
|
1
ba
|
804
sqft
|
built
1936
1918 NW 82nd St, Miami, FL 33147
$-636
Cash flow
-8.3%
Cash-on-Cash Return
4.2%
Cap rate
0.7%
Rent to Value Ratio
Active
$524,000
3
bds
|
1
ba
|
1,089
sqft
|
built
1959
9780 SW 167th St, Miami, FL 33157
$-979
Cash flow
-9.7%
Cash-on-Cash Return
3.9%
Cap rate
0.6%
Rent to Value Ratio
Active
$2,999,999
5
bds
|
4
ba
|
3,134
sqft
|
built
1989
10 SW 124th Ave, Miami, FL 33184
$-9,428
Cash flow
-16.4%
Cash-on-Cash Return
2.4%
Cap rate
0.4%
Rent to Value Ratio

Active
$513,000
2
bds
|
1
ba
|
1,451
sqft
|
built
1941
2030 NW 34th St, Miami, FL 33142
$-1,133
Cash flow
-11.5%
Cash-on-Cash Return
3.5%
Cap rate
0.6%
Rent to Value Ratio
Active
$617,500
3
bds
|
2
ba
|
1,280
sqft
|
built
1950
810 NW 43rd St, Miami, FL 33127
$-1,326
Cash flow
-11.2%
Cash-on-Cash Return
3.6%
Cap rate
0.6%
Rent to Value Ratio

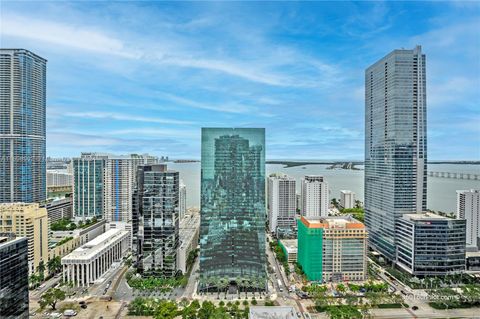
Active
$625,000
2
bds
|
2
ba
|
1,169
sqft
|
built
2005
335 S Biscayne Blvd, Miami, FL 33131
$-2,532
Cash flow
-21.1%
Cash-on-Cash Return
1.3%
Cap rate
0.6%
Rent to Value Ratio
Active
$255,000
2
bds
|
1
ba
|
775
sqft
|
built
1968
11195 SW 1st St, Miami, FL 33174
$-391
Cash flow
-8.0%
Cash-on-Cash Return
4.3%
Cap rate
0.9%
Rent to Value Ratio
Active
$516,800
4
bds
|
3
ba
|
1,600
sqft
|
built
1997
8356 NW 10th St, Miami, FL 33126
$-1,151
Cash flow
-11.6%
Cash-on-Cash Return
3.5%
Cap rate
0.7%
Rent to Value Ratio
Active
$745,000
3
bds
|
3
ba
|
1,517
sqft
|
built
1997
14584 SW 115th St, Miami, FL 33186
$-984
Cash flow
-6.9%
Cash-on-Cash Return
4.6%
Cap rate
0.7%
Rent to Value Ratio

Active
$800,000
5
bds
|
2
ba
|
2,442
sqft
|
built
1925
536 SW 3rd St, Miami, FL 33130
$-2,512
Cash flow
-16.4%
Cash-on-Cash Return
2.4%
Cap rate
0.4%
Rent to Value Ratio
Active
$304,900
2
bds
|
1
ba
|
725
sqft
|
built
1949
3530 SW 9th Ter, Miami, FL 33135
$-644
Cash flow
-11.0%
Cash-on-Cash Return
3.6%
Cap rate
0.8%
Rent to Value Ratio

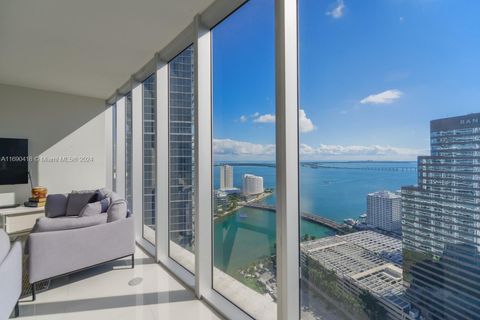
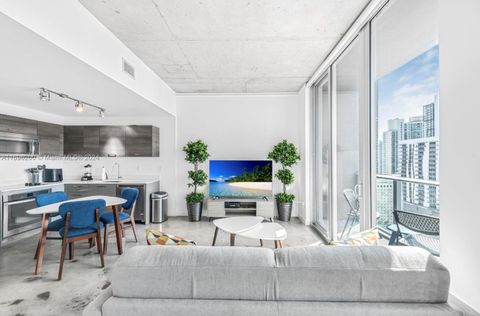
Active
$760,000
1
bds
|
1
ba
|
790
sqft
|
built
2009
485 Brickell Ave, Miami, FL 33131
$-2,645
Cash flow
-18.2%
Cash-on-Cash Return
2.0%
Cap rate
0.6%
Rent to Value Ratio
Active
$505,900
2
bds
|
2
ba
|
1,465
sqft
|
built
1981
13380 SW 91st Ter, Miami, FL 33186
$-985
Cash flow
-10.2%
Cash-on-Cash Return
3.8%
Cap rate
0.6%
Rent to Value Ratio

Active
$232,990
1
bds
|
1
ba
|
689
sqft
|
built
1986
15530 SW 80th St, Miami, FL 33193
$-441
Cash flow
-9.9%
Cash-on-Cash Return
3.9%
Cap rate
0.8%
Rent to Value Ratio
Active
$440,000
1
bds
|
1
ba
|
688
sqft
|
built
2008
950 Brickell Bay Dr, Miami, FL 33131
$-1,013
Cash flow
-12.0%
Cash-on-Cash Return
3.4%
Cap rate
0.8%
Rent to Value Ratio
Active
$552,000
2
bds
|
2
ba
|
1,200
sqft
|
built
2007
3232 SW 22nd Ter, Miami, FL 33145
$-2,284
Cash flow
-21.6%
Cash-on-Cash Return
1.2%
Cap rate
0.6%
Rent to Value Ratio

Active
$19,900,000
6
bds
|
8
ba
|
7,061
sqft
|
built
2006
2627 S Bayshore Dr, Miami, FL 33133
$-116,756
Cash flow
-30.6%
Cash-on-Cash Return
-0.9%
Cap rate
0.1%
Rent to Value Ratio
Active
$294,000
2
bds
|
2
ba
|
750
sqft
|
built
1983
14915 SW 104th St, Miami, FL 33196
$-478
Cash flow
-8.5%
Cash-on-Cash Return
4.2%
Cap rate
0.8%
Rent to Value Ratio
Active
$639,000
1
bds
|
1
ba
|
699
sqft
|
built
2016
1300 S Miami Ave, Miami, FL 33130
$-2,164
Cash flow
-17.7%
Cash-on-Cash Return
2.1%
Cap rate
0.6%
Rent to Value Ratio

Active
$780,000
2
bds
|
3
ba
|
1,178
sqft
|
built
2018
488 NE 18th St, Miami, FL 33132
$-2,452
Cash flow
-16.4%
Cash-on-Cash Return
2.4%
Cap rate
0.7%
Rent to Value Ratio

Active
$739,000
2
bds
|
2
ba
|
972
sqft
|
built
2018
121 NE 34th St, Miami, FL 33137
$-3,576
Cash flow
-25.2%
Cash-on-Cash Return
0.3%
Cap rate
0.5%
Rent to Value Ratio
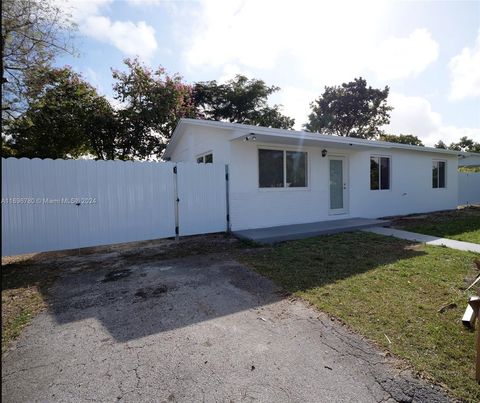
Active
$400,000
3
bds
|
1
ba
|
968
sqft
|
built
1936
4133 NW 22nd Ct, Miami, FL 33142
$-494
Cash flow
-6.4%
Cash-on-Cash Return
4.7%
Cap rate
0.7%
Rent to Value Ratio
Active
$875,000
2
bds
|
3
ba
|
1,368
sqft
|
built
2008
1060 Brickell Ave, Miami, FL 33131
$-2,362
Cash flow
-14.1%
Cash-on-Cash Return
2.9%
Cap rate
0.8%
Rent to Value Ratio
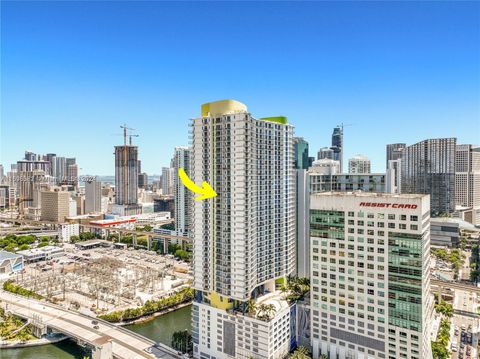
Active
$625,000
1
bds
|
1
ba
|
699
sqft
|
built
2016
1300 S Miami Ave, Miami, FL 33130
$-2,087
Cash flow
-17.4%
Cash-on-Cash Return
2.1%
Cap rate
0.6%
Rent to Value Ratio
Active
$1,250,000
2
bds
|
2
ba
|
1,459
sqft
|
built
2009
485 Brickell Ave, Miami, FL 33131
$-4,424
Cash flow
-18.5%
Cash-on-Cash Return
1.9%
Cap rate
0.6%
Rent to Value Ratio
Active
$518,000
3
bds
|
2
ba
|
1,553
sqft
|
built
1959
1369 NW 96th St, Miami, FL 33147
$-223
Cash flow
-2.2%
Cash-on-Cash Return
5.6%
Cap rate
0.8%
Rent to Value Ratio

Active
$360,000
3
bds
|
2
ba
|
1,262
sqft
|
built
1967
9456 SW 77th Ave, Miami, FL 33156
$-991
Cash flow
-14.4%
Cash-on-Cash Return
2.8%
Cap rate
0.8%
Rent to Value Ratio
Active
$550,000
2
bds
|
2
ba
|
968
sqft
|
built
1990
770 Claughton Island Dr, Miami, FL 33131
$-2,108
Cash flow
-20.0%
Cash-on-Cash Return
1.5%
Cap rate
0.7%
Rent to Value Ratio

Active
$525,000
1
bds
|
2
ba
|
776
sqft
|
built
2017
55 SW 9th St, Miami, FL 33130
$-2,084
Cash flow
-20.7%
Cash-on-Cash Return
1.4%
Cap rate
0.7%
Rent to Value Ratio
Active
$650,000
1
bds
|
2
ba
|
706
sqft
|
built
2018
650 NE 32nd St, Miami, FL 33137
$-1,839
Cash flow
-14.8%
Cash-on-Cash Return
2.8%
Cap rate
0.7%
Rent to Value Ratio
Active
$300,000
1
bds
|
1
ba
|
685
sqft
|
built
2005
234 NE 3rd St, Miami, FL 33132
$-839
Cash flow
-14.6%
Cash-on-Cash Return
2.8%
Cap rate
0.9%
Rent to Value Ratio

Active
$649,000
2
bds
|
2
ba
|
1,058
sqft
|
built
2008
253 NE 2nd St, Miami, FL 33132
$-2,572
Cash flow
-20.7%
Cash-on-Cash Return
1.4%
Cap rate
0.6%
Rent to Value Ratio
Active
$435,000
1
bds
|
1
ba
|
846
sqft
|
built
2005
335 S Biscayne Blvd, Miami, FL 33131
$-1,586
Cash flow
-19.0%
Cash-on-Cash Return
1.8%
Cap rate
0.7%
Rent to Value Ratio
Active
$390,000
1
bds
|
1
ba
|
533
sqft
|
built
2016
151 SE 1st St, Miami, FL 33131
$-1,147
Cash flow
-15.3%
Cash-on-Cash Return
2.6%
Cap rate
0.7%
Rent to Value Ratio
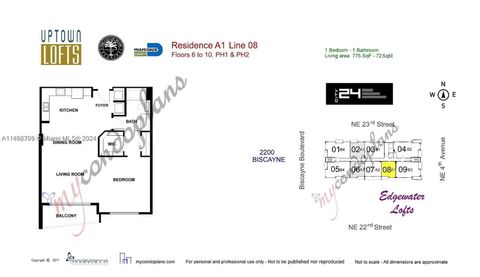
Active
$350,000
1
bds
|
1
ba
|
775
sqft
|
built
2005
2275 Biscayne Blvd, Miami, FL 33137
$-1,255
Cash flow
-18.7%
Cash-on-Cash Return
1.8%
Cap rate
0.7%
Rent to Value Ratio
Active
$585,000
3
bds
|
2
ba
|
1,039
sqft
|
built
1970
11460 SW 196th Ter, Miami, FL 33157
$-885
Cash flow
-7.9%
Cash-on-Cash Return
4.3%
Cap rate
0.5%
Rent to Value Ratio

Active
$670,000
3
bds
|
2
ba
|
1,514
sqft
|
built
1972
8124 SW 81st Ter, Miami, FL 33143
$-1,386
Cash flow
-10.8%
Cash-on-Cash Return
3.7%
Cap rate
0.5%
Rent to Value Ratio
Active
$349,000
1
bds
|
1
ba
|
580
sqft
|
built
2007
185 SW 7th St, Miami, FL 33130
$-726
Cash flow
-10.9%
Cash-on-Cash Return
3.7%
Cap rate
0.8%
Rent to Value Ratio
Active
$1,950,000
2
bds
|
3
ba
|
1,946
sqft
|
built
2003
1435 Brickell Ave, Miami, FL 33131
$-10,217
Cash flow
-27.3%
Cash-on-Cash Return
-0.1%
Cap rate
0.4%
Rent to Value Ratio