Miami, FL Investment Properties for Sale
Browse homes for sale and investment properties in Miami, FL. Refine your search by price, property type, or more.
Best cash flowing properties in Miami, FL
Active
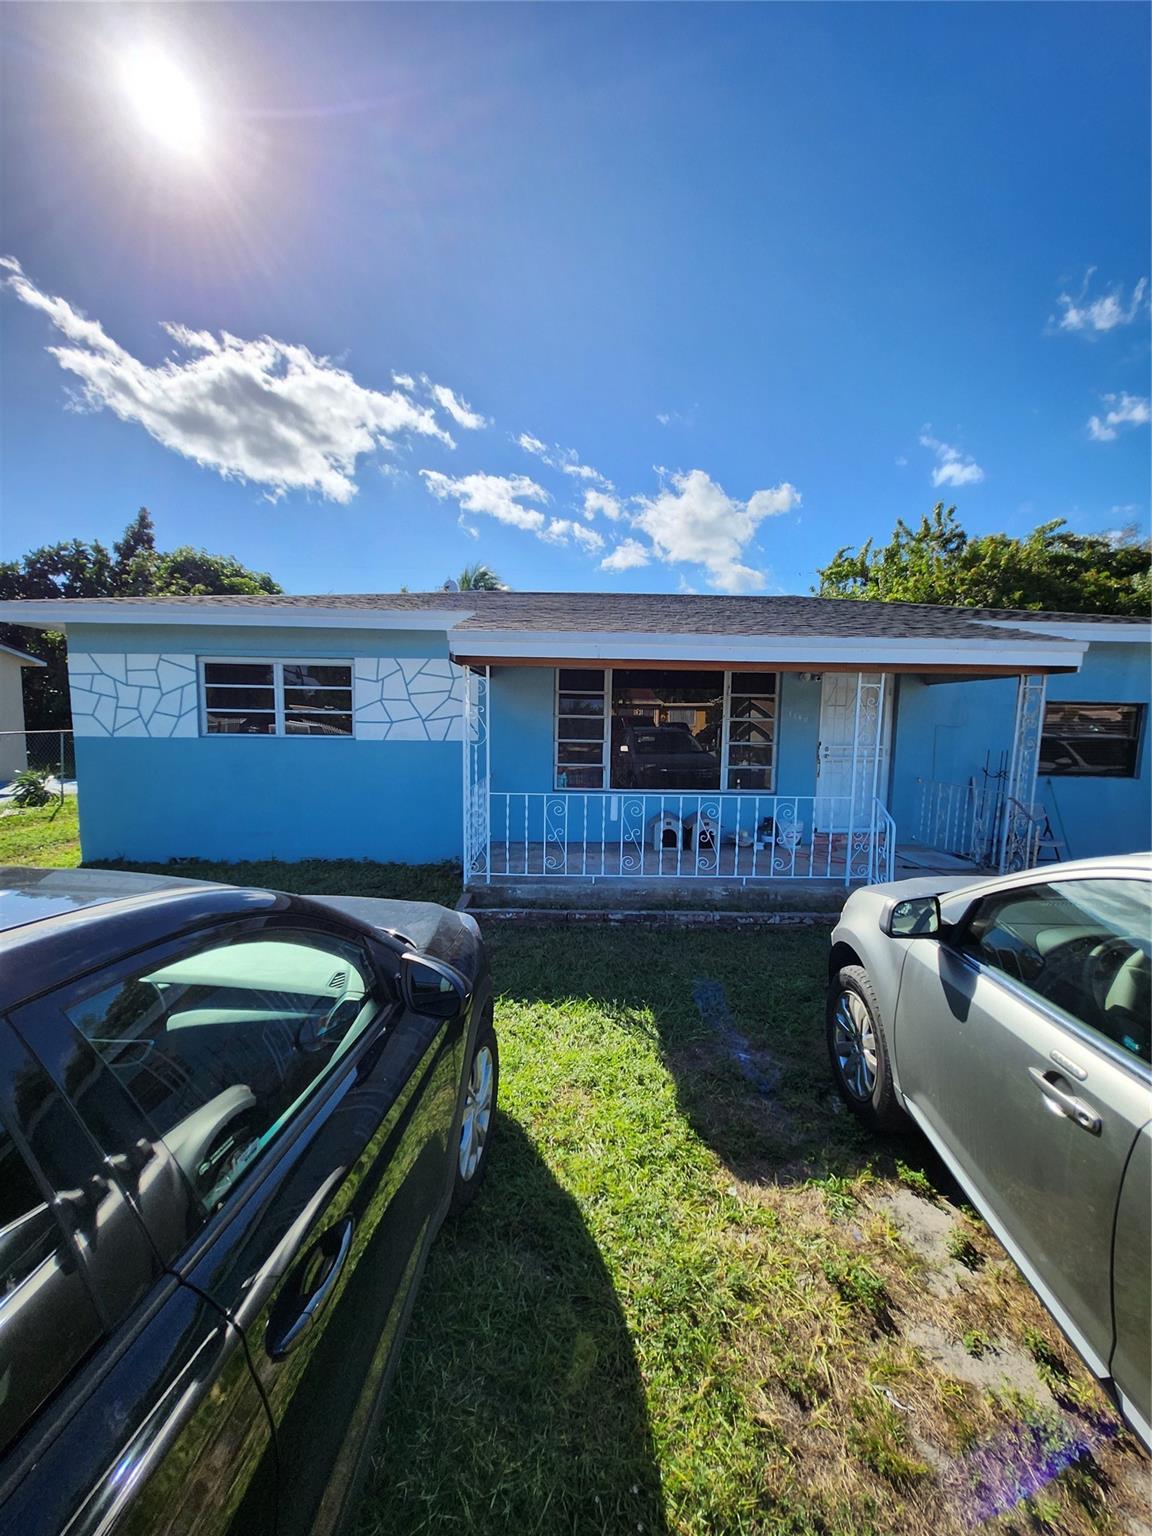
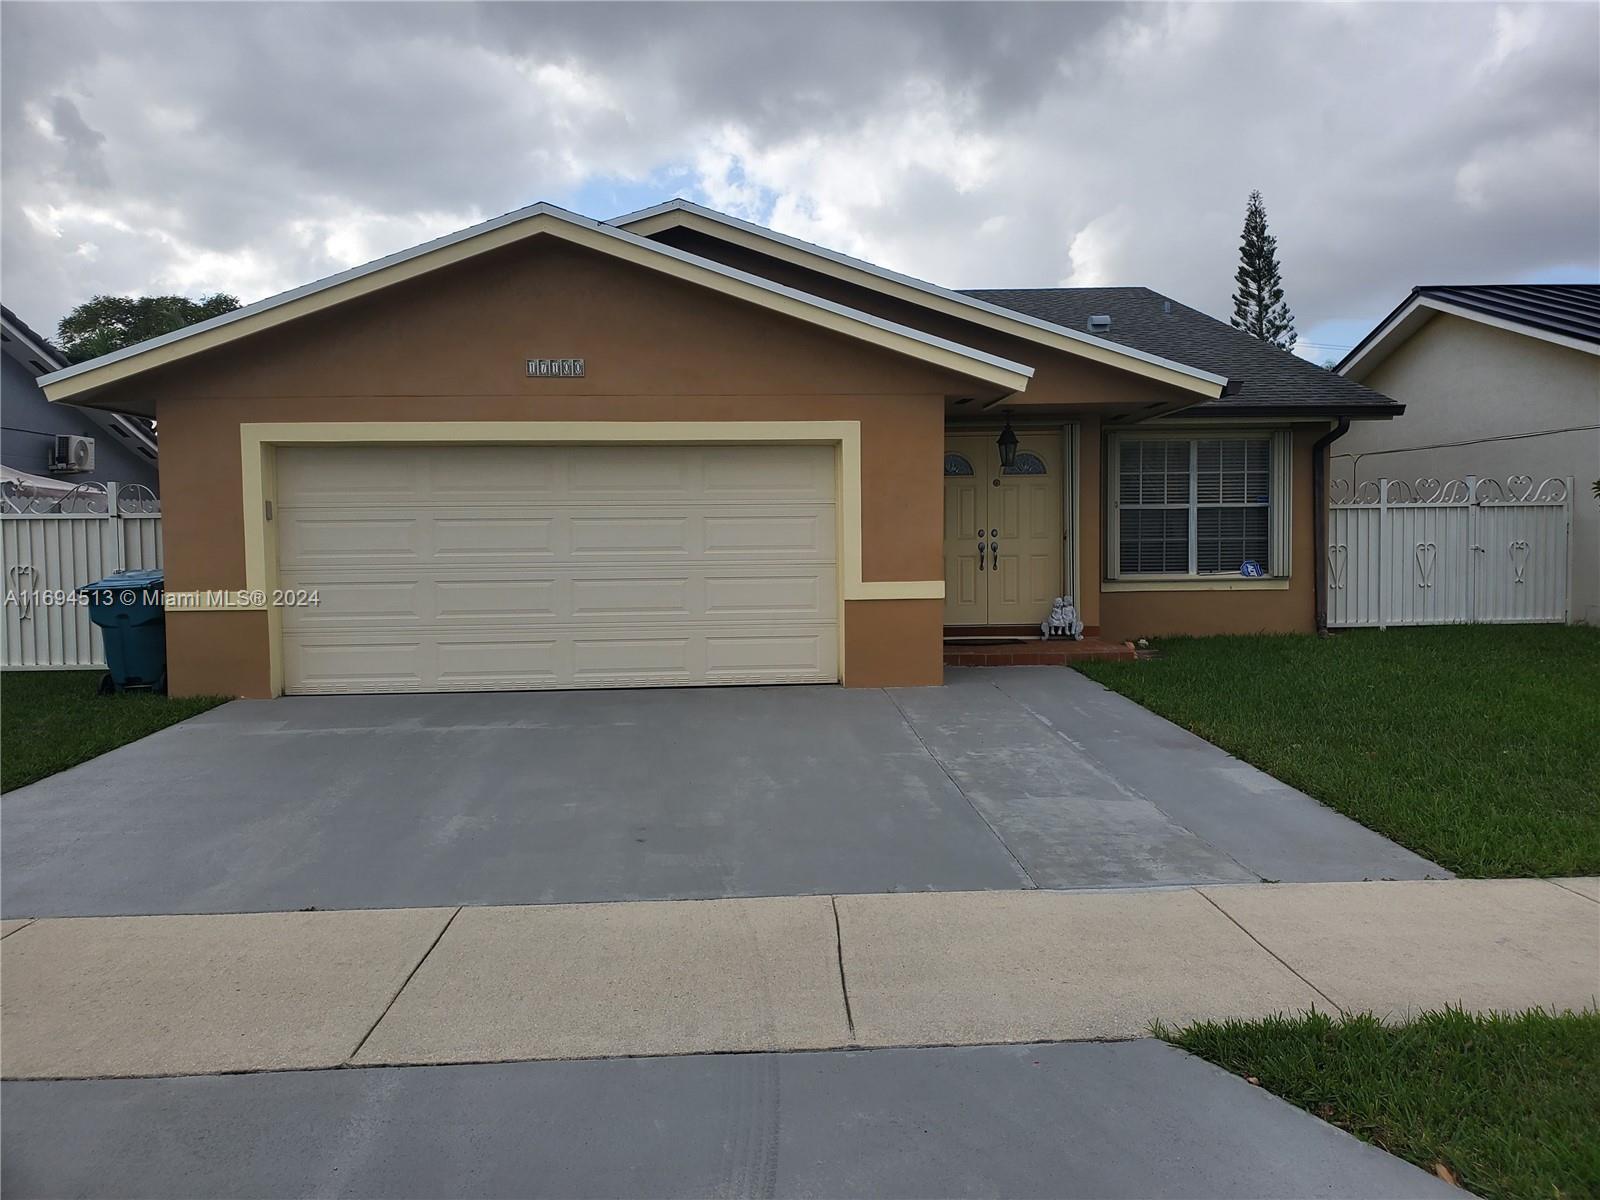
$425,000
2
bds
|
2
ba
|
1,212
sqft
|
built
1956
1140 NW 111th St, Miami, FL 33168
$-396
Cash flow
-4.9%
Cash-on-Cash Return
5.0%
Cap rate
0.7%
Rent to Value Ratio

Active
$299,900
2
bds
|
2
ba
|
985
sqft
|
built
1981
8415 SW 107th Ave, Miami, FL 33173
$-523
Cash flow
-9.1%
Cash-on-Cash Return
4.1%
Cap rate
0.8%
Rent to Value Ratio
6,092 out of 6,920 properties for sale in Miami, FL
Limited Results Shown
Create a free account, or log in to reveal all property listings and enjoy the complete experience.
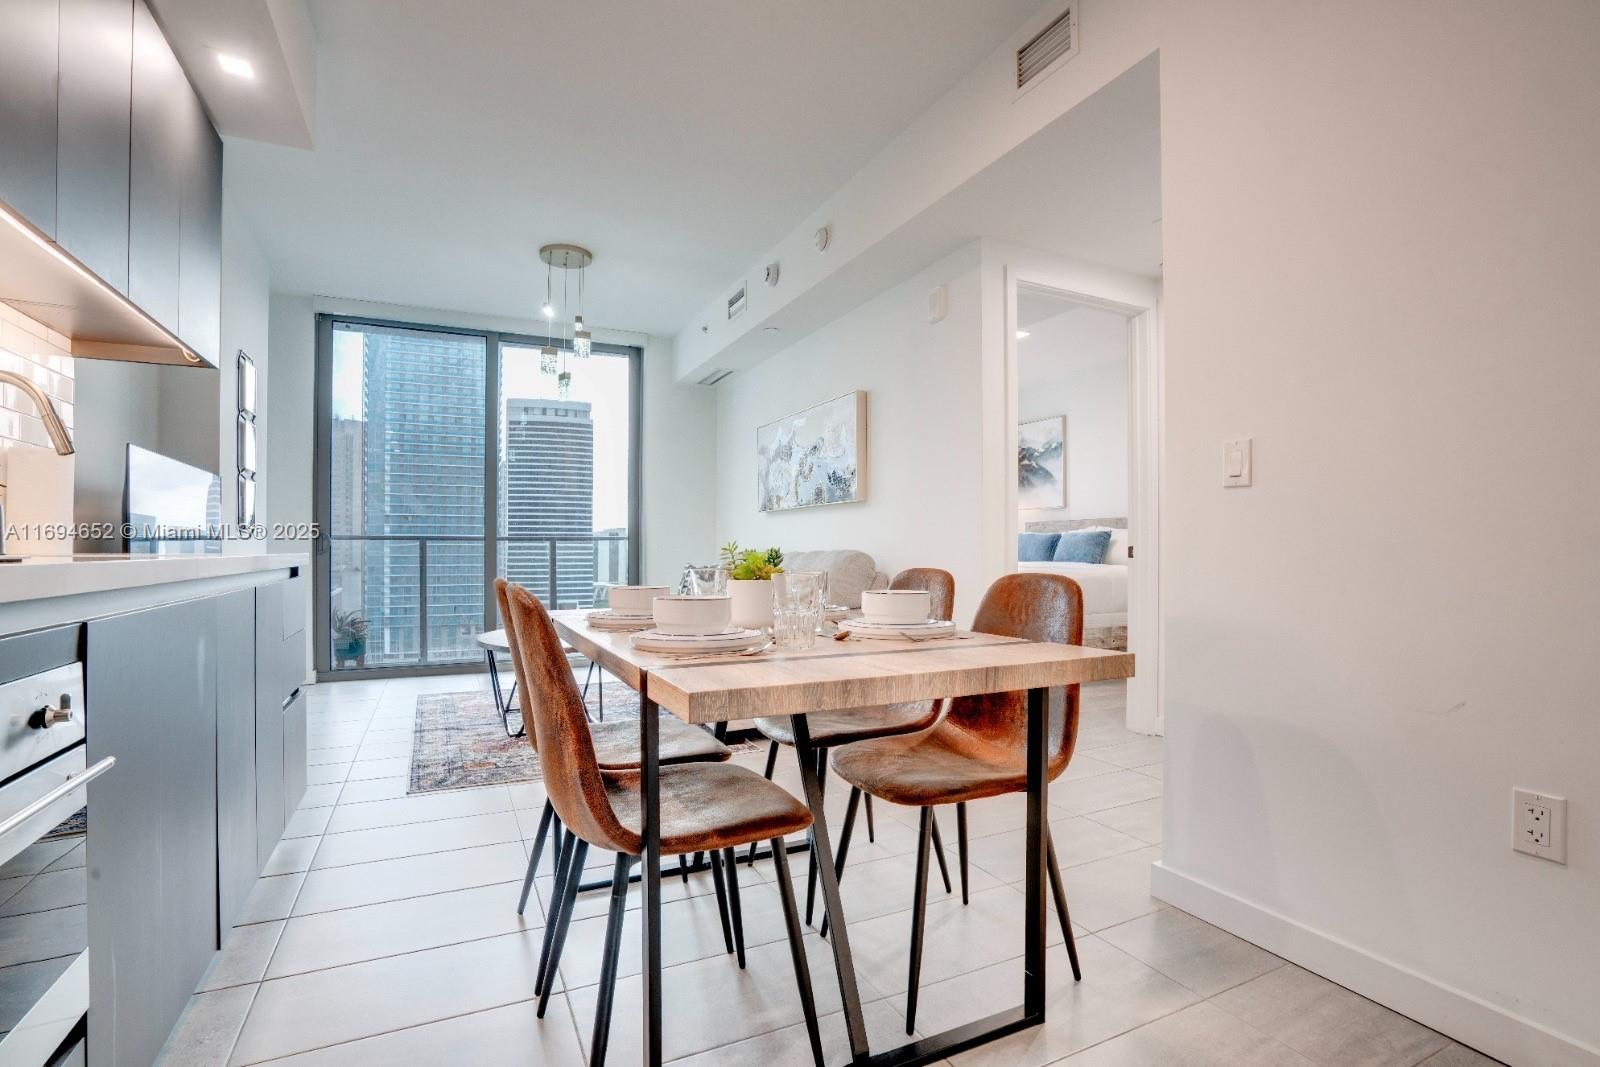
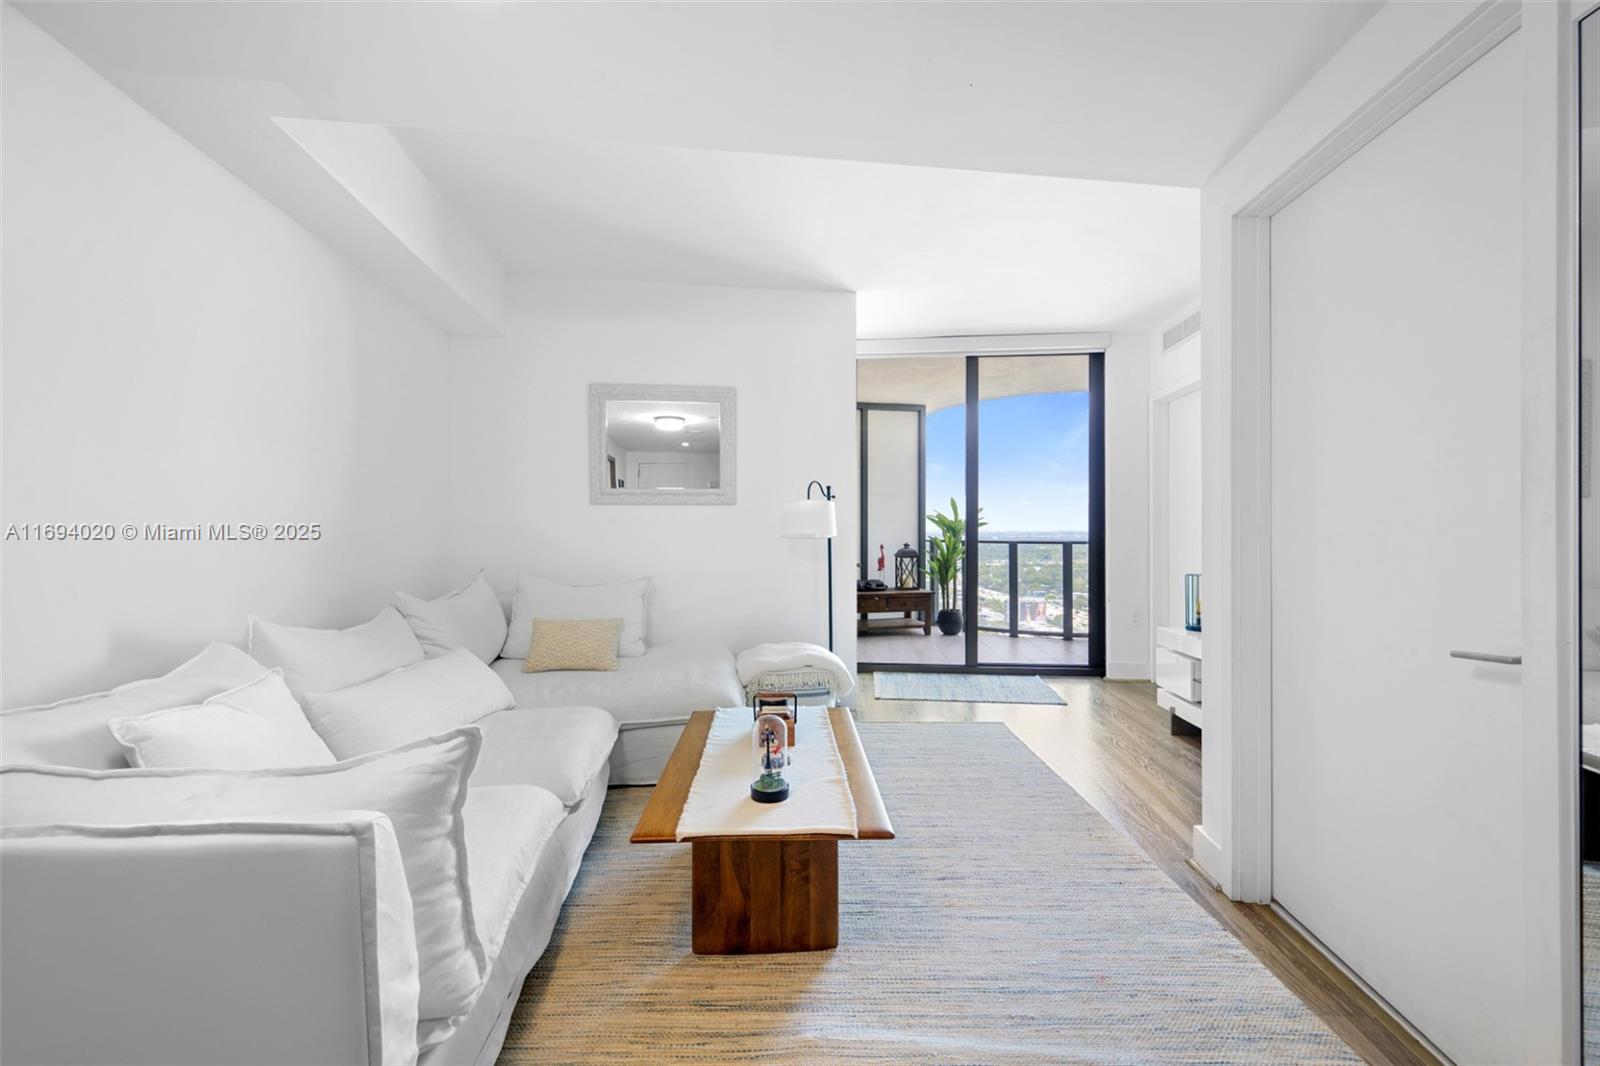
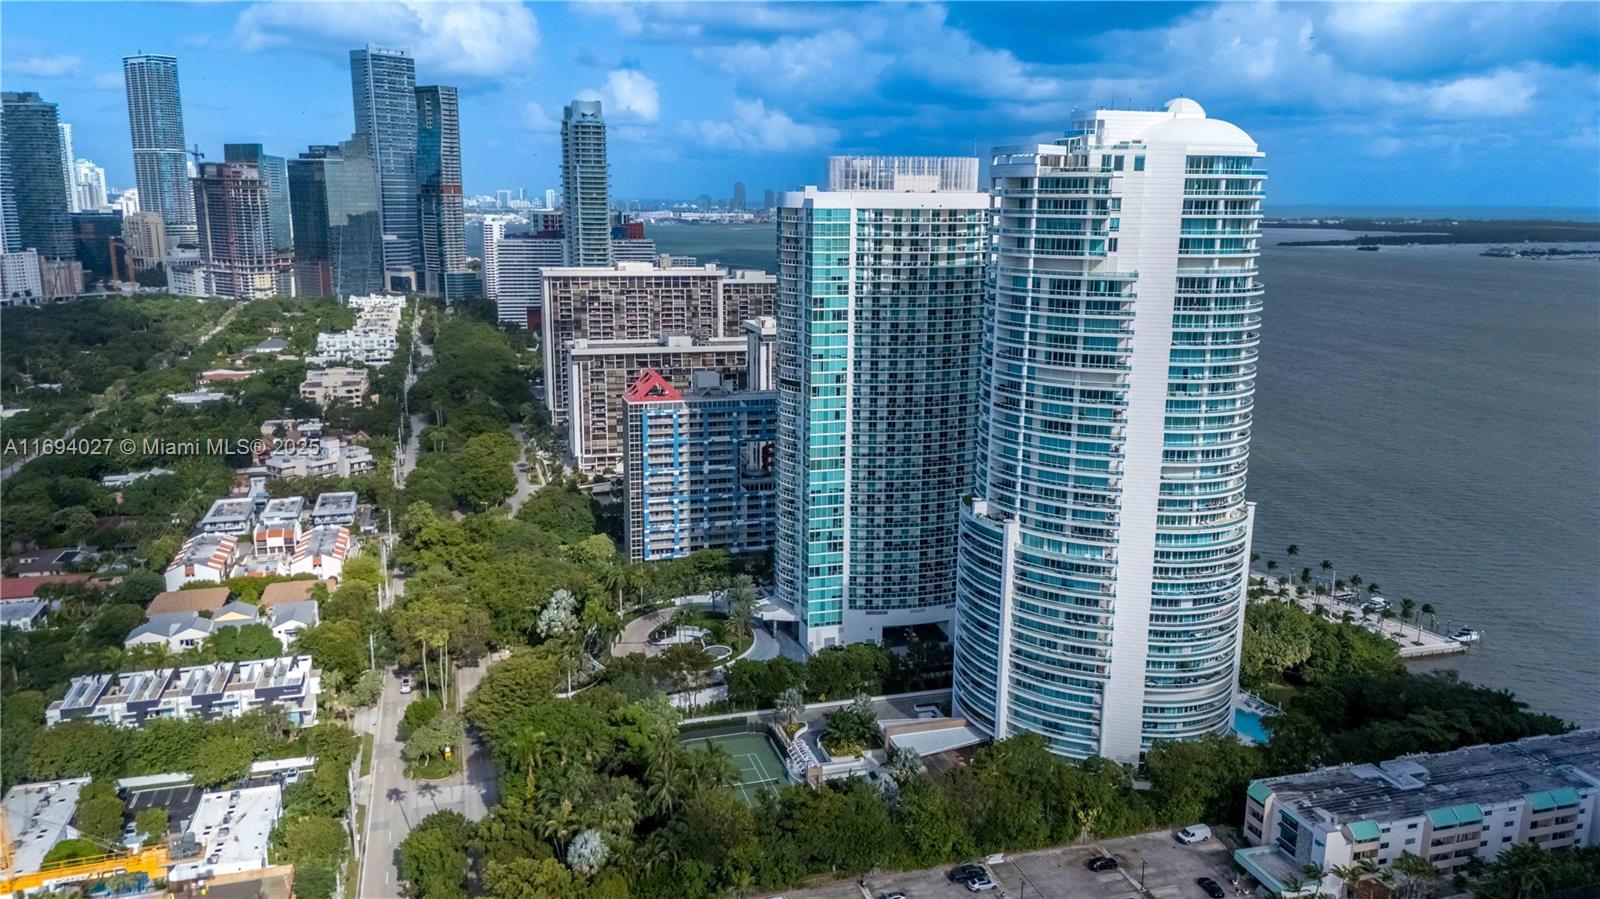
Active
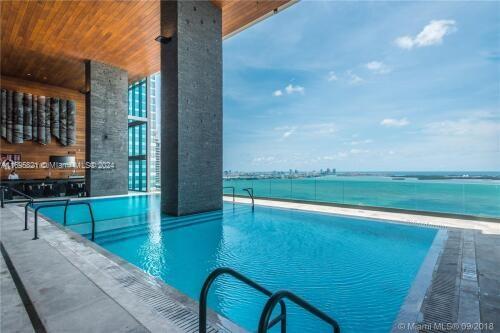
$1,389,000
2
bds
|
3
ba
|
1,167
sqft
|
built
2017
1451 Brickell Ave, Miami, FL 33131
$-6,649
Cash flow
-25.0%
Cash-on-Cash Return
0.4%
Cap rate
0.6%
Rent to Value Ratio
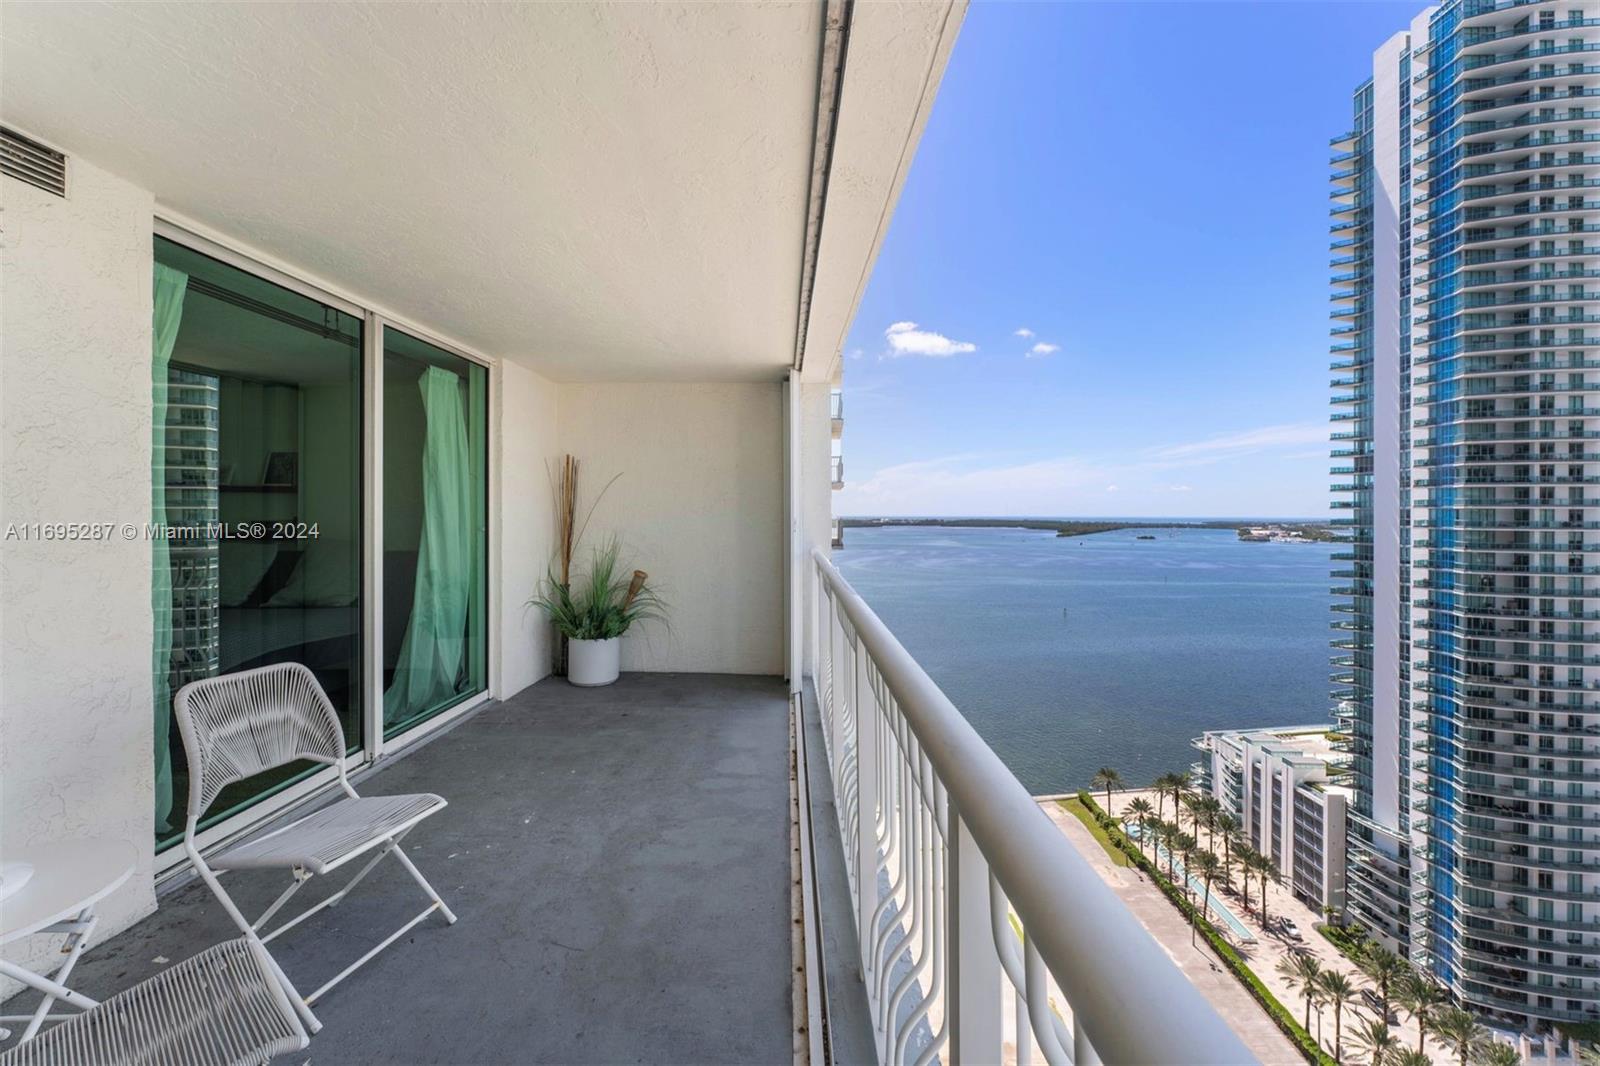
Pending
$458,000
1
bds
|
1
ba
|
778
sqft
|
built
2004
1200 Brickell Bay Dr, Miami, FL 33131
$-1,611
Cash flow
-18.4%
Cash-on-Cash Return
1.9%
Cap rate
0.6%
Rent to Value Ratio
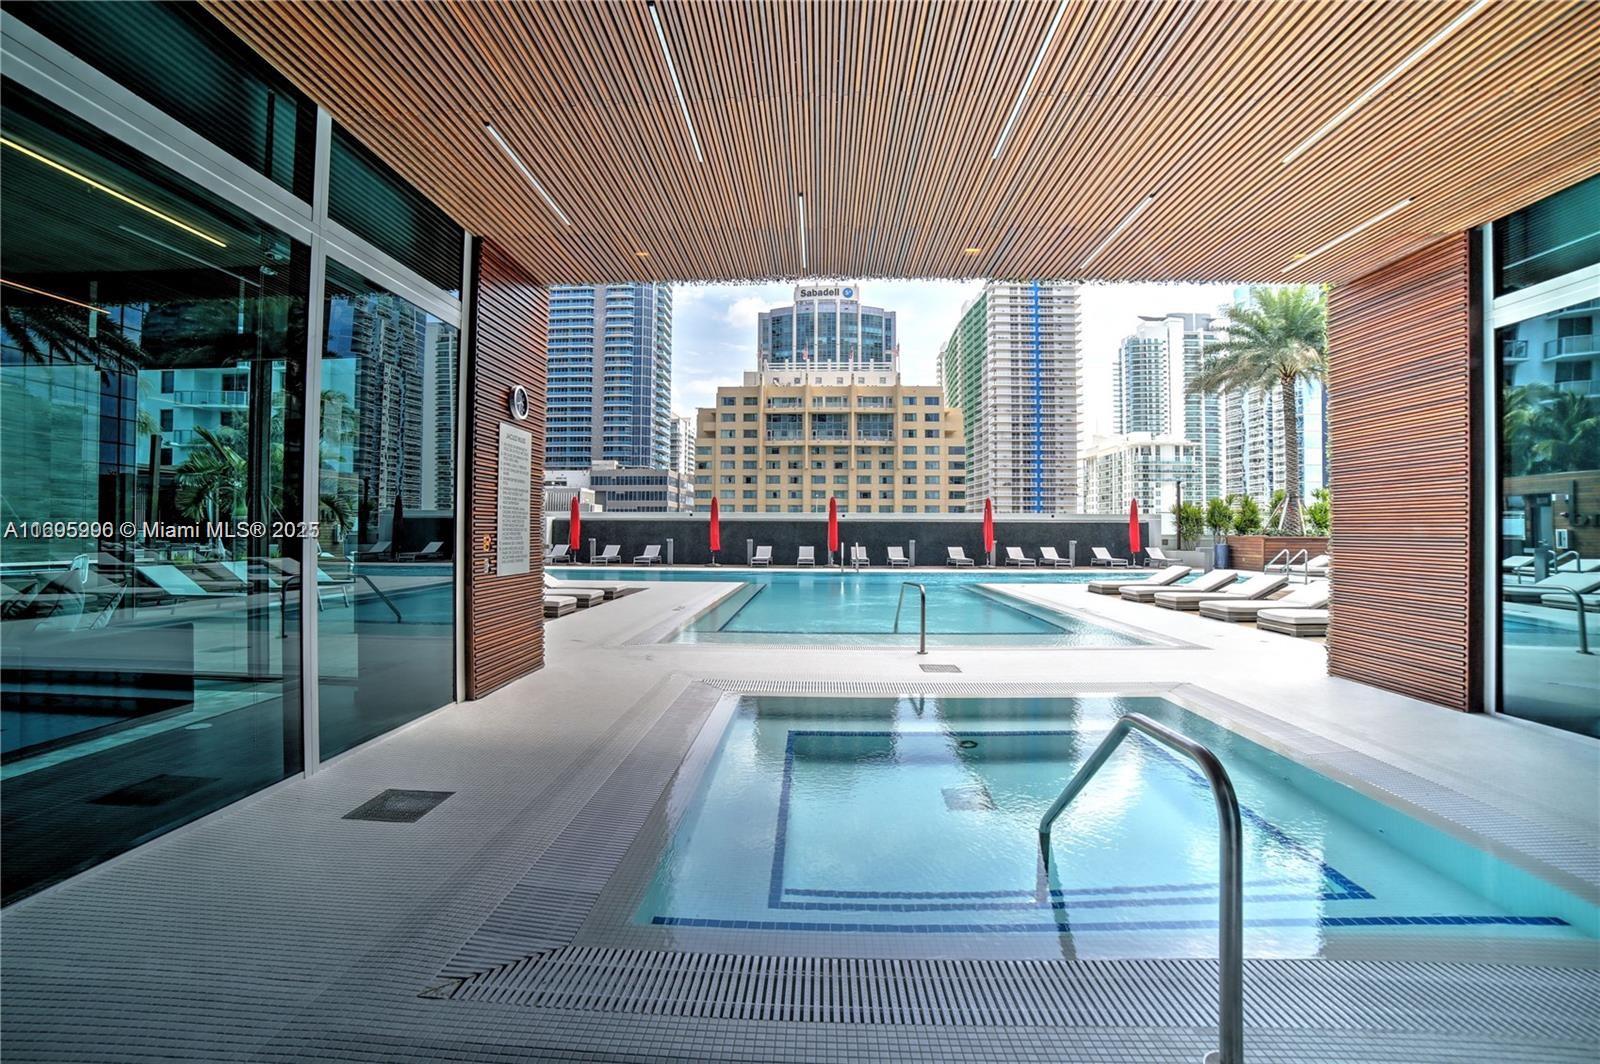
Active
$639,500
1
bds
|
2
ba
|
830
sqft
|
built
2016
1080 Brickell Ave, Miami, FL 33131
$-2,294
Cash flow
-18.7%
Cash-on-Cash Return
1.8%
Cap rate
0.7%
Rent to Value Ratio
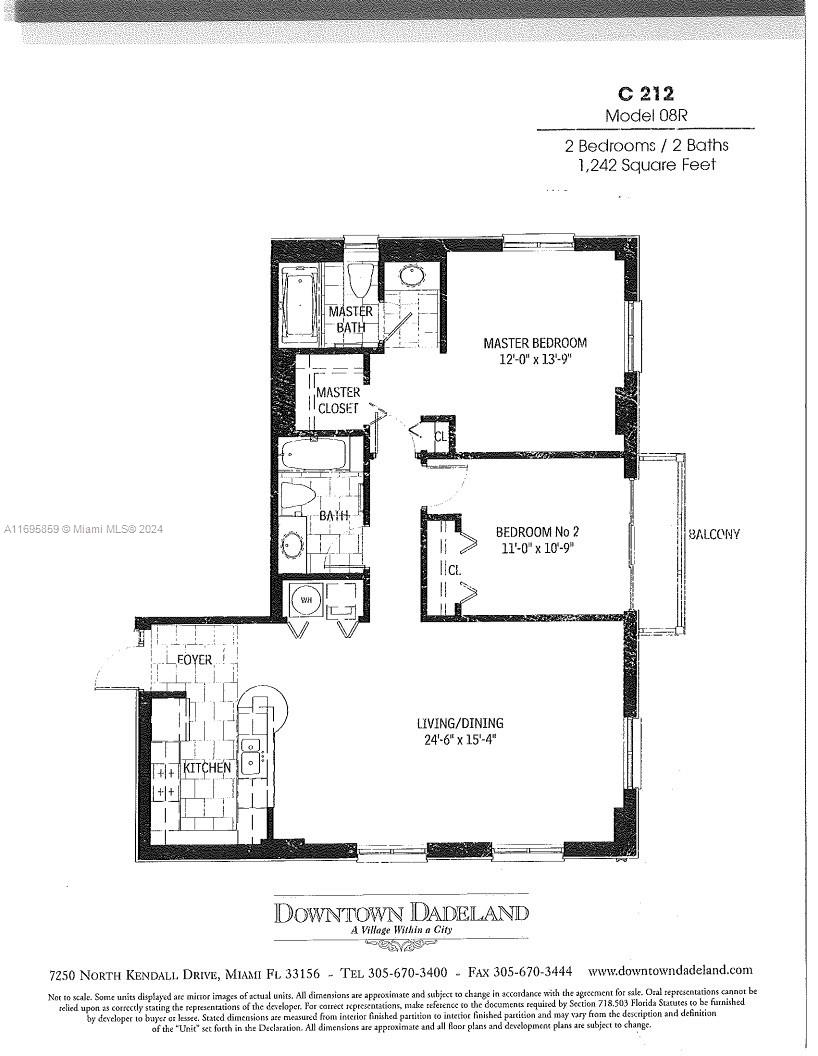
Active
$430,000
2
bds
|
2
ba
|
1,242
sqft
|
built
2007
7275 SW 90th St, Miami, FL 33156
$-1,610
Cash flow
-19.5%
Cash-on-Cash Return
1.7%
Cap rate
0.7%
Rent to Value Ratio
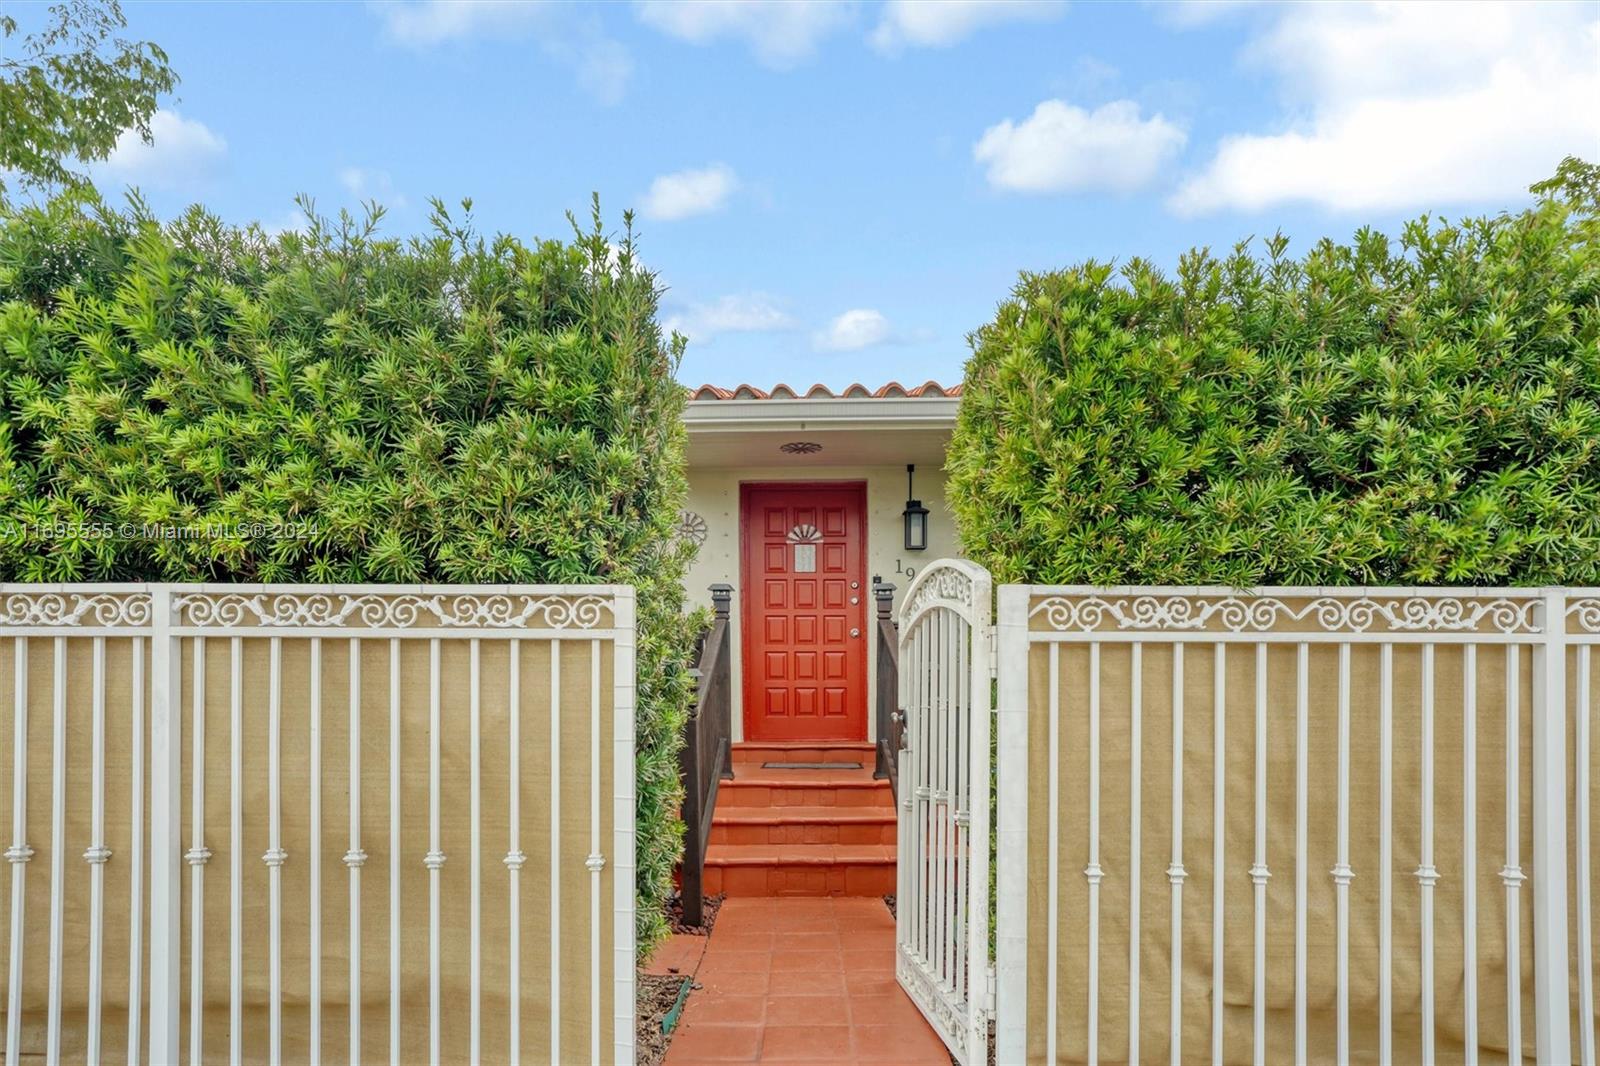
Active
$975,000
2
bds
|
1
ba
|
1,053
sqft
|
built
1947
1900 SW 21st Ave, Miami, FL 33145
$-2,781
Cash flow
-14.9%
Cash-on-Cash Return
2.7%
Cap rate
0.5%
Rent to Value Ratio
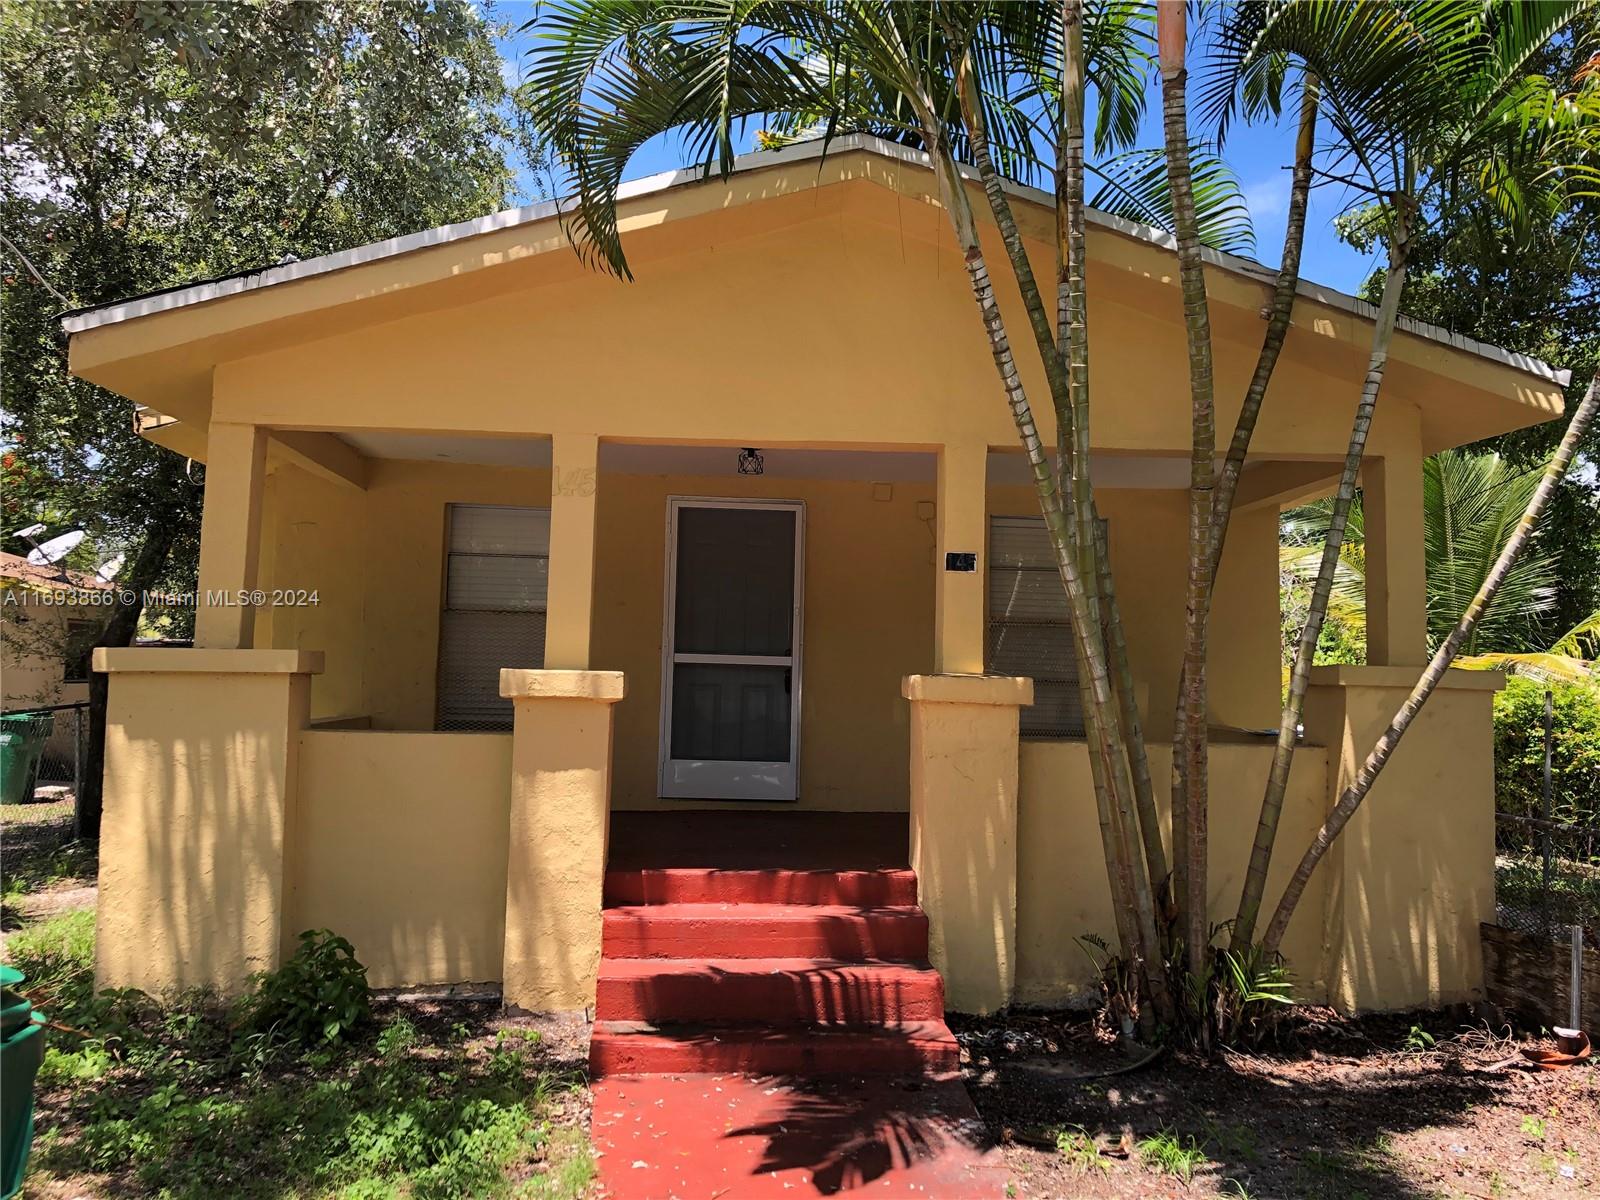
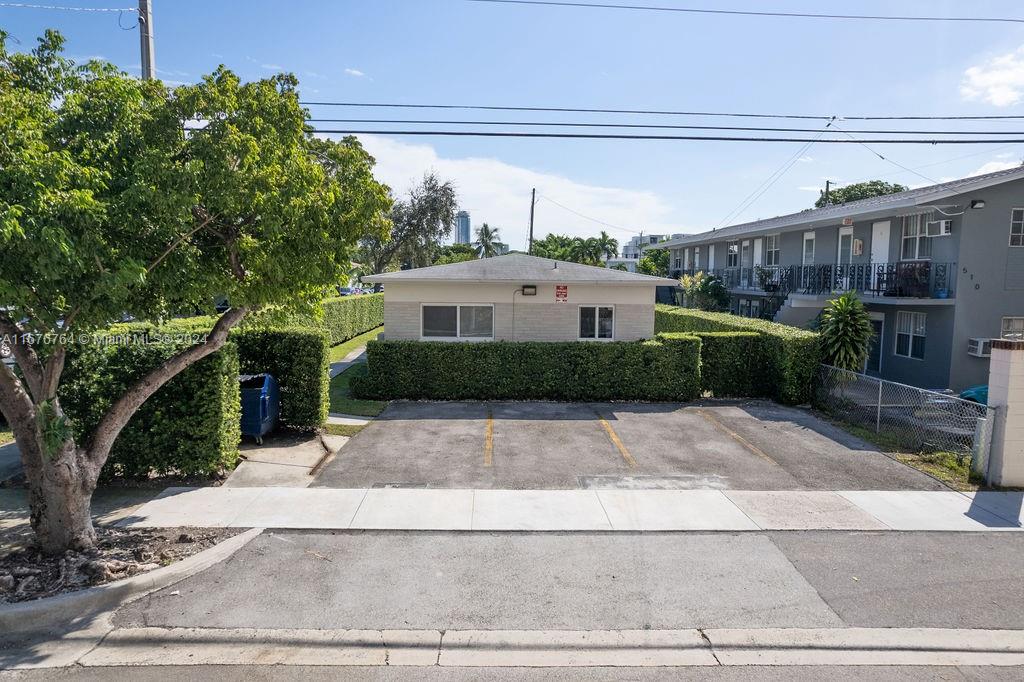
Active
$1,180,000
4
bds
|
0
ba
|
1,788
sqft
|
built
1925
145 NW 32nd St, Miami, FL 33127
$-5,045
Cash flow
-22.3%
Cash-on-Cash Return
1.0%
Cap rate
0.2%
Rent to Value Ratio
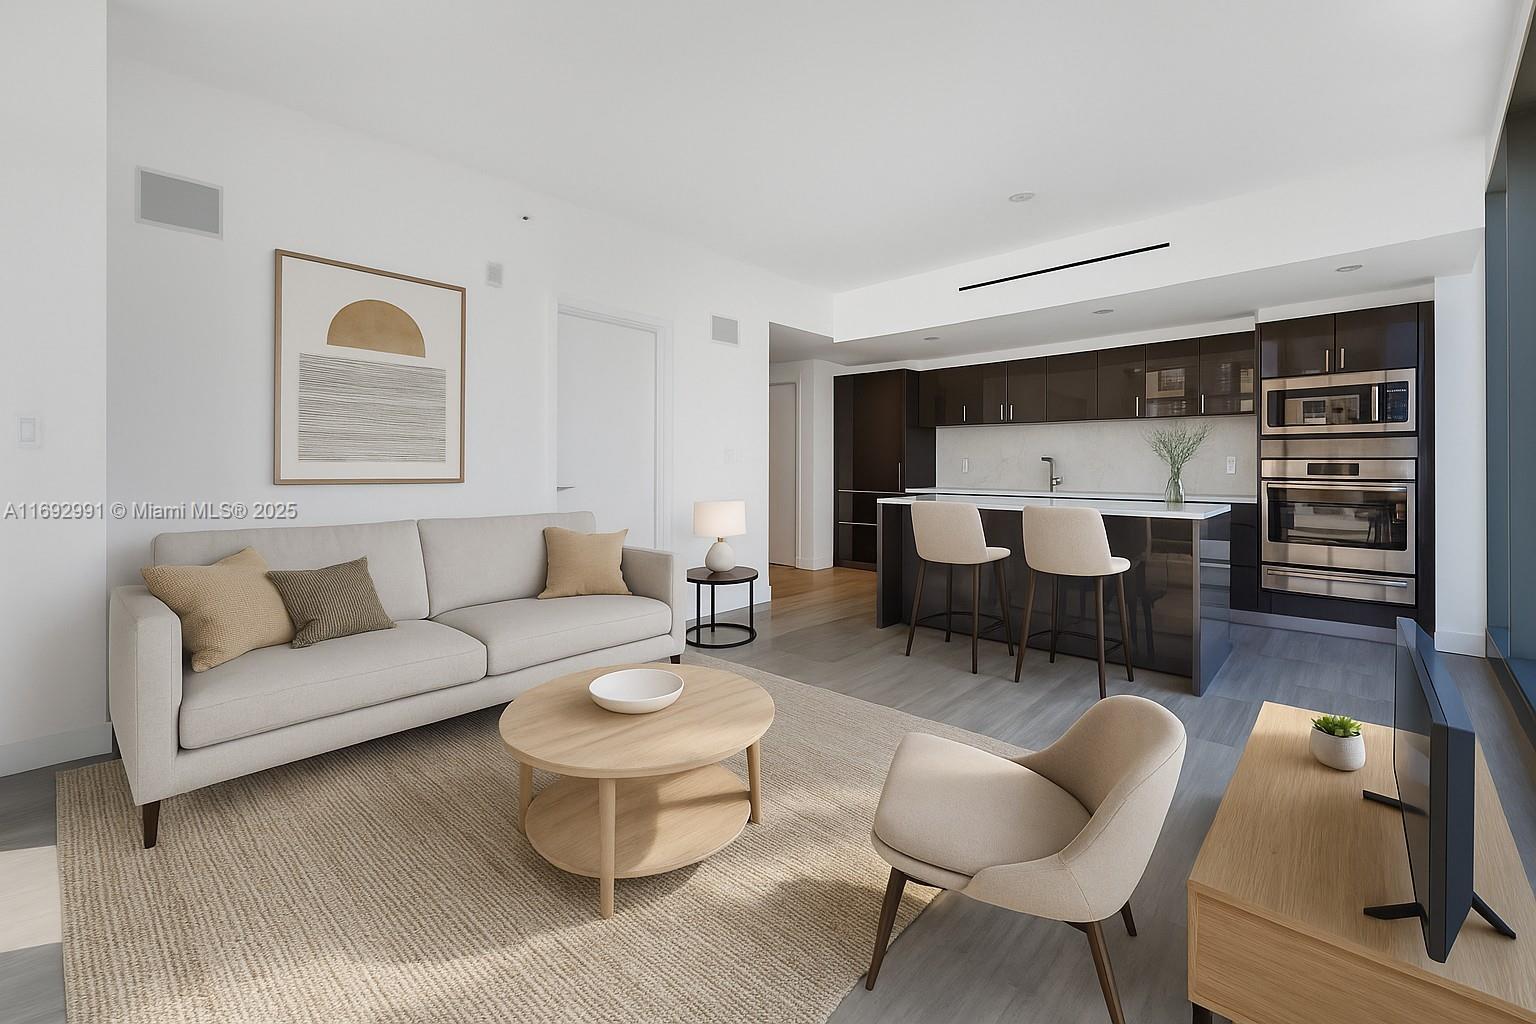
Active
$890,000
1
bds
|
2
ba
|
792
sqft
|
built
2017
1451 Brickell Ave, Miami, FL 33131
$-3,697
Cash flow
-21.7%
Cash-on-Cash Return
1.2%
Cap rate
0.6%
Rent to Value Ratio
Active
$3,195,000
3
bds
|
5
ba
|
2,743
sqft
|
built
2021
788 NE 23rd St, Miami, FL 33137
$-16,012
Cash flow
-26.1%
Cash-on-Cash Return
0.1%
Cap rate
0.3%
Rent to Value Ratio
Active
$279,000
2
bds
|
2
ba
|
1,400
sqft
|
built
1980
740 NE 199th St, Miami, FL 33179
$-709
Cash flow
-13.3%
Cash-on-Cash Return
3.1%
Cap rate
0.9%
Rent to Value Ratio
Active
$610,000
3
bds
|
2
ba
|
2,009
sqft
|
built
1989
20014 NE 6th Court Cir, Miami, FL 33179
$-1,210
Cash flow
-10.3%
Cash-on-Cash Return
3.8%
Cap rate
0.7%
Rent to Value Ratio

Active
$415,000
bds
|
1
ba
|
566
sqft
|
built
2016
1600 SW 1st Ave, Miami, FL 33129
$-1,625
Cash flow
-20.4%
Cash-on-Cash Return
1.4%
Cap rate
0.6%
Rent to Value Ratio
Active
$425,000
2
bds
|
2
ba
|
1,212
sqft
|
built
1956
1140 NW 111th St, Miami, FL 33168
$-396
Cash flow
-4.9%
Cash-on-Cash Return
5.0%
Cap rate
0.7%
Rent to Value Ratio
Active
$525,000
2
bds
|
2
ba
|
1,022
sqft
|
built
2010
1861 NW South River Dr, Miami, FL 33125
$-1,894
Cash flow
-18.8%
Cash-on-Cash Return
1.8%
Cap rate
0.7%
Rent to Value Ratio
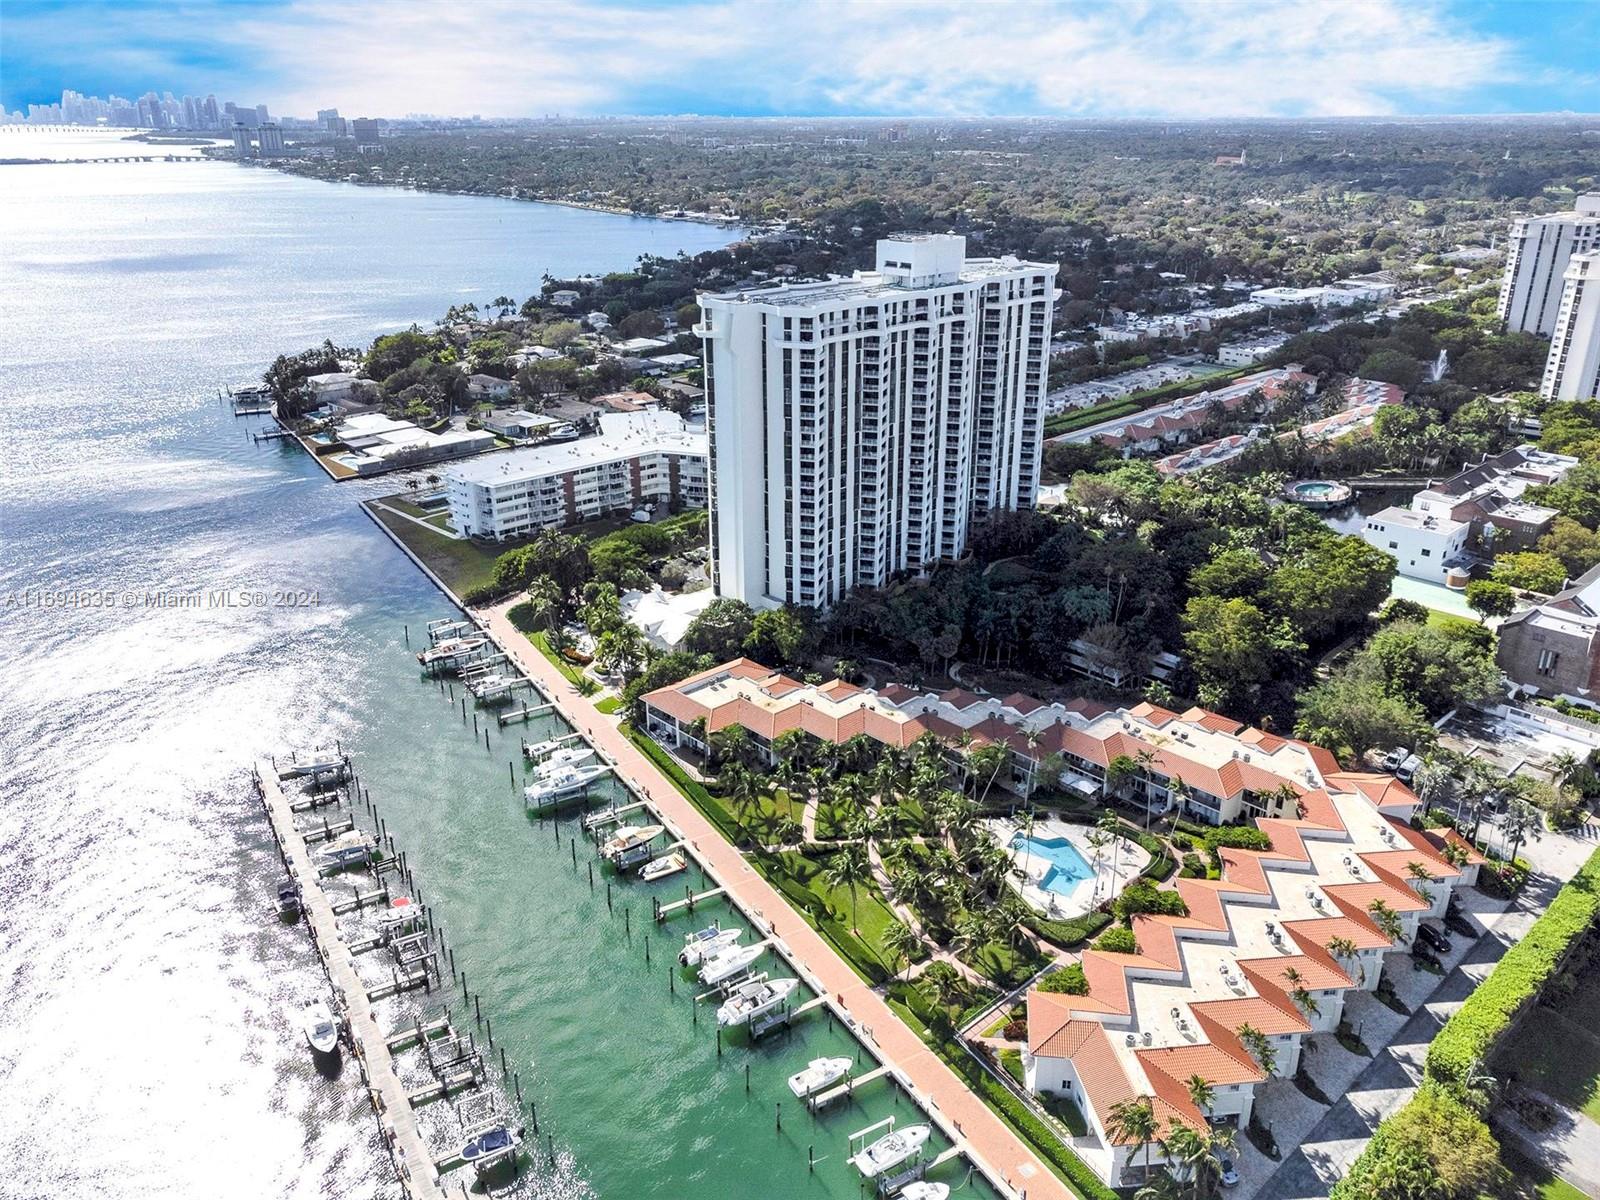
Active
$543,000
2
bds
|
2
ba
|
1,312
sqft
|
built
1981
2000 Towerside Ter, Miami, FL 33138
$-1,623
Cash flow
-15.6%
Cash-on-Cash Return
2.6%
Cap rate
0.9%
Rent to Value Ratio
Active
$7,450,000
4
bds
|
5
ba
|
3,233
sqft
|
built
2018
2821 S Bayshore Dr, Miami, FL 33133
$-44,592
Cash flow
-31.2%
Cash-on-Cash Return
-1.0%
Cap rate
0.1%
Rent to Value Ratio
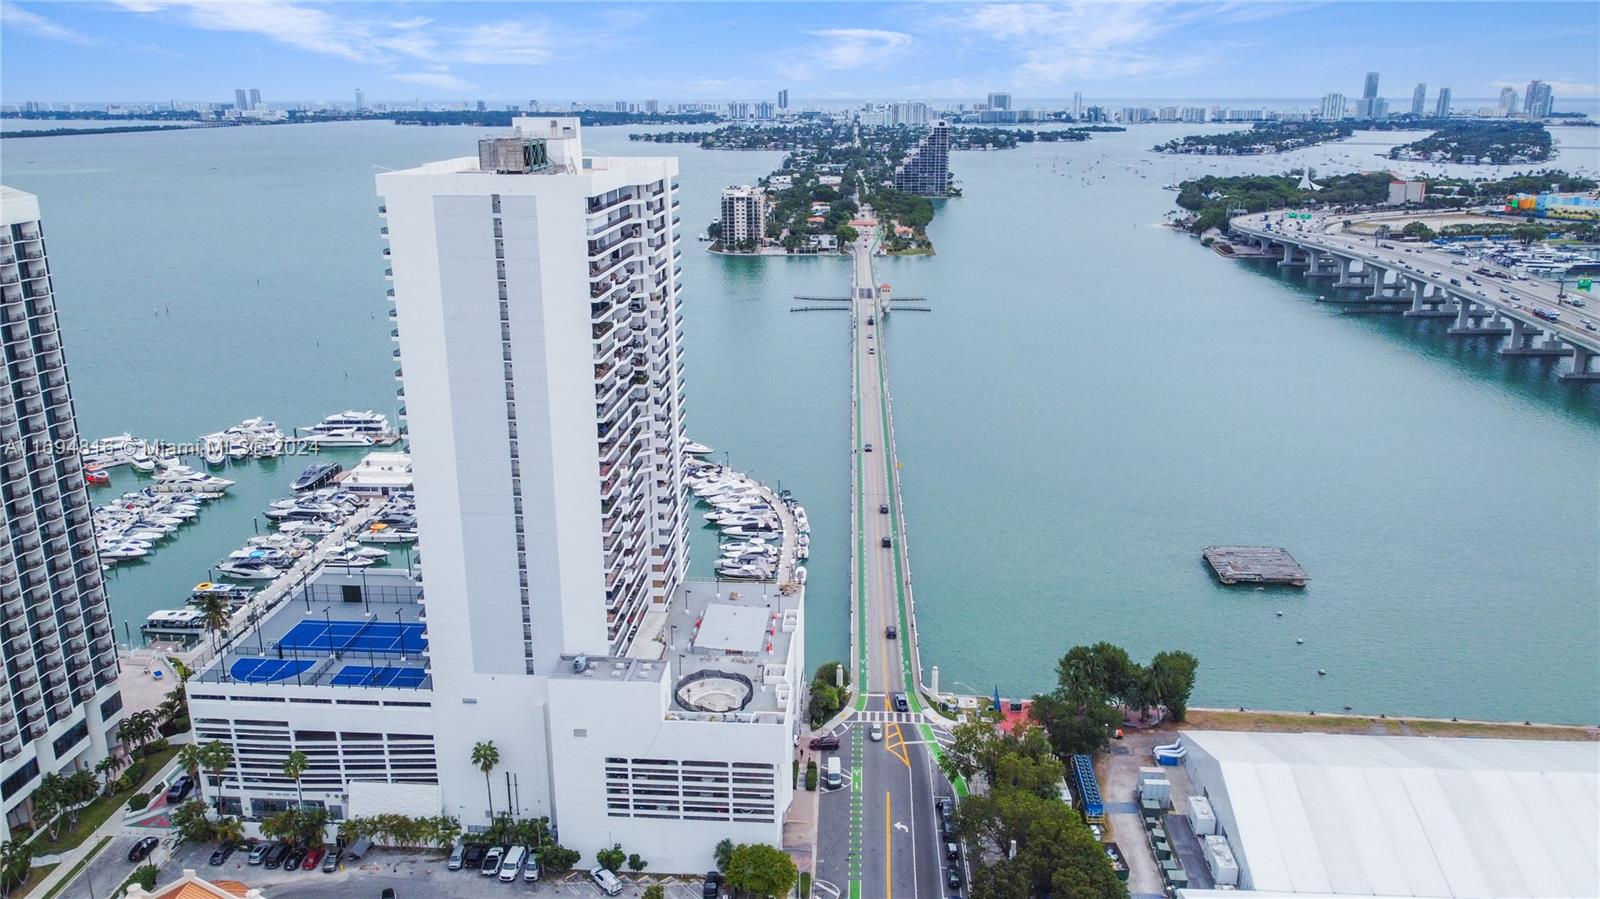
Active
$495,000
2
bds
|
2
ba
|
1,085
sqft
|
built
1973
1420 Brickell Bay Dr, Miami, FL 33131
$-2,069
Cash flow
-21.8%
Cash-on-Cash Return
1.1%
Cap rate
0.6%
Rent to Value Ratio
Active
$12,900,000
3
bds
|
4
ba
|
4,935
sqft
|
built
2002
3400 SW 27th Ave, Miami, FL 33133
$-71,809
Cash flow
-29.0%
Cash-on-Cash Return
-0.5%
Cap rate
0.1%
Rent to Value Ratio

Active
$378,000
3
bds
|
2
ba
|
1,210
sqft
|
built
1971
9125 SW 77th Ave, Miami, FL 33156
$-679
Cash flow
-9.4%
Cash-on-Cash Return
4.0%
Cap rate
0.8%
Rent to Value Ratio
Active
$659,000
3
bds
|
2
ba
|
1,934
sqft
|
built
1993
17100 SW 145th Ct, Miami, FL 33177
$-1,120
Cash flow
-8.9%
Cash-on-Cash Return
4.1%
Cap rate
0.5%
Rent to Value Ratio
Active
$299,900
2
bds
|
2
ba
|
985
sqft
|
built
1981
8415 SW 107th Ave, Miami, FL 33173
$-523
Cash flow
-9.1%
Cash-on-Cash Return
4.1%
Cap rate
0.8%
Rent to Value Ratio
Active
$449,000
1
bds
|
1
ba
|
516
sqft
|
built
2022
227 NE 2nd St, Miami, FL 33132
$-1,608
Cash flow
-18.7%
Cash-on-Cash Return
1.8%
Cap rate
0.7%
Rent to Value Ratio
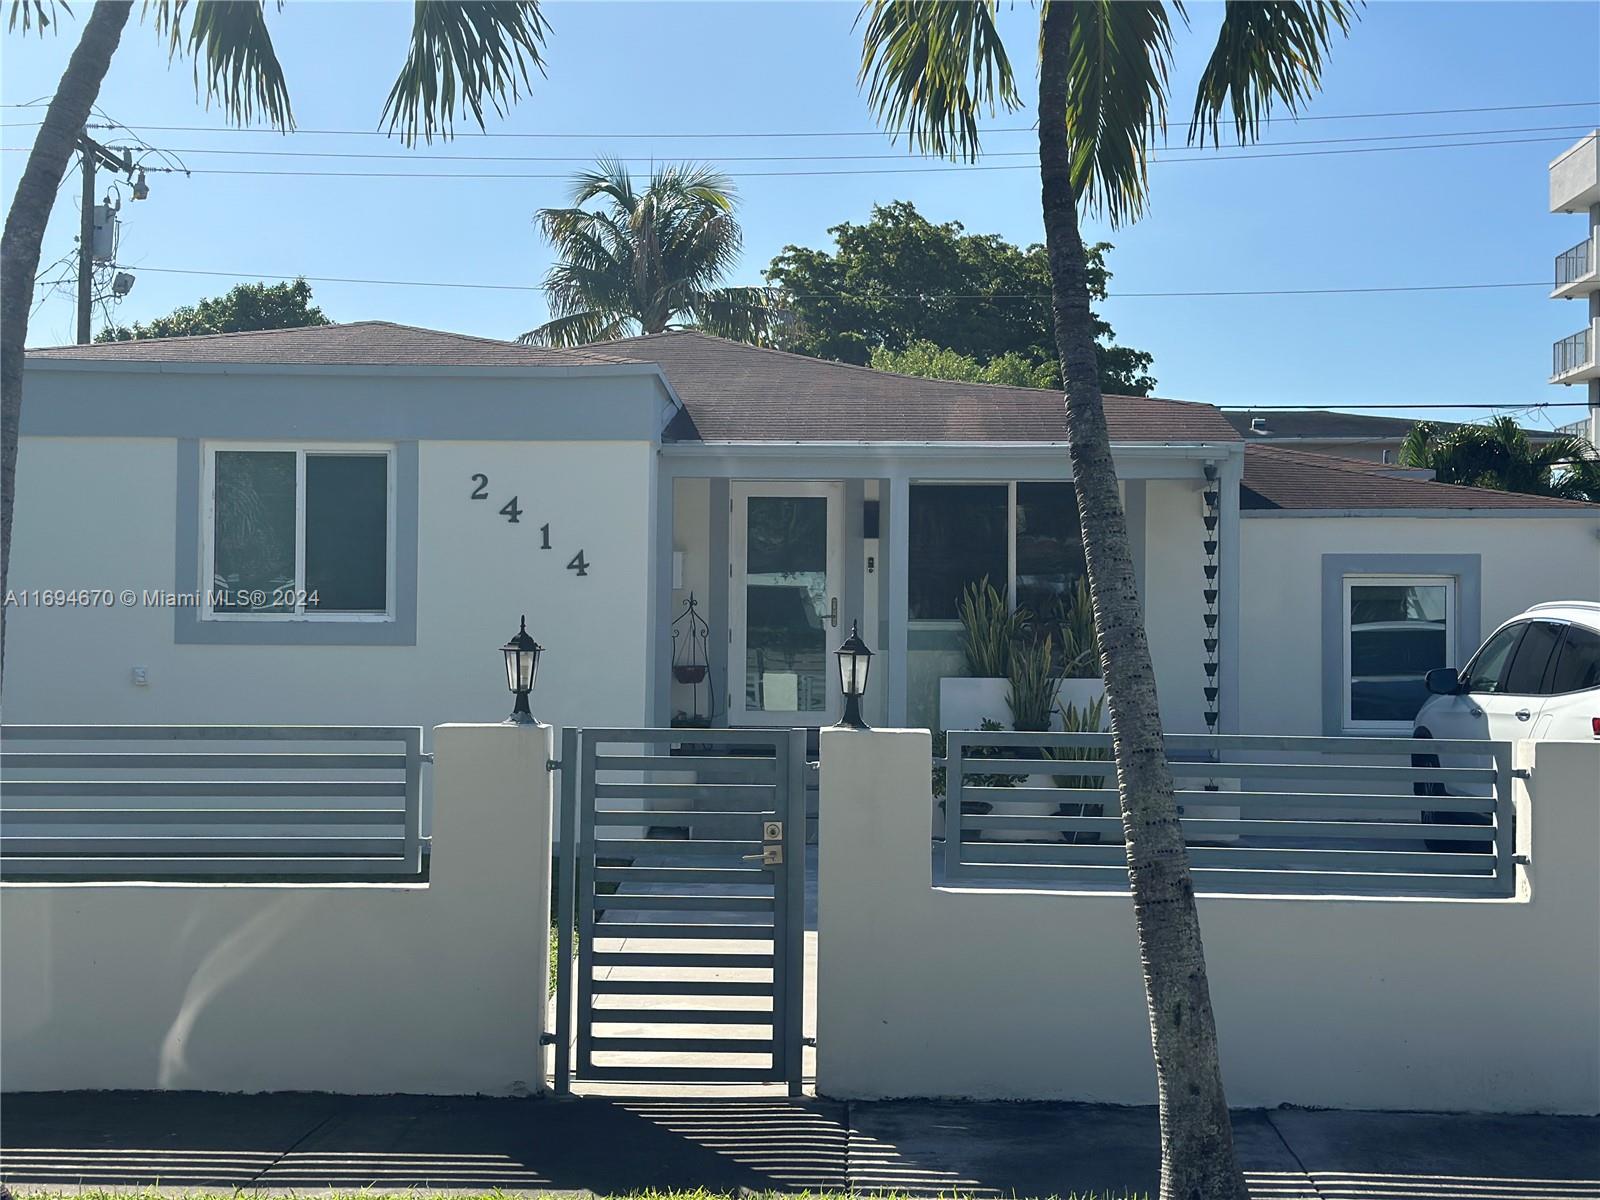
Active
$910,000
3
bds
|
2
ba
|
1,638
sqft
|
built
1940
2414 SW 21st Ter, Miami, FL 33145
$-2,060
Cash flow
-11.8%
Cash-on-Cash Return
3.4%
Cap rate
0.5%
Rent to Value Ratio

Active
$791,000
4
bds
|
4
ba
|
1,633
sqft
|
built
1940
1438 NW 27th St, Miami, FL 33142
$-1,902
Cash flow
-12.5%
Cash-on-Cash Return
3.3%
Cap rate
0.5%
Rent to Value Ratio
Active
$590,000
2
bds
|
2
ba
|
1,160
sqft
|
built
1980
555 NE 15th St, Miami, FL 33132
$-2,116
Cash flow
-18.7%
Cash-on-Cash Return
1.8%
Cap rate
0.7%
Rent to Value Ratio

Active
$945,000
4
bds
|
3
ba
|
2,597
sqft
|
built
1977
8925 SW 11th St, Miami, FL 33174
$-1,664
Cash flow
-9.2%
Cash-on-Cash Return
4.0%
Cap rate
0.6%
Rent to Value Ratio

Active
$695,000
3
bds
|
2
ba
|
1,438
sqft
|
built
2015
4250 Biscayne Blvd, Miami, FL 33137
$-2,868
Cash flow
-21.5%
Cash-on-Cash Return
1.2%
Cap rate
0.8%
Rent to Value Ratio
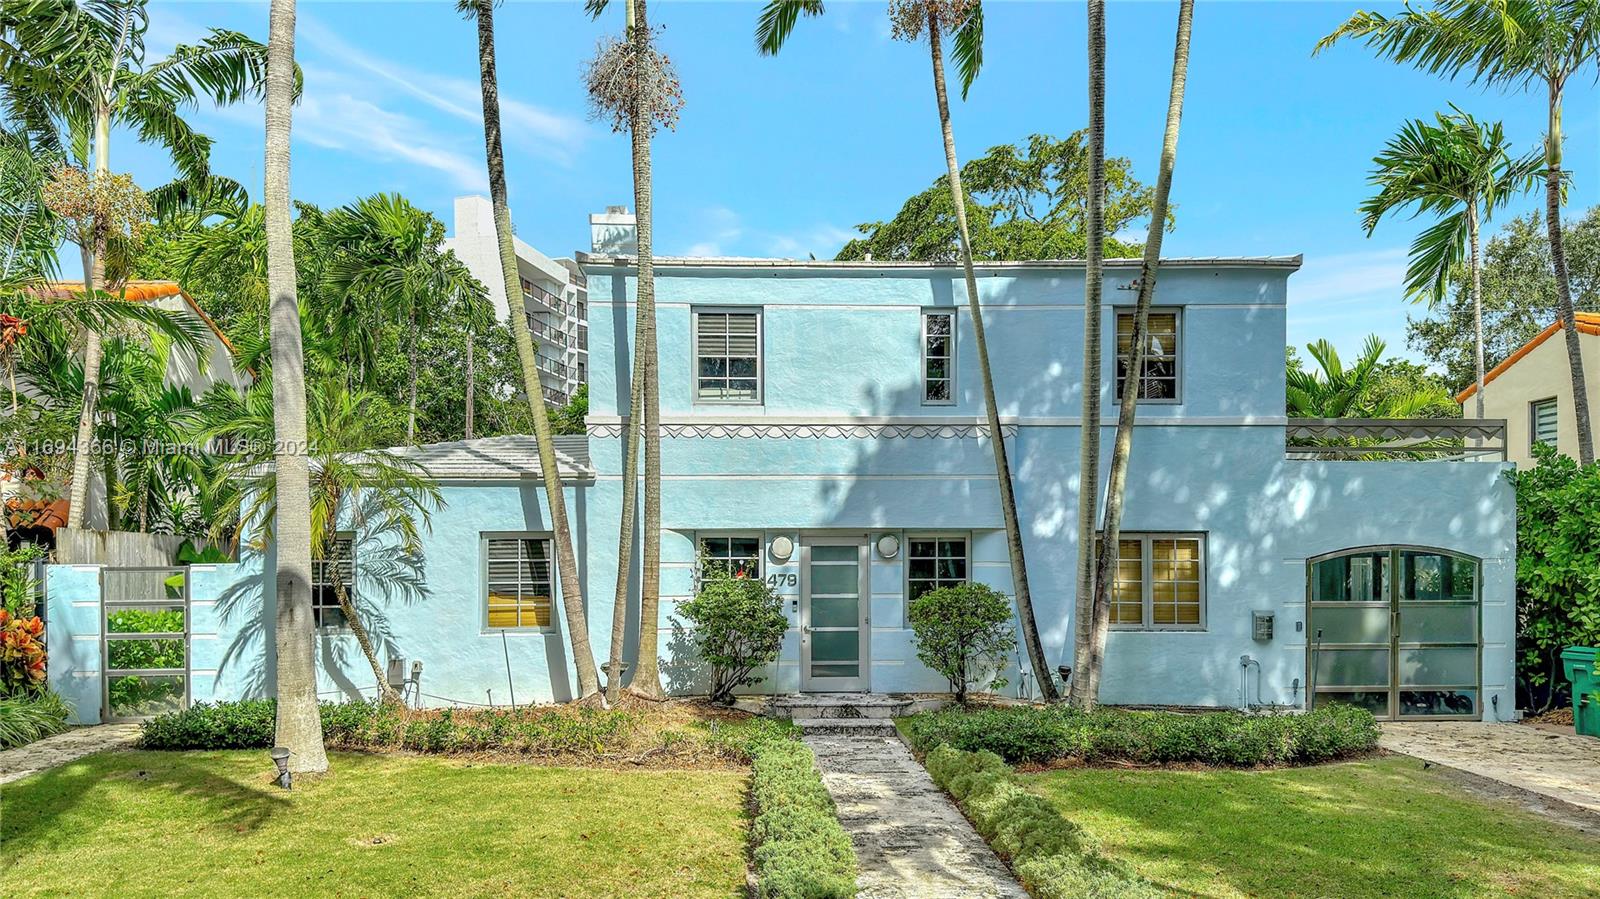
Active
$1,975,000
3
bds
|
3
ba
|
2,212
sqft
|
built
1937
479 NE 56th St, Miami, FL 33137
$-6,896
Cash flow
-18.2%
Cash-on-Cash Return
2.0%
Cap rate
0.4%
Rent to Value Ratio
Active
$420,000
2
bds
|
2
ba
|
1,164
sqft
|
built
1982
4000 Towerside Ter, Miami, FL 33138
$-817
Cash flow
-10.1%
Cash-on-Cash Return
3.8%
Cap rate
0.9%
Rent to Value Ratio

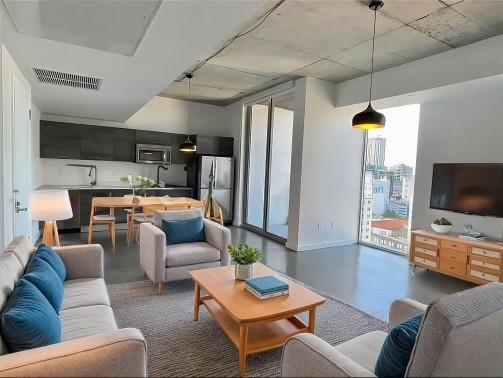
Active
$849,000
1
bds
|
2
ba
|
1,185
sqft
|
built
2019
851 NE 1st St, Miami, FL 33132
$-4,266
Cash flow
-26.2%
Cash-on-Cash Return
0.1%
Cap rate
0.5%
Rent to Value Ratio
Active
$475,000
2
bds
|
2
ba
|
1,087
sqft
|
built
2005
275 NE 18th St, Miami, FL 33132
$-1,517
Cash flow
-16.7%
Cash-on-Cash Return
2.3%
Cap rate
0.8%
Rent to Value Ratio
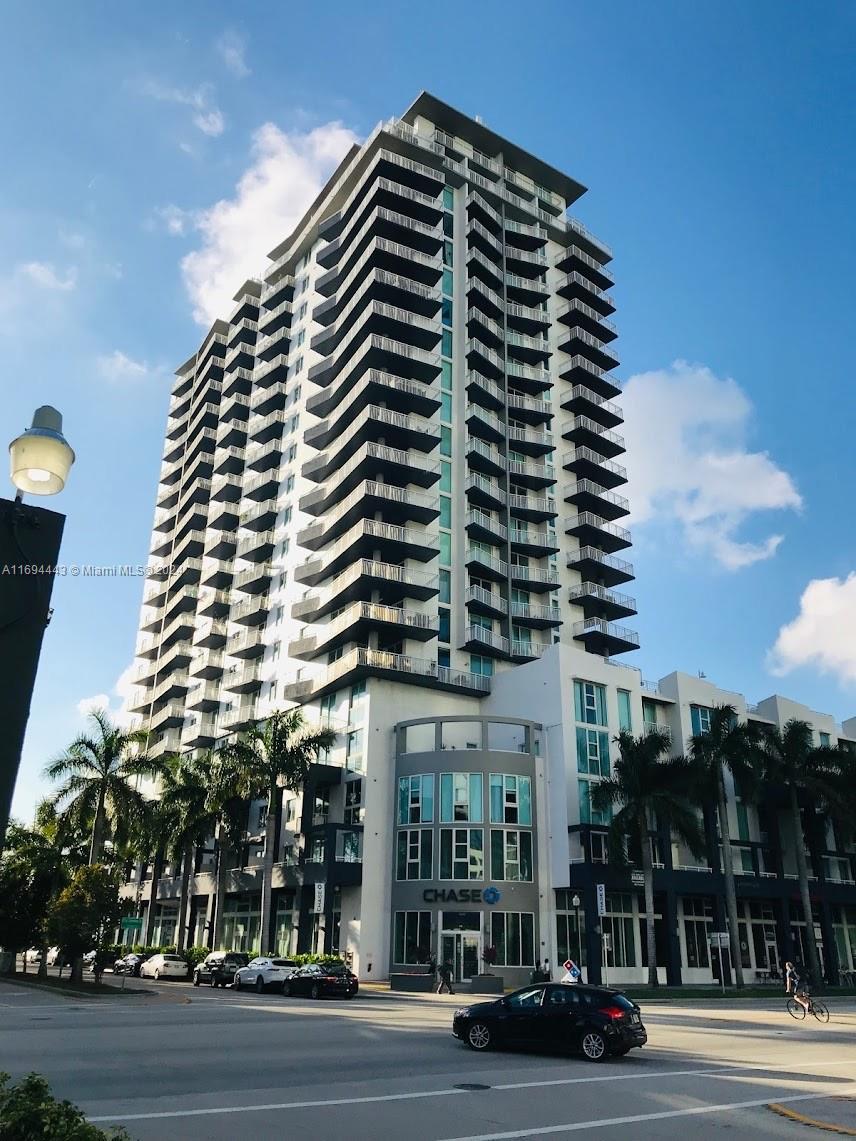
Active
$590,000
1
bds
|
1
ba
|
681
sqft
|
built
2018
121 NE 34th St, Miami, FL 33137
$-2,441
Cash flow
-21.6%
Cash-on-Cash Return
1.2%
Cap rate
0.6%
Rent to Value Ratio
Active
$1,260,000
1
bds
|
2
ba
|
1,210
sqft
|
built
1993
2127 Brickell Ave, Miami, FL 33129
$-5,018
Cash flow
-20.8%
Cash-on-Cash Return
1.4%
Cap rate
0.5%
Rent to Value Ratio
Active
$1,425,000
4
bds
|
0
ba
|
2,446
sqft
|
built
1955
900 SW 5th Ave, Miami, FL 33130
$-5,899
Cash flow
-21.6%
Cash-on-Cash Return
1.2%
Cap rate
0.2%
Rent to Value Ratio

Active
$325,000
2
bds
|
2
ba
|
960
sqft
|
built
1988
13820 SW 112th St, Miami, FL 33186
$-892
Cash flow
-14.3%
Cash-on-Cash Return
2.9%
Cap rate
0.8%
Rent to Value Ratio
Active
$329,000
1
bds
|
1
ba
|
564
sqft
|
built
2016
151 SE 1st St, Miami, FL 33131
$-1,192
Cash flow
-18.9%
Cash-on-Cash Return
1.8%
Cap rate
0.7%
Rent to Value Ratio
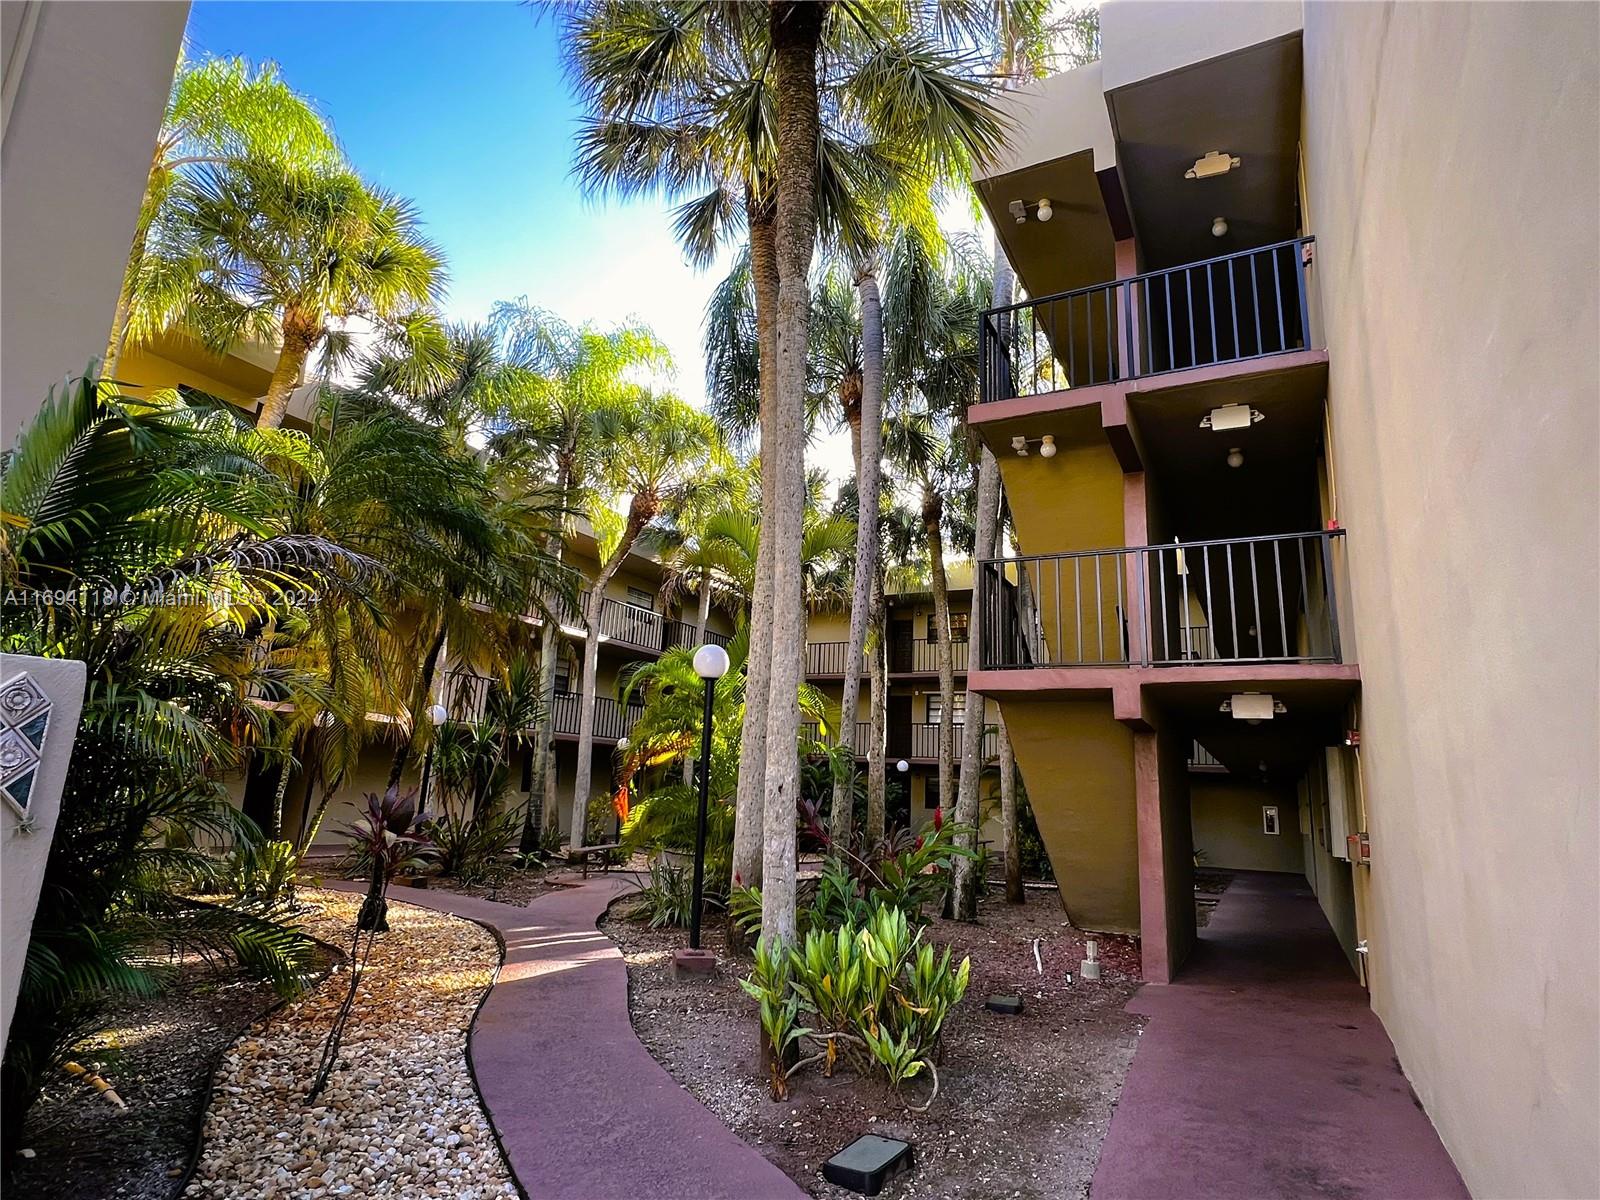
Active
$329,000
2
bds
|
2
ba
|
936
sqft
|
built
1981
10835 SW 112th Ave, Miami, FL 33176
$-1,000
Cash flow
-15.9%
Cash-on-Cash Return
2.5%
Cap rate
0.7%
Rent to Value Ratio
Active
$449,000
1
bds
|
2
ba
|
1,064
sqft
|
built
1975
1865 Brickell Ave, Miami, FL 33129
$-1,367
Cash flow
-15.9%
Cash-on-Cash Return
2.5%
Cap rate
0.7%
Rent to Value Ratio
Active
$410,000
1
bds
|
2
ba
|
997
sqft
|
built
1986
1717 N Bayshore Dr, Miami, FL 33132
$-1,162
Cash flow
-14.8%
Cash-on-Cash Return
2.7%
Cap rate
0.8%
Rent to Value Ratio
Active under contract
$824,999
2
bds
|
1
ba
|
984
sqft
|
built
1937
260 NW 34th St, Miami, FL 33127
$-1,260
Cash flow
-8.0%
Cash-on-Cash Return
4.3%
Cap rate
0.5%
Rent to Value Ratio
Active
$400,000
1
bds
|
1
ba
|
641
sqft
|
built
2018
481 NE 29th St, Miami, FL 33137
$-1,827
Cash flow
-23.8%
Cash-on-Cash Return
0.7%
Cap rate
0.7%
Rent to Value Ratio