Miami, FL Investment Properties for Sale
Browse homes for sale and investment properties in Miami, FL. Refine your search by price, property type, or more.
Best cash flowing properties in Miami, FL
Active
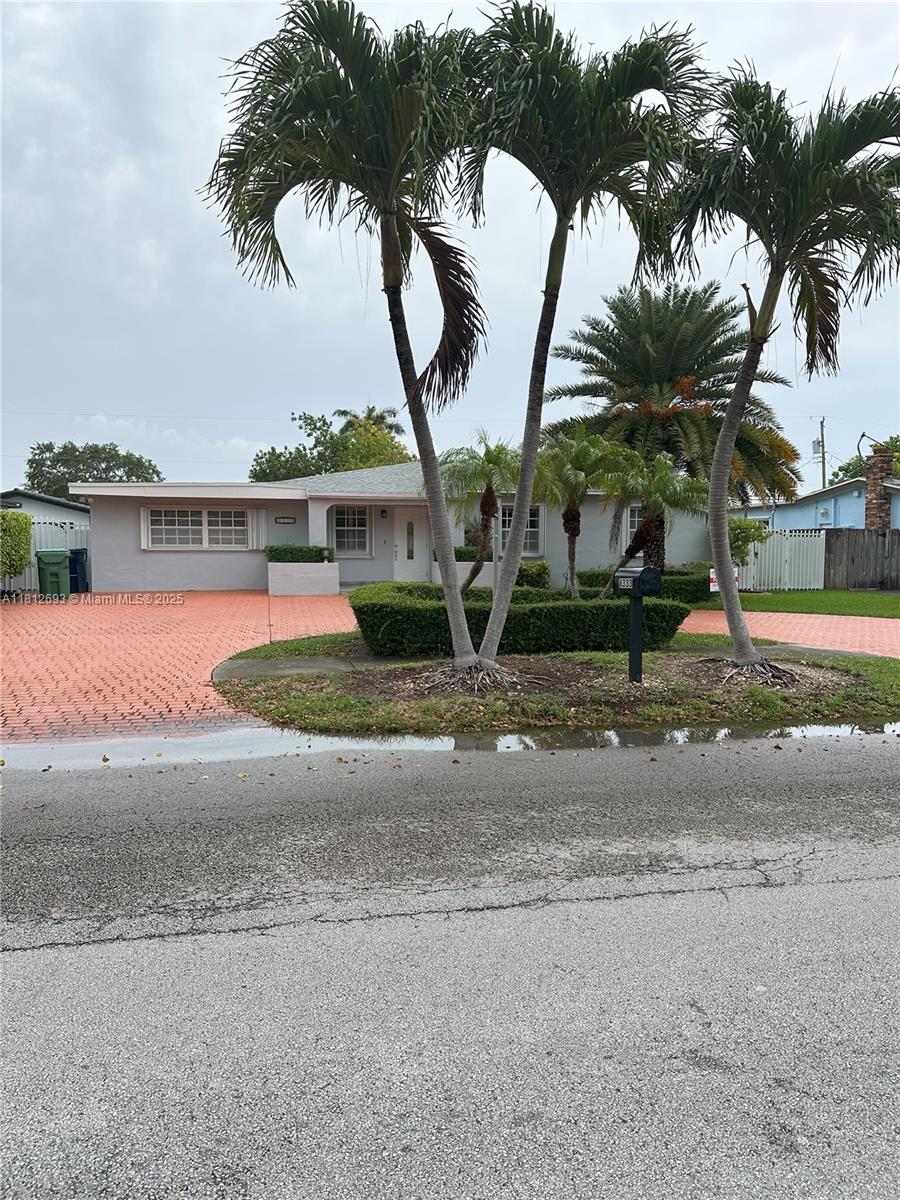
$185,000
1
bds
|
1
ba
|
539
sqft
|
built
1985
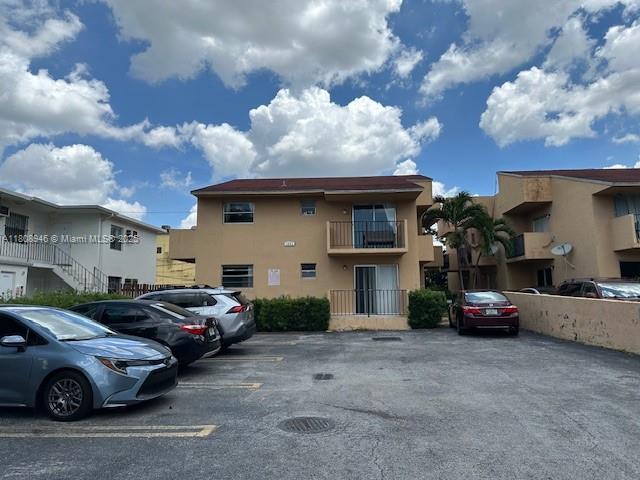
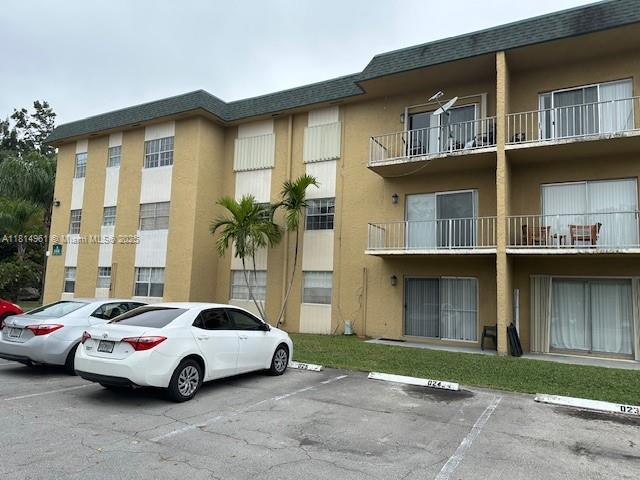
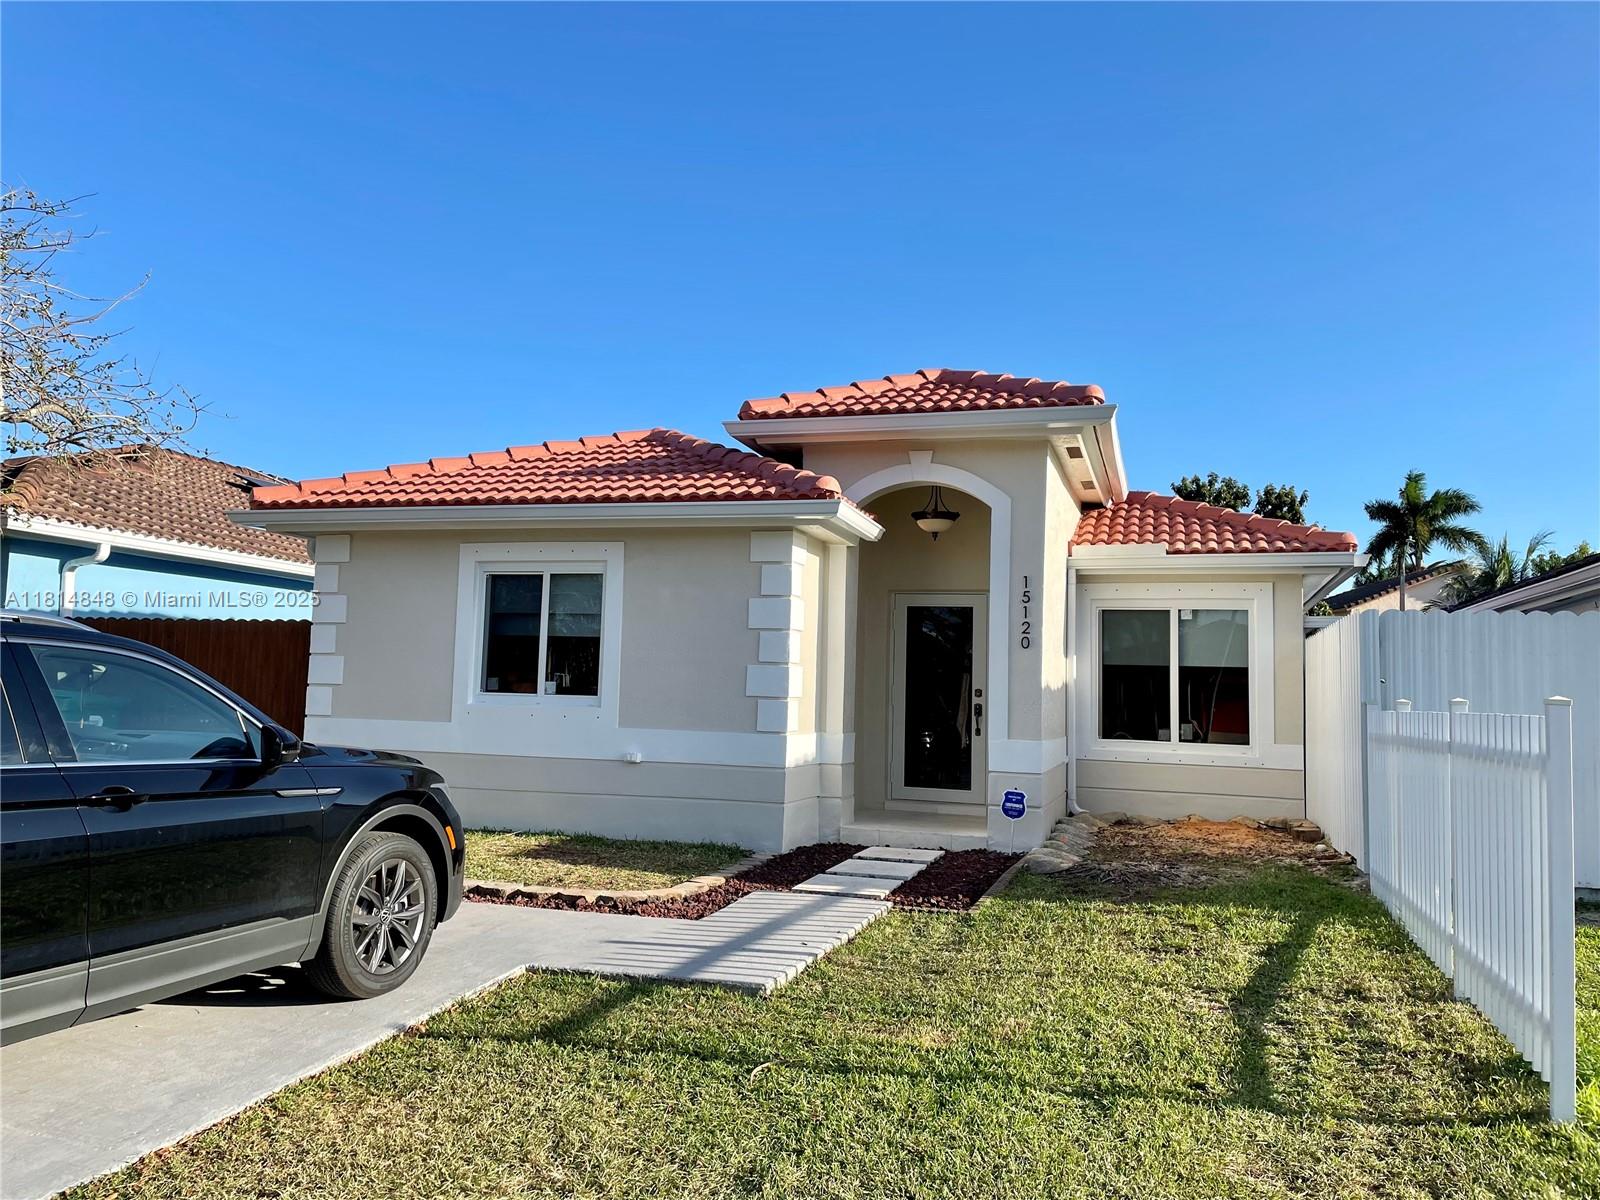
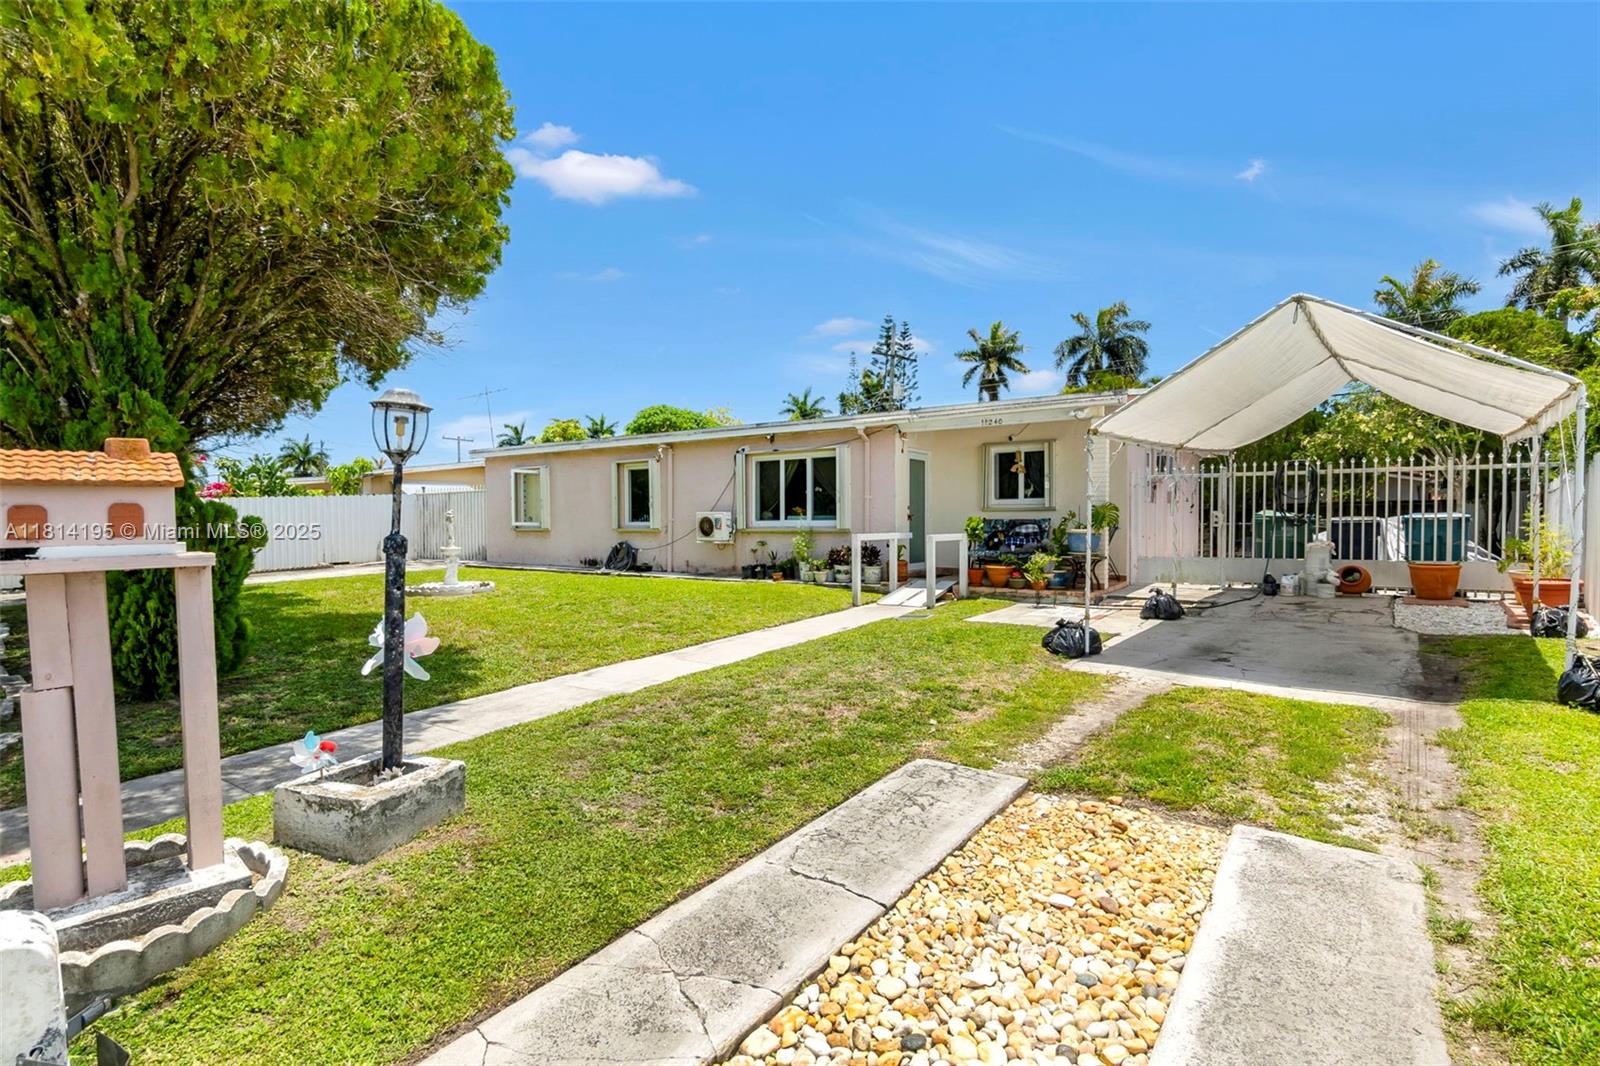
1241 NW 6th St, Miami, FL 33125
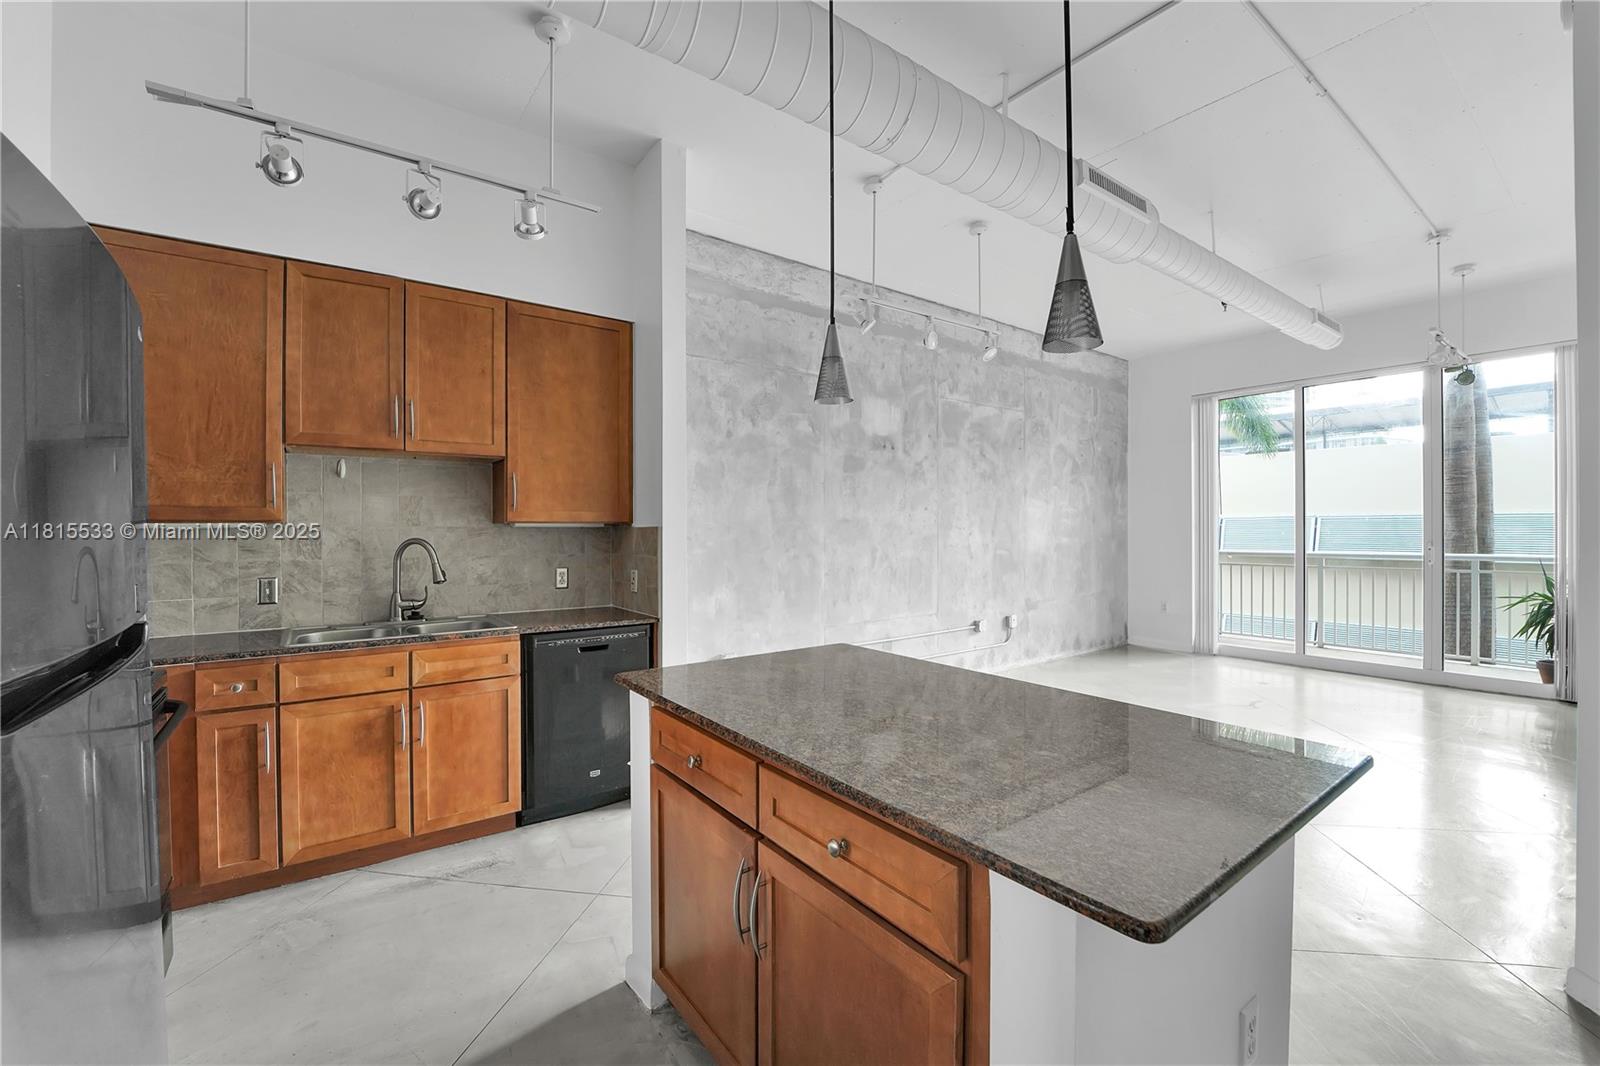
$60
Cash flow
1.7%
Cash-on-Cash Return
6.7%
Cap rate
1.0%
Rent to Value Ratio
Active
$220,000
1
bds
|
1
ba
|
699
sqft
|
built
1971
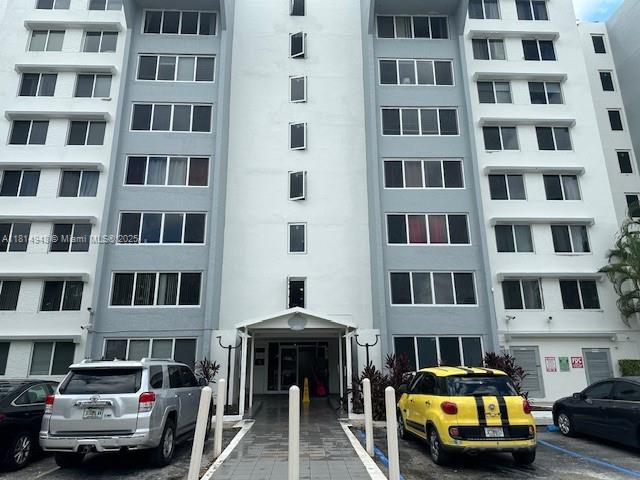
9001 SW 77th Ave, Miami, FL 33156
$-691
Cash flow
-16.4%
Cash-on-Cash Return
2.5%
Cap rate
0.8%
Rent to Value Ratio
6,303 out of 7,157 properties for sale in Miami, FL
Limited Results Shown
Create a free account, or log in to reveal all property listings and enjoy the complete experience.
Active
$2,135,000
3
bds
|
3
ba
|
2,236
sqft
|
built
2018
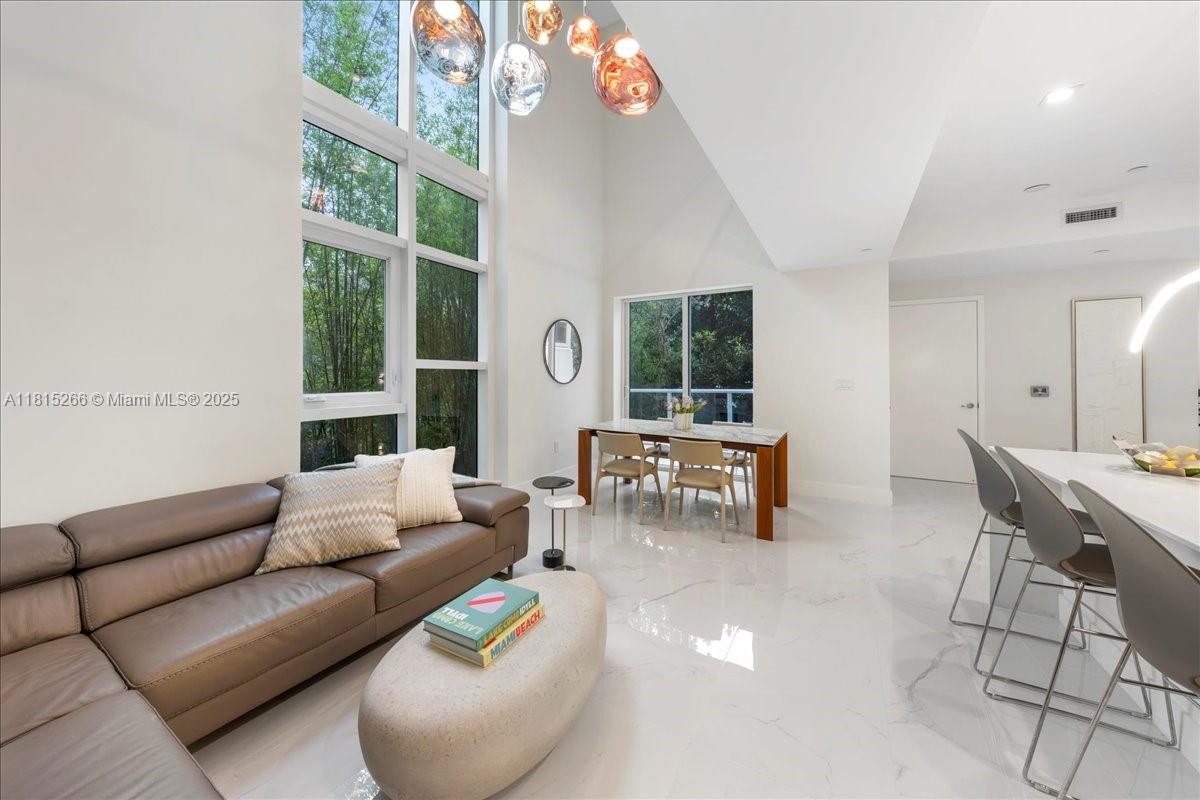
455 NE 39th St, Miami, FL 33137
$-5,606
Cash flow
-13.7%
Cash-on-Cash Return
3.1%
Cap rate
0.5%
Rent to Value Ratio
Active
$285,000
2
bds
|
2
ba
|
983
sqft
|
built
1981
10855 SW 112th Ave, Miami, FL 33176
$-753
Cash flow
-13.8%
Cash-on-Cash Return
3.1%
Cap rate
0.8%
Rent to Value Ratio
Active
$1,800,000
4
bds
|
4
ba
|
2,730
sqft
|
built
1986
6681 SW 155th Ave, Miami, FL 33193
$-3,870
Cash flow
-11.2%
Cash-on-Cash Return
3.7%
Cap rate
0.5%
Rent to Value Ratio
Active
$1,200,000
5
bds
|
3
ba
|
2,537
sqft
|
built
1989
15321 SW 59th St, Miami, FL 33193
$-3,752
Cash flow
-16.3%
Cash-on-Cash Return
2.5%
Cap rate
0.4%
Rent to Value Ratio

Active
$1,495,000
6
bds
|
5
ba
|
2,662
sqft
|
built
1946
524 NE 65th St, Miami, FL 33138
$-5,229
Cash flow
-18.2%
Cash-on-Cash Return
2.1%
Cap rate
0.3%
Rent to Value Ratio
Active
$474,800
3
bds
|
1
ba
|
936
sqft
|
built
1950
14780 Harrison St, Miami, FL 33176
$-1,048
Cash flow
-11.5%
Cash-on-Cash Return
3.6%
Cap rate
0.5%
Rent to Value Ratio
Active
$595,000
3
bds
|
2
ba
|
1,194
sqft
|
built
1938
2160 NW 30th St, Miami, FL 33142
$-1,823
Cash flow
-16.0%
Cash-on-Cash Return
2.6%
Cap rate
0.4%
Rent to Value Ratio
Pending
$634,000
3
bds
|
2
ba
|
1,543
sqft
|
built
1988
881 NW 132nd Pl, Miami, FL 33182
$-1,462
Cash flow
-12.0%
Cash-on-Cash Return
3.5%
Cap rate
0.6%
Rent to Value Ratio
Active
$727,000
3
bds
|
2
ba
|
1,637
sqft
|
built
1992
17086 SW 144th Ct, Miami, FL 33177
$-1,670
Cash flow
-12.0%
Cash-on-Cash Return
3.5%
Cap rate
0.5%
Rent to Value Ratio
Active
$445,000
2
bds
|
2
ba
|
915
sqft
|
built
1973
5701 Biscayne Blvd, Miami, FL 33137
$-1,378
Cash flow
-16.2%
Cash-on-Cash Return
2.6%
Cap rate
0.6%
Rent to Value Ratio
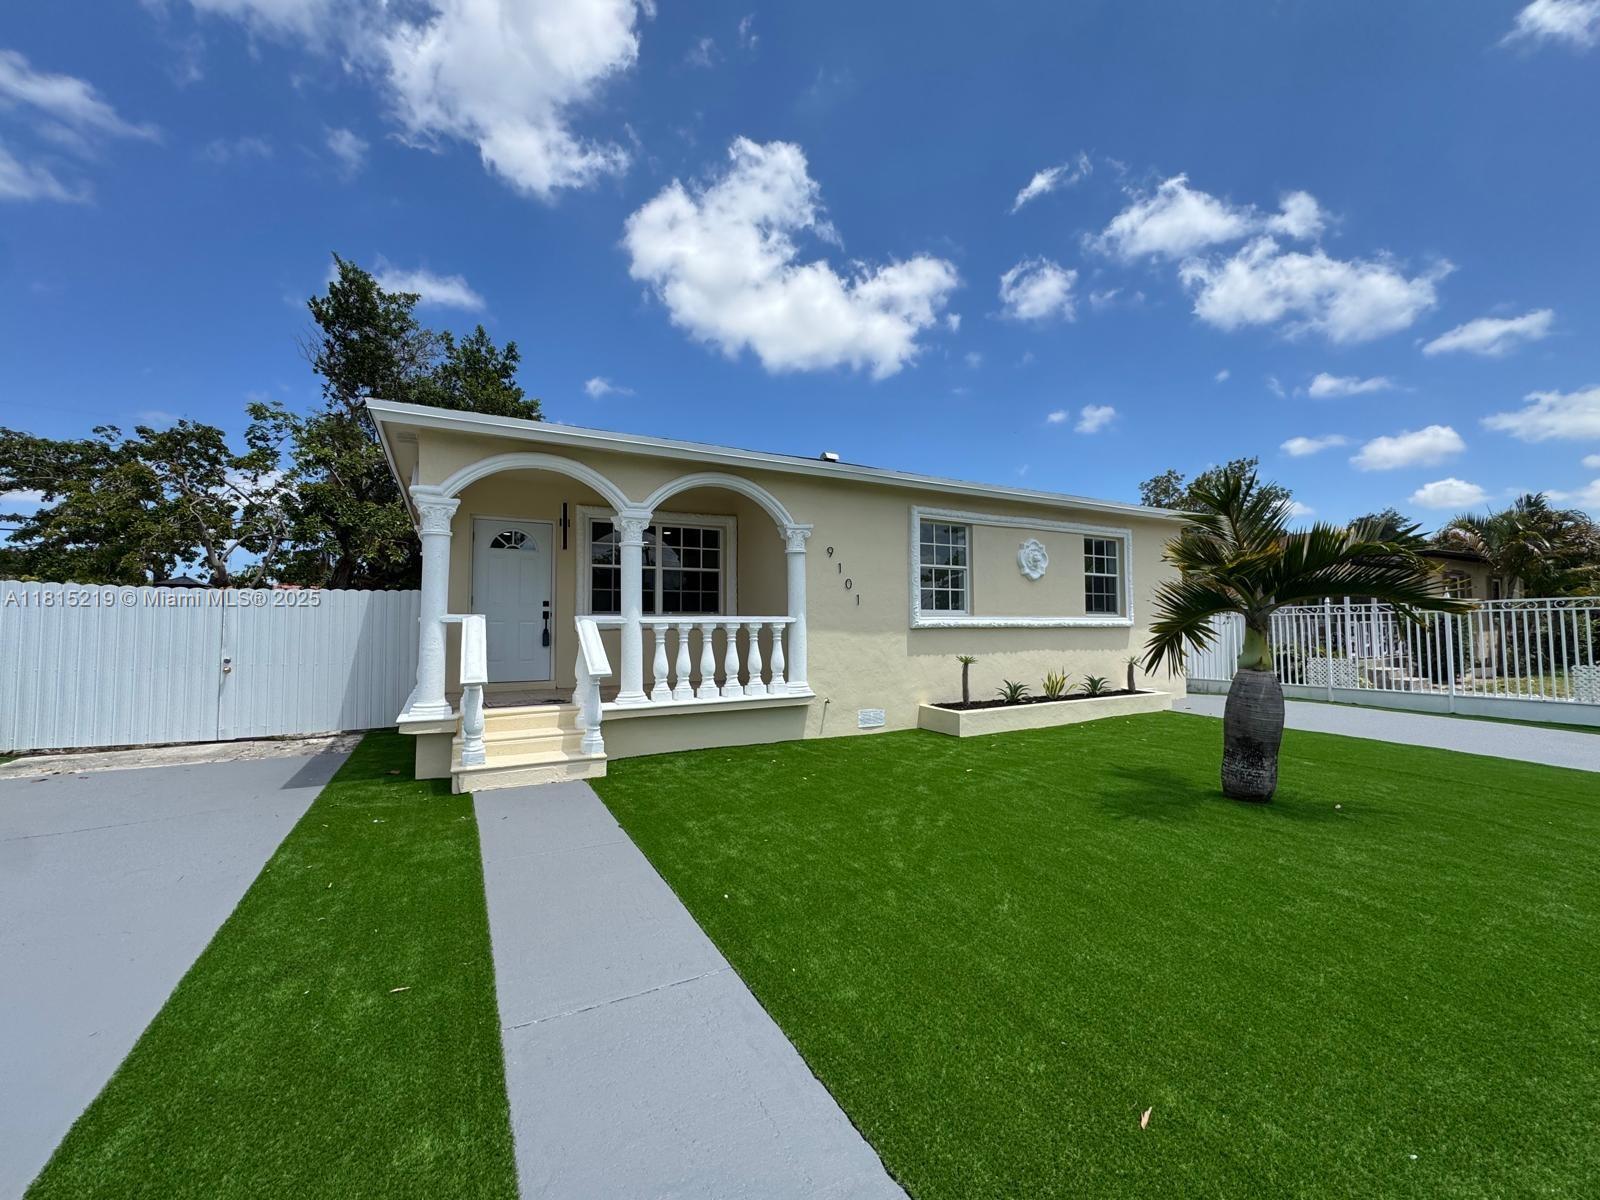
Active
$559,000
3
bds
|
2
ba
|
1,014
sqft
|
built
1951
9101 NW 35th Ct, Miami, FL 33147
$-1,159
Cash flow
-10.8%
Cash-on-Cash Return
3.8%
Cap rate
0.5%
Rent to Value Ratio
Active
$220,000
1
bds
|
1
ba
|
699
sqft
|
built
1971
9001 SW 77th Ave, Miami, FL 33156
$-691
Cash flow
-16.4%
Cash-on-Cash Return
2.5%
Cap rate
0.8%
Rent to Value Ratio
Active
$290,000
2
bds
|
1
ba
|
901
sqft
|
built
1970
5400 SW 77th Ct, Miami, FL 33155
$-817
Cash flow
-14.7%
Cash-on-Cash Return
2.9%
Cap rate
0.8%
Rent to Value Ratio
Active
$199,900
bds
|
1
ba
|
400
sqft
|
built
1980
555 NE 15th St, Miami, FL 33132
$-1,083
Cash flow
-28.3%
Cash-on-Cash Return
-0.2%
Cap rate
1.0%
Rent to Value Ratio
Active
$580,000
1
bds
|
1
ba
|
764
sqft
|
built
2003
1395 Brickell Ave, Miami, FL 33131
$-1,631
Cash flow
-14.7%
Cash-on-Cash Return
2.9%
Cap rate
0.7%
Rent to Value Ratio
Active
$1,100,000
4
bds
|
0
ba
|
2,765
sqft
|
built
1938
1051 NE 149th St, Miami, FL 33161
$-4,644
Cash flow
-22.0%
Cash-on-Cash Return
1.2%
Cap rate
0.2%
Rent to Value Ratio
Active
$385,000
1
bds
|
1
ba
|
723
sqft
|
built
2004
2001 Biscayne Blvd, Miami, FL 33137
$-1,623
Cash flow
-22.0%
Cash-on-Cash Return
1.2%
Cap rate
0.7%
Rent to Value Ratio
Active
$975,000
5
bds
|
0
ba
|
3,082
sqft
|
built
1947
435 NW 44th Ave, Miami, FL 33126
$-3,938
Cash flow
-21.1%
Cash-on-Cash Return
1.4%
Cap rate
0.3%
Rent to Value Ratio
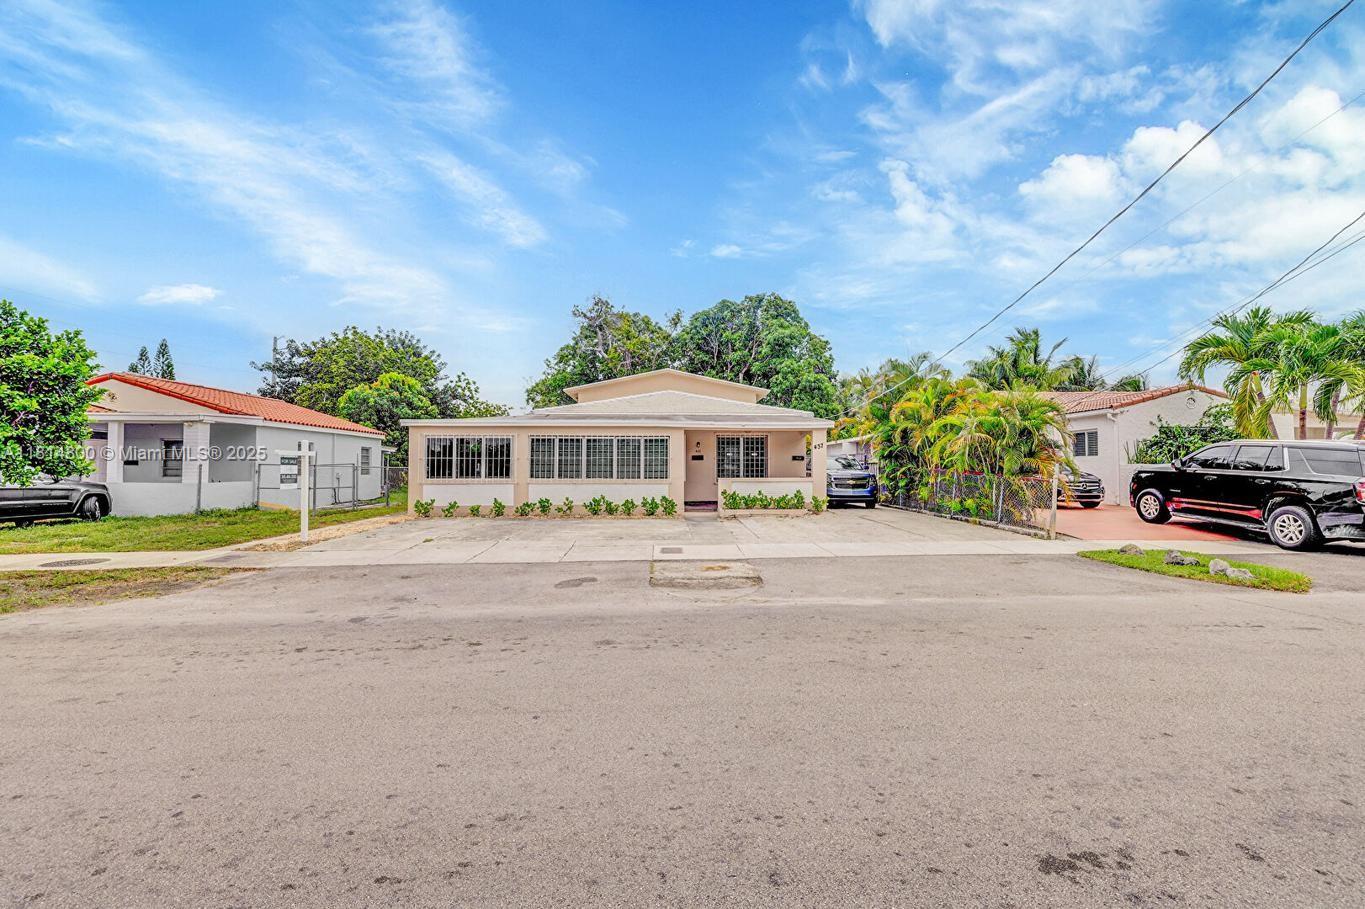
Active
$750,000
4
bds
|
3
ba
|
1,784
sqft
|
built
1988
17307 SW 115th Ave, Miami, FL 33157
$-1,965
Cash flow
-13.7%
Cash-on-Cash Return
3.1%
Cap rate
0.4%
Rent to Value Ratio
Active
$799,999
5
bds
|
3
ba
|
2,522
sqft
|
built
1954
2232 SW 82nd Ct, Miami, FL 33155
$-1,653
Cash flow
-10.8%
Cash-on-Cash Return
3.8%
Cap rate
0.5%
Rent to Value Ratio
Active
$1,050,000
3
bds
|
2
ba
|
1,775
sqft
|
built
1968
9941 SW 97th Ct, Miami, FL 33176
$-1,918
Cash flow
-9.5%
Cash-on-Cash Return
4.1%
Cap rate
0.6%
Rent to Value Ratio
Active
$295,000
2
bds
|
2
ba
|
1,312
sqft
|
built
1981
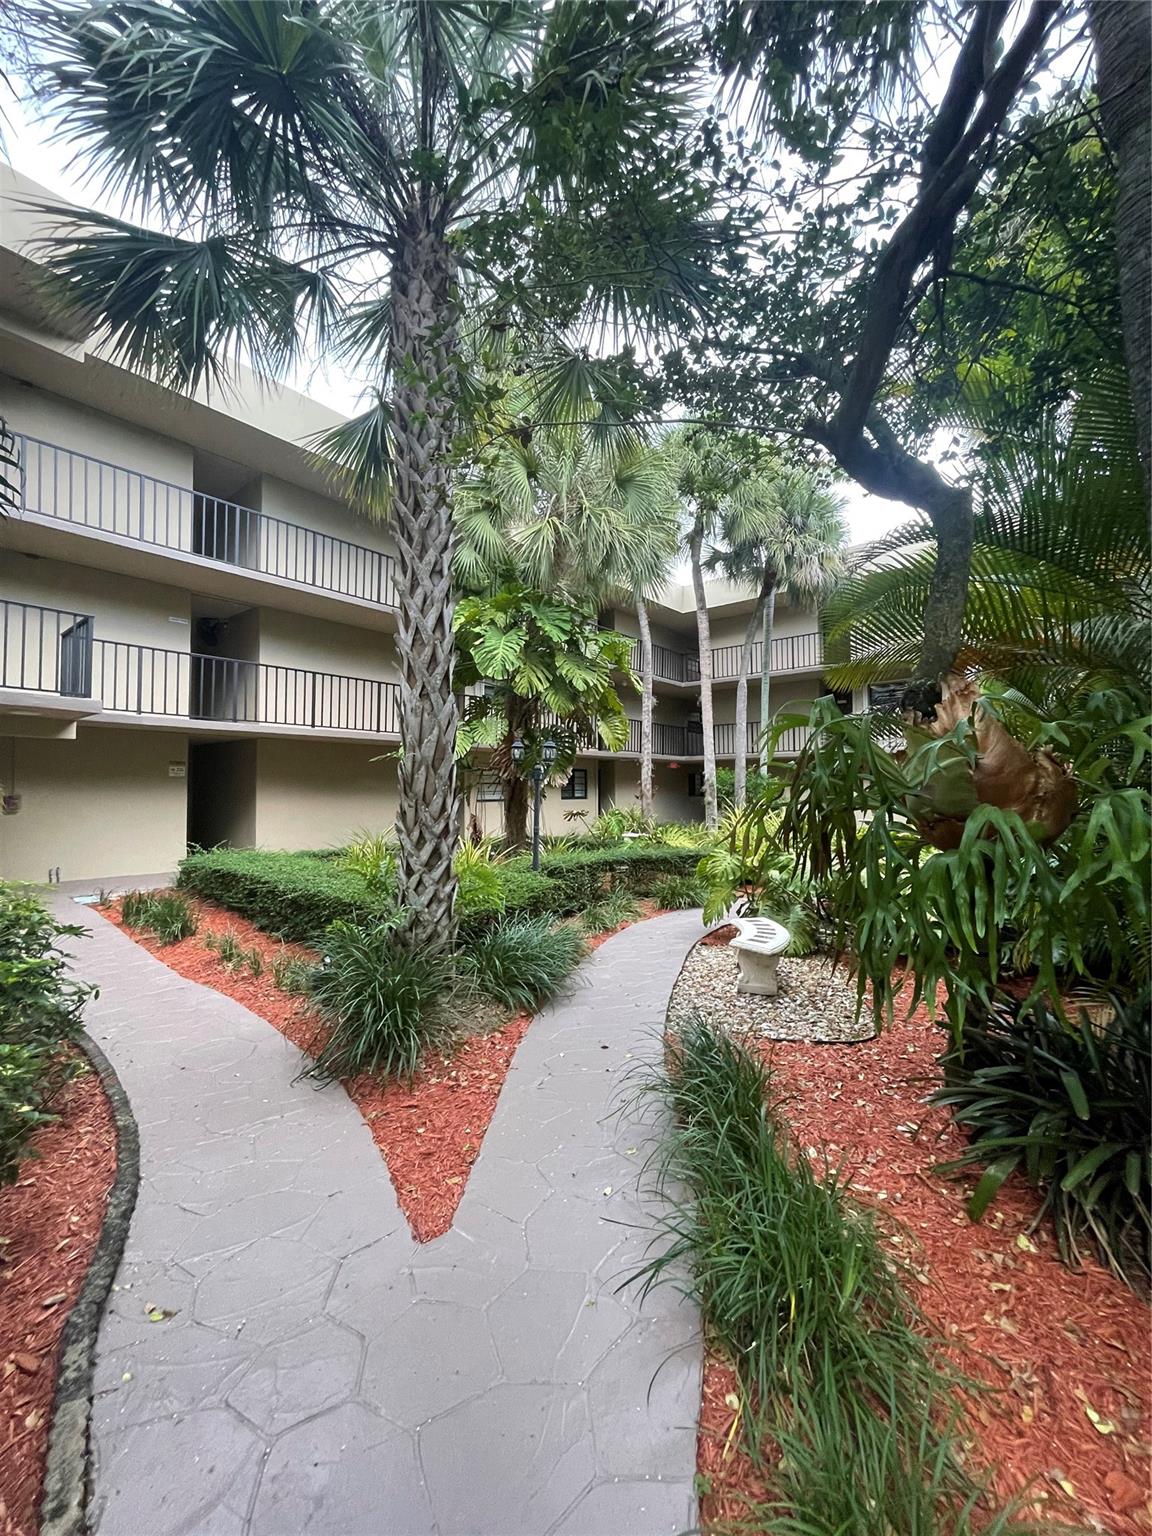
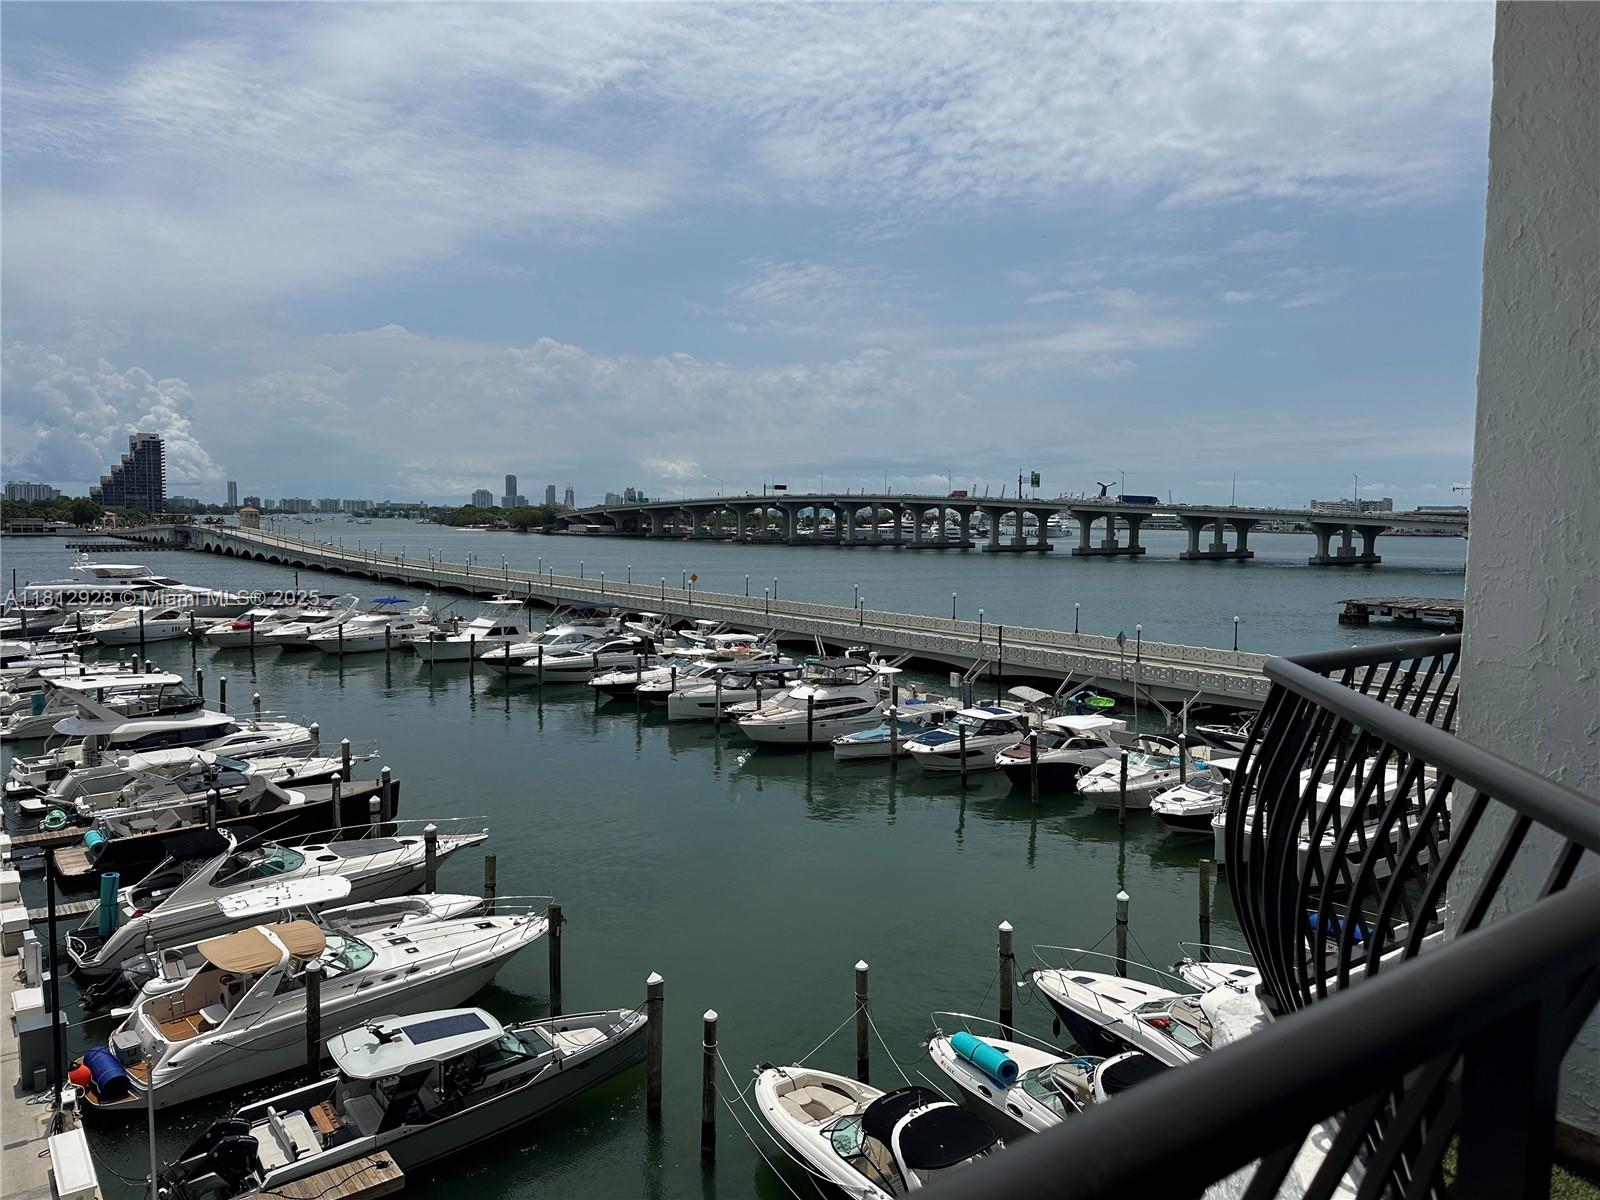
1000 Quayside Ter, Miami, FL 33138
$-1,078
Cash flow
-19.1%
Cash-on-Cash Return
1.9%
Cap rate
1.1%
Rent to Value Ratio
Active
$430,000
1
bds
|
1
ba
|
651
sqft
|
built
2007
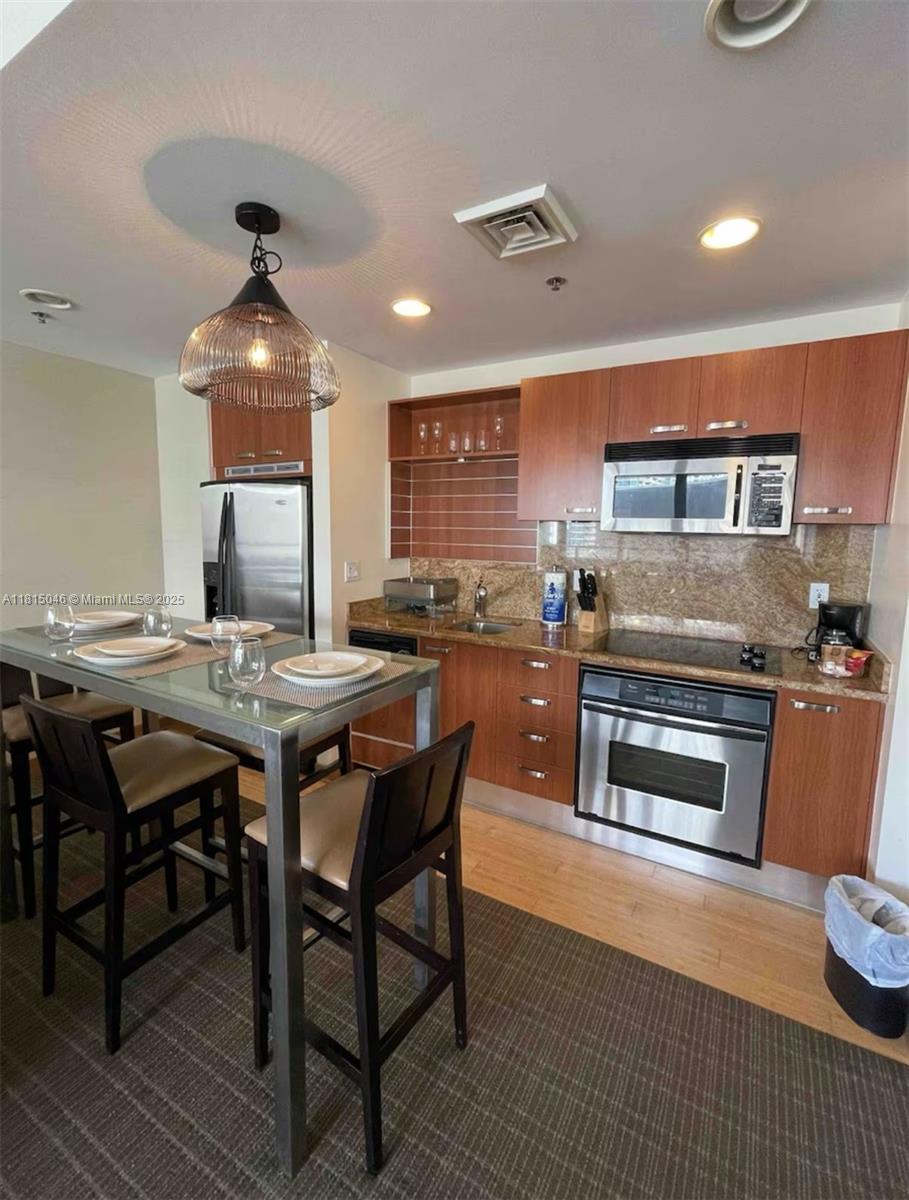
1900 N Bayshore Dr, Miami, FL 33132
$-1,119
Cash flow
-13.6%
Cash-on-Cash Return
3.2%
Cap rate
0.7%
Rent to Value Ratio
Active
$2,680,000
6
bds
|
8
ba
|
4,758
sqft
|
built
1983
2840 SW 128th Ave, Miami, FL 33175
$-9,593
Cash flow
-18.7%
Cash-on-Cash Return
2.0%
Cap rate
0.3%
Rent to Value Ratio
Active
$575,000
3
bds
|
2
ba
|
1,308
sqft
|
built
1998
15120 SW 140th Ter, Miami, FL 33196
$-1,267
Cash flow
-11.5%
Cash-on-Cash Return
3.6%
Cap rate
0.5%
Rent to Value Ratio
Active
$875,000
2
bds
|
2
ba
|
1,084
sqft
|
built
2006
3145 Day Ave, Miami, FL 33133
$-3,174
Cash flow
-18.9%
Cash-on-Cash Return
1.9%
Cap rate
0.4%
Rent to Value Ratio
Active
$1,040,000
1
bds
|
2
ba
|
1,022
sqft
|
built
2019
1000 Brickell Ave, Miami, FL 33131
$-4,825
Cash flow
-24.2%
Cash-on-Cash Return
0.7%
Cap rate
0.4%
Rent to Value Ratio
Active
$185,000
1
bds
|
1
ba
|
539
sqft
|
built
1985
1241 NW 6th St, Miami, FL 33125
$60
Cash flow
1.7%
Cash-on-Cash Return
6.7%
Cap rate
1.0%
Rent to Value Ratio
Active
$700,000
2
bds
|
2
ba
|
1,467
sqft
|
built
1975
1901 Brickell Ave, Miami, FL 33129
$-1,693
Cash flow
-12.6%
Cash-on-Cash Return
3.4%
Cap rate
0.7%
Rent to Value Ratio
Active
$619,000
4
bds
|
2
ba
|
1,400
sqft
|
built
1955
11240 SW 47th St, Miami, FL 33165
$-1,517
Cash flow
-12.8%
Cash-on-Cash Return
3.3%
Cap rate
0.6%
Rent to Value Ratio
Pending
$645,000
3
bds
|
2
ba
|
2,090
sqft
|
built
1992
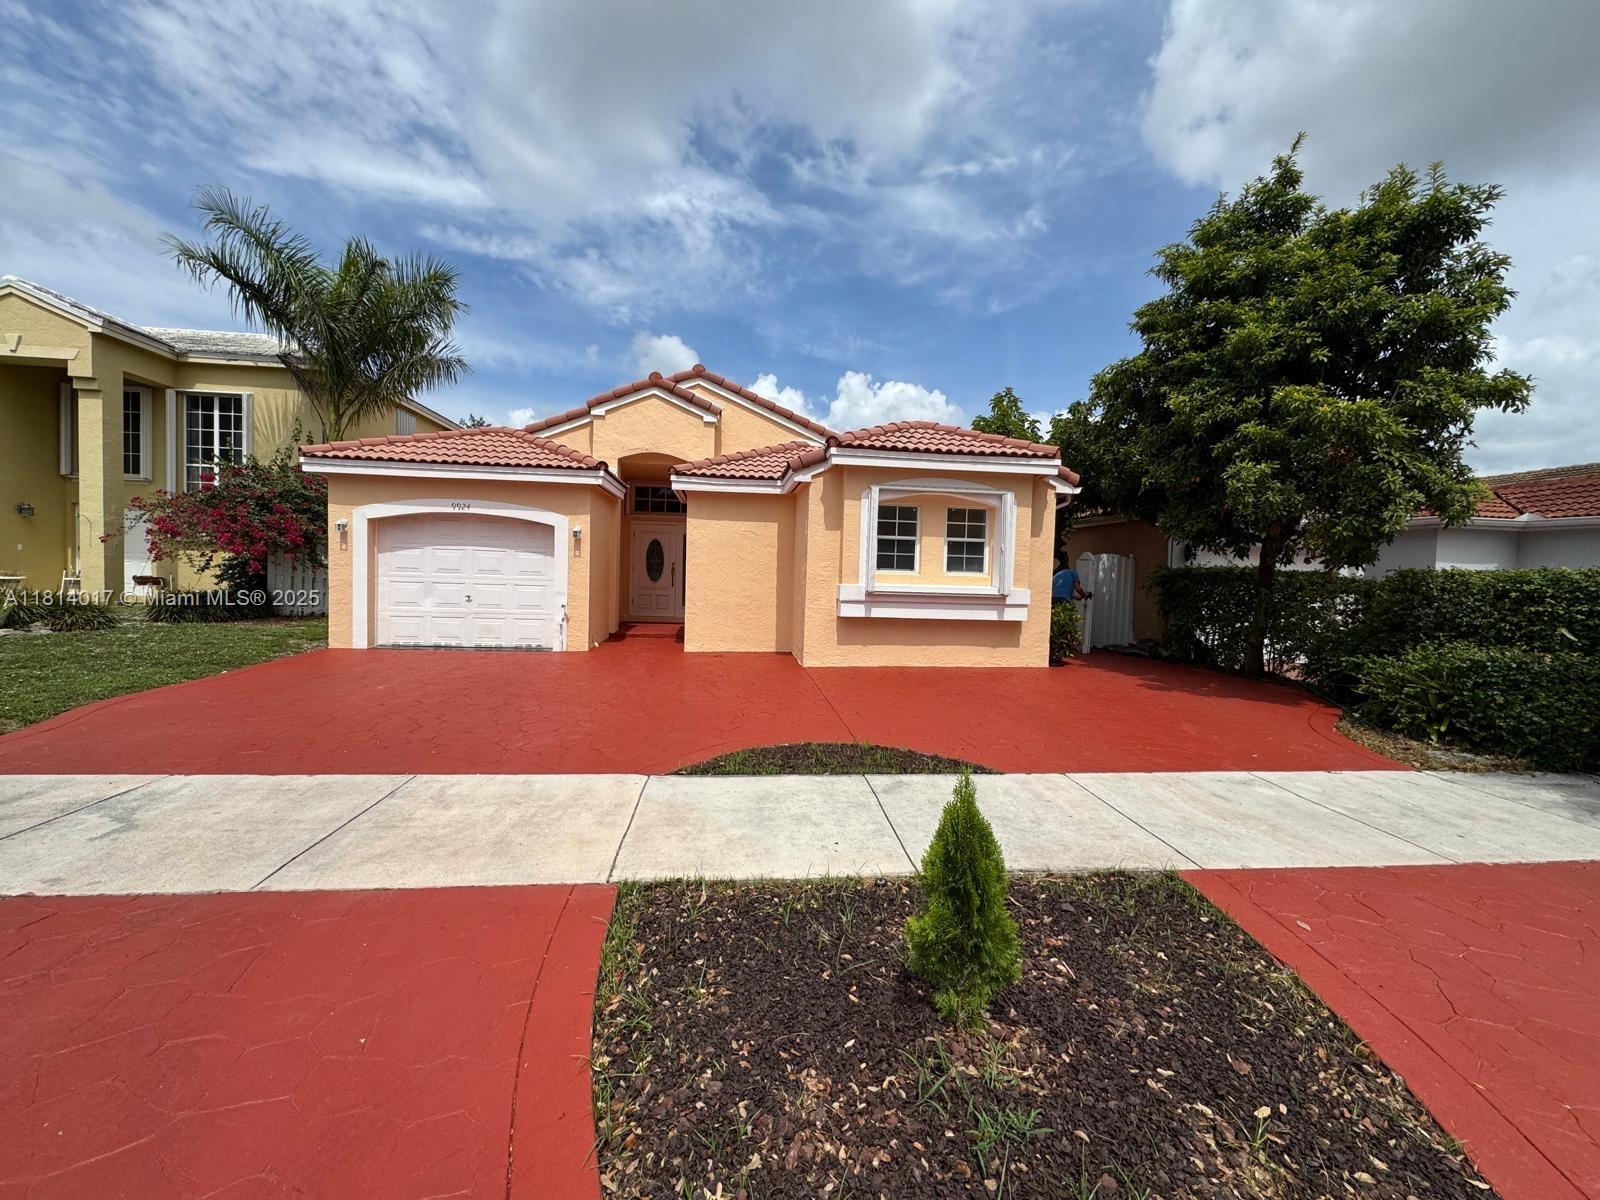
9924 SW 156th Ct, Miami, FL 33196
$-1,674
Cash flow
-13.5%
Cash-on-Cash Return
3.2%
Cap rate
0.4%
Rent to Value Ratio
Active
$1,580,000
3
bds
|
3
ba
|
2,128
sqft
|
built
2006
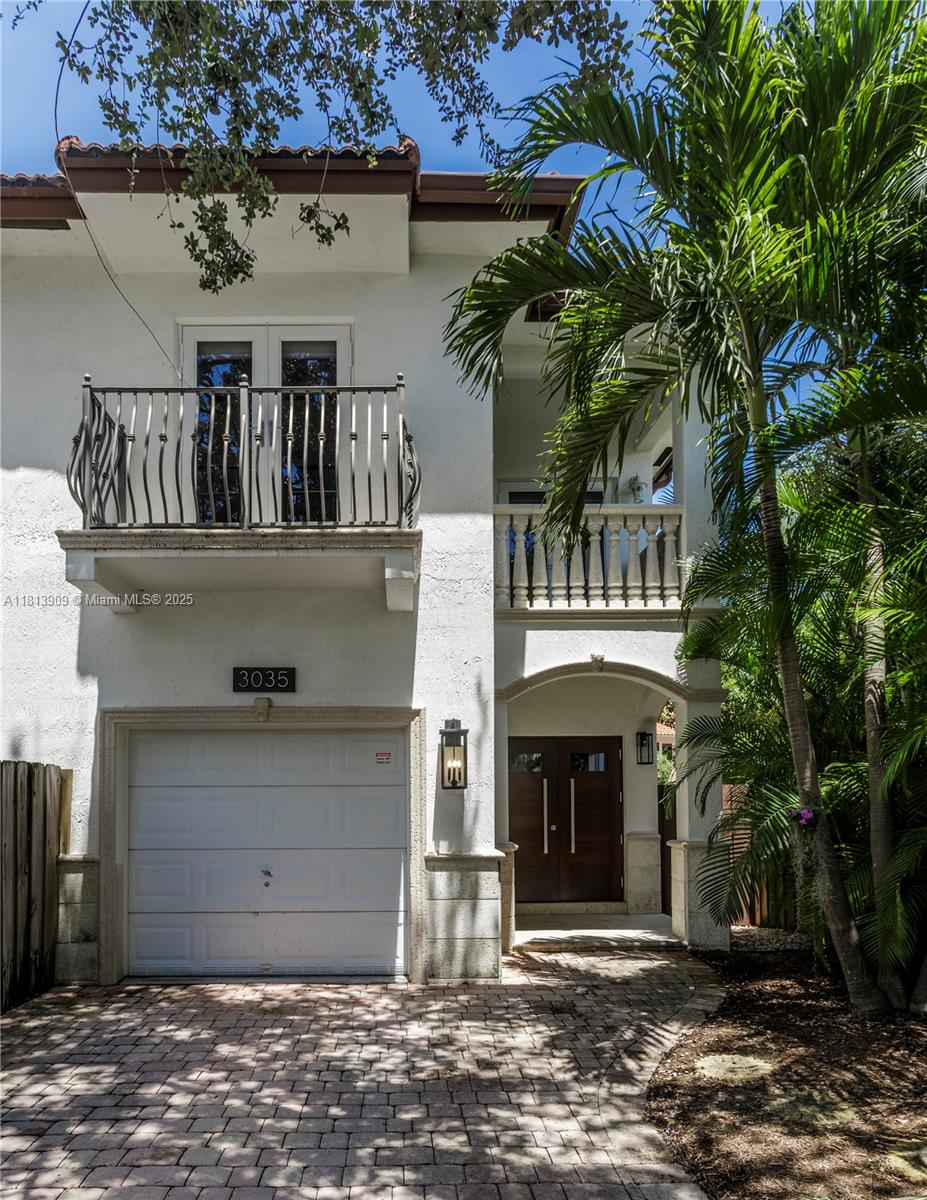
3035 Ohio St, Miami, FL 33133
$-4,845
Cash flow
-16.0%
Cash-on-Cash Return
2.6%
Cap rate
0.4%
Rent to Value Ratio

Pending
$2,300,000
3
bds
|
3
ba
|
1,281
sqft
|
built
2018
2831 S Bayshore Dr, Miami, FL 33133
$-8,094
Cash flow
-18.4%
Cash-on-Cash Return
2.1%
Cap rate
0.5%
Rent to Value Ratio
Active
$2,399,000
3
bds
|
2
ba
|
1,902
sqft
|
built
1949
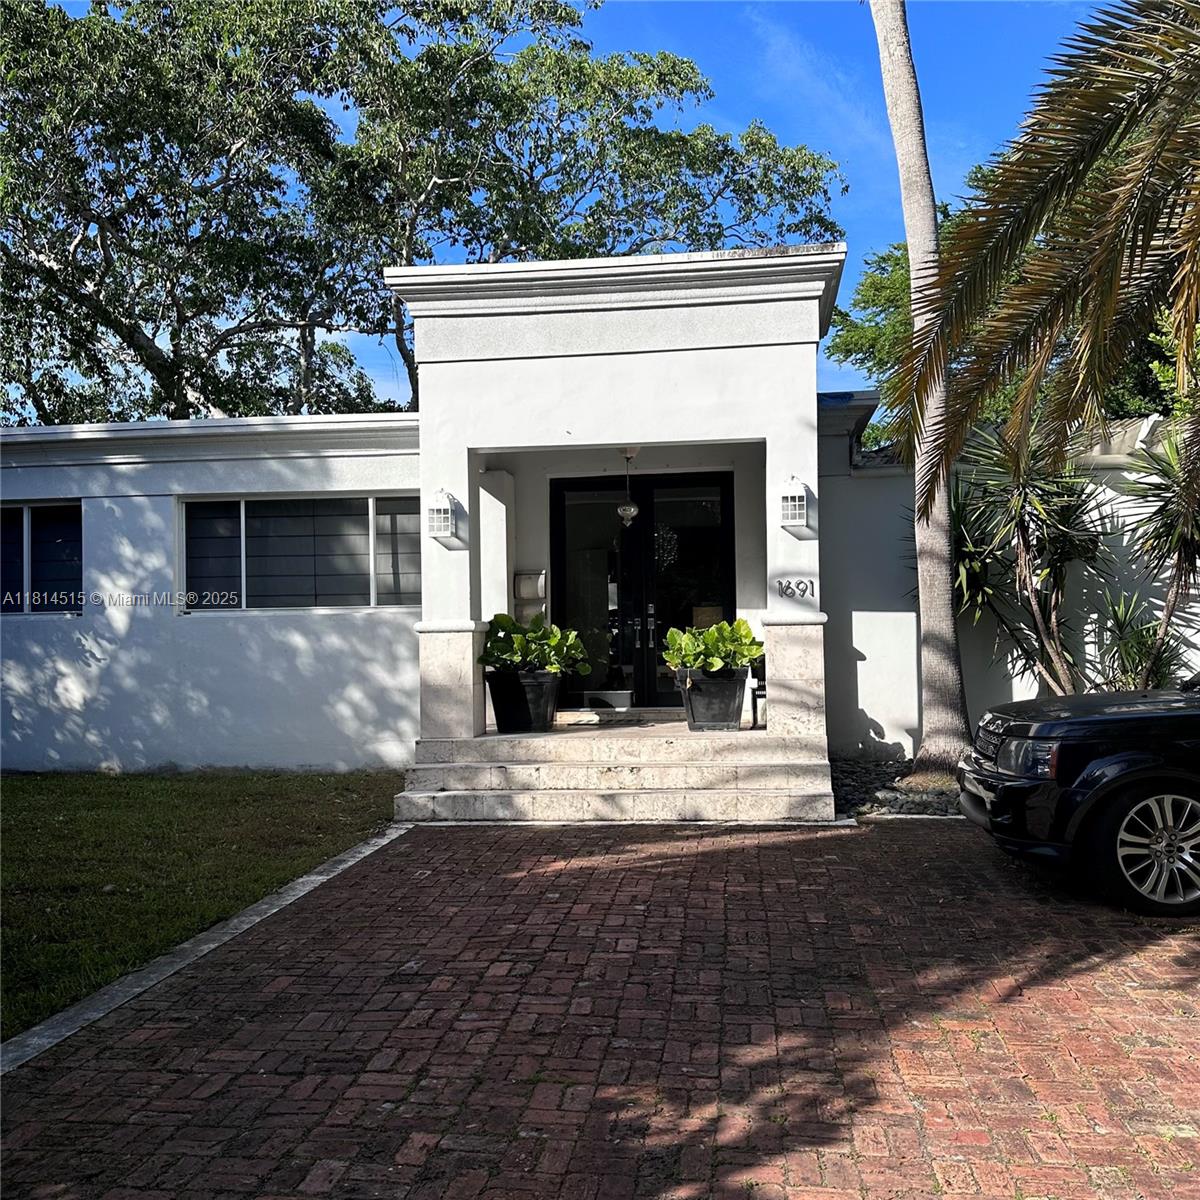
1691 Nethia Dr, Miami, FL 33133
$-8,109
Cash flow
-17.6%
Cash-on-Cash Return
2.2%
Cap rate
0.3%
Rent to Value Ratio
Active
$875,000
4
bds
|
2
ba
|
1,772
sqft
|
built
1952
8331 SW 38th St, Miami, FL 33155
$-2,300
Cash flow
-13.7%
Cash-on-Cash Return
3.1%
Cap rate
0.4%
Rent to Value Ratio
Active
$589,950
3
bds
|
3
ba
|
1,677
sqft
|
built
1997
16306 SW 100th Ter, Miami, FL 33196
$-1,539
Cash flow
-13.6%
Cash-on-Cash Return
3.2%
Cap rate
0.6%
Rent to Value Ratio
Active
$430,000
2
bds
|
1
ba
|
835
sqft
|
built
1977
5408 SW 138th Ave, Miami, FL 33175
$-866
Cash flow
-10.5%
Cash-on-Cash Return
3.9%
Cap rate
0.6%
Rent to Value Ratio
Active
$479,000
2
bds
|
3
ba
|
1,755
sqft
|
built
1981
1456 SW 134th Pl, Miami, FL 33184
$-878
Cash flow
-9.6%
Cash-on-Cash Return
4.1%
Cap rate
0.6%
Rent to Value Ratio

Active
$760,000
4
bds
|
2
ba
|
1,649
sqft
|
built
2003
12661 SW 222nd Ter, Miami, FL 33170
$-1,950
Cash flow
-13.4%
Cash-on-Cash Return
3.2%
Cap rate
0.4%
Rent to Value Ratio

Active
$735,000
2
bds
|
2
ba
|
1,215
sqft
|
built
2007
3250 NE 1st Ave, Miami, FL 33137
$-3,586
Cash flow
-25.5%
Cash-on-Cash Return
0.4%
Cap rate
0.6%
Rent to Value Ratio