Miami, FL Investment Properties for Sale
Browse homes for sale and investment properties in Miami, FL. Refine your search by price, property type, or more.
Best cash flowing properties in Miami, FL
Active
$195,000
1
bds
|
1
ba
|
612
sqft
|
built
1968
9375 SW 40th Ter, Miami, FL 33165
$58
Cash flow
1.6%
Cash-on-Cash Return
6.5%
Cap rate
1.0%
Rent to Value Ratio

Active
$430,000
3
bds
|
2
ba
|
1,181
sqft
|
built
1935
2944 NW 44th St, Miami, FL 33142
$-455
Cash flow
-5.5%
Cash-on-Cash Return
4.9%
Cap rate
0.7%
Rent to Value Ratio
6,122 out of 6,953 properties for sale in Miami, FL
Limited Results Shown
Create a free account, or log in to reveal all property listings and enjoy the complete experience.
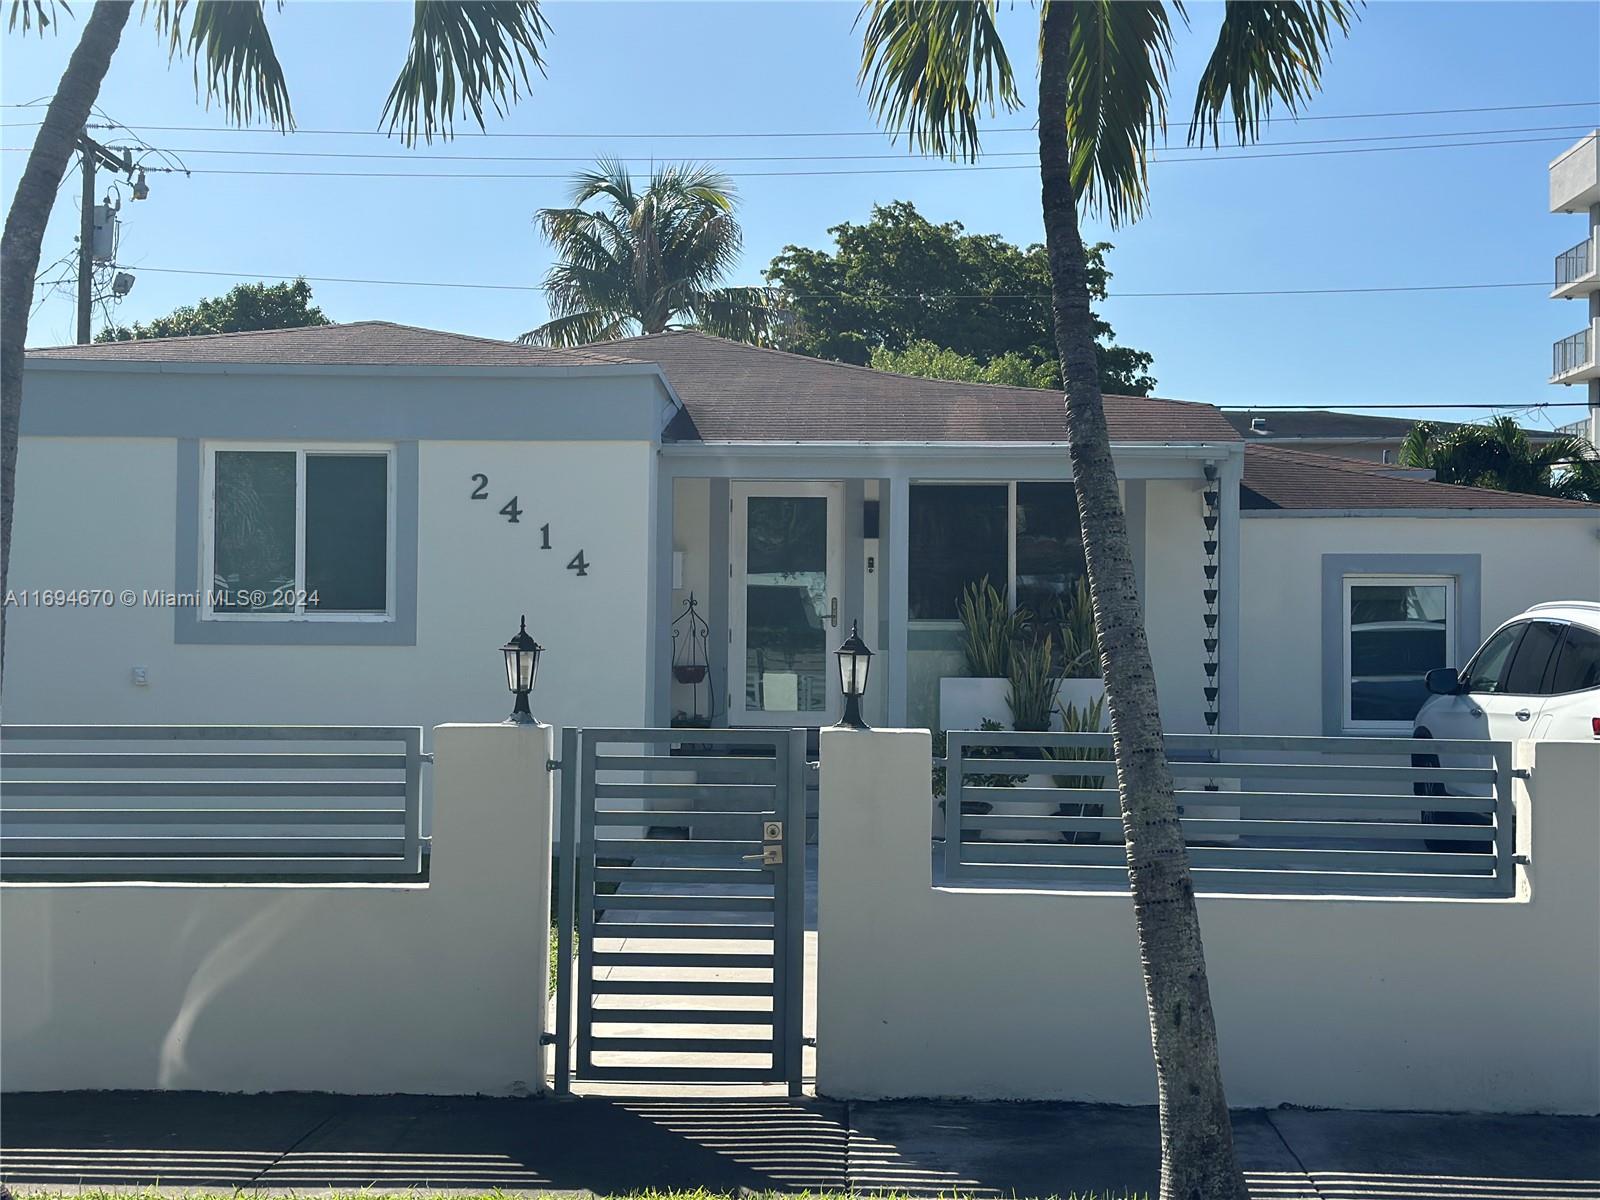
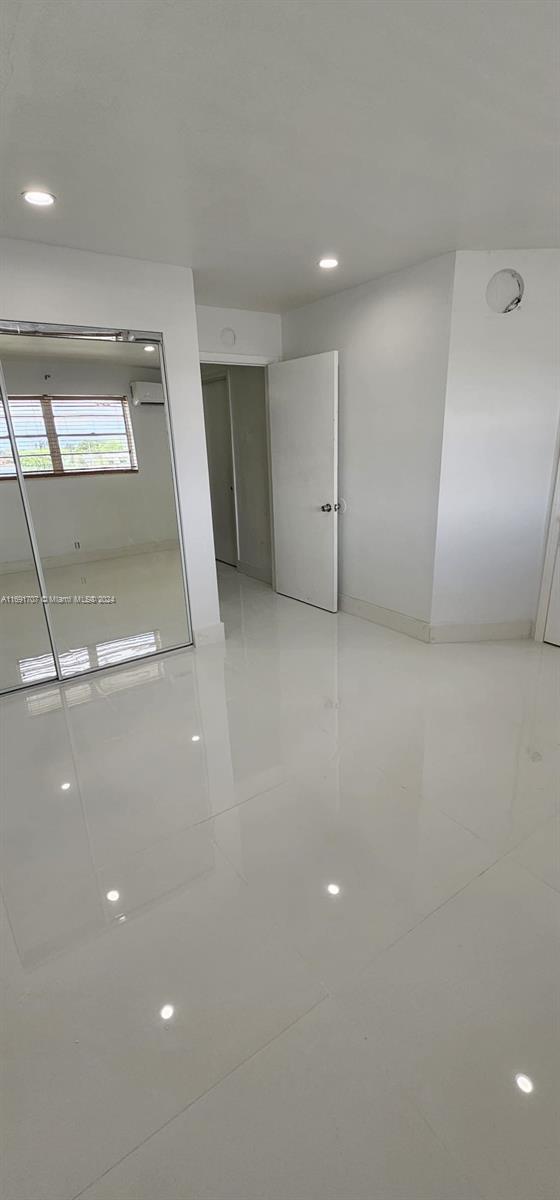
Active
$910,000
3
bds
|
2
ba
|
1,638
sqft
|
built
1940
2414 SW 21st Ter, Miami, FL 33145
$-2,060
Cash flow
-11.8%
Cash-on-Cash Return
3.4%
Cap rate
0.5%
Rent to Value Ratio

Active
$791,000
4
bds
|
4
ba
|
1,633
sqft
|
built
1940
1438 NW 27th St, Miami, FL 33142
$-1,902
Cash flow
-12.5%
Cash-on-Cash Return
3.3%
Cap rate
0.5%
Rent to Value Ratio
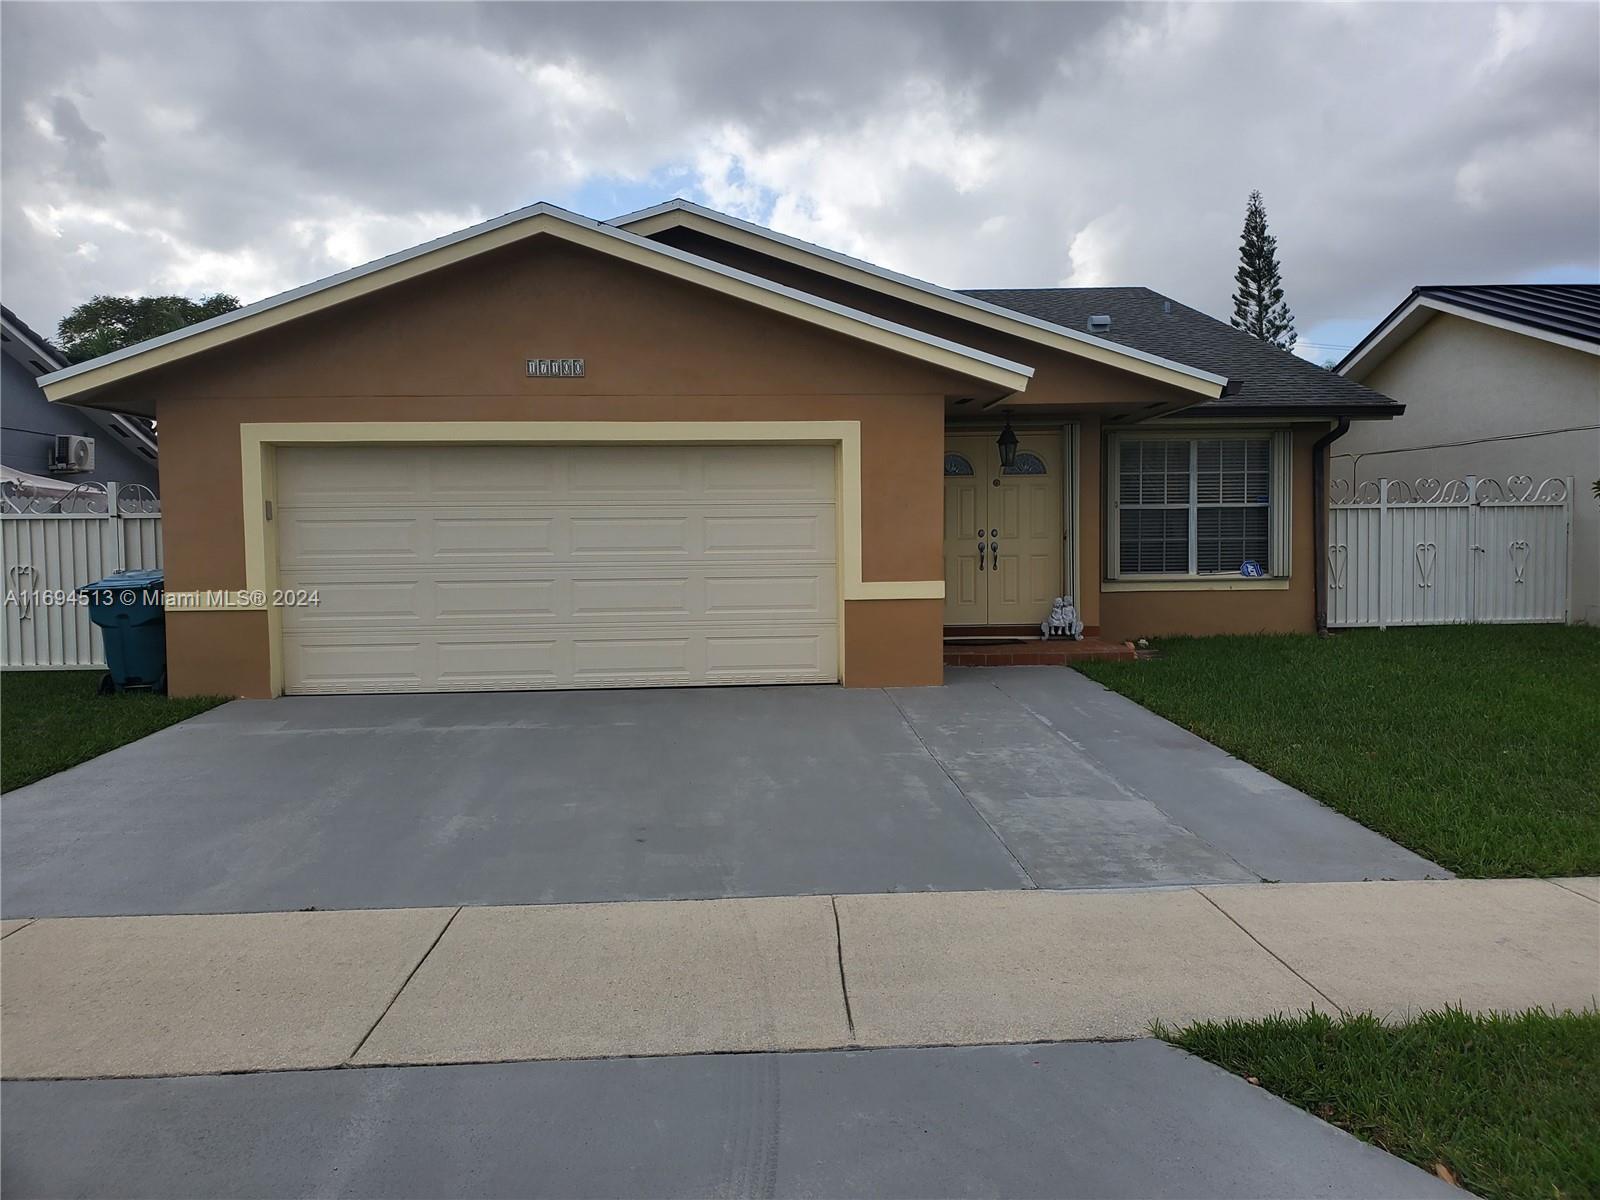
Active
$659,000
3
bds
|
2
ba
|
1,934
sqft
|
built
1993
17100 SW 145th Ct, Miami, FL 33177
$-1,120
Cash flow
-8.9%
Cash-on-Cash Return
4.1%
Cap rate
0.5%
Rent to Value Ratio

Active
$299,900
2
bds
|
2
ba
|
985
sqft
|
built
1981
8415 SW 107th Ave, Miami, FL 33173
$-523
Cash flow
-9.1%
Cash-on-Cash Return
4.1%
Cap rate
0.8%
Rent to Value Ratio
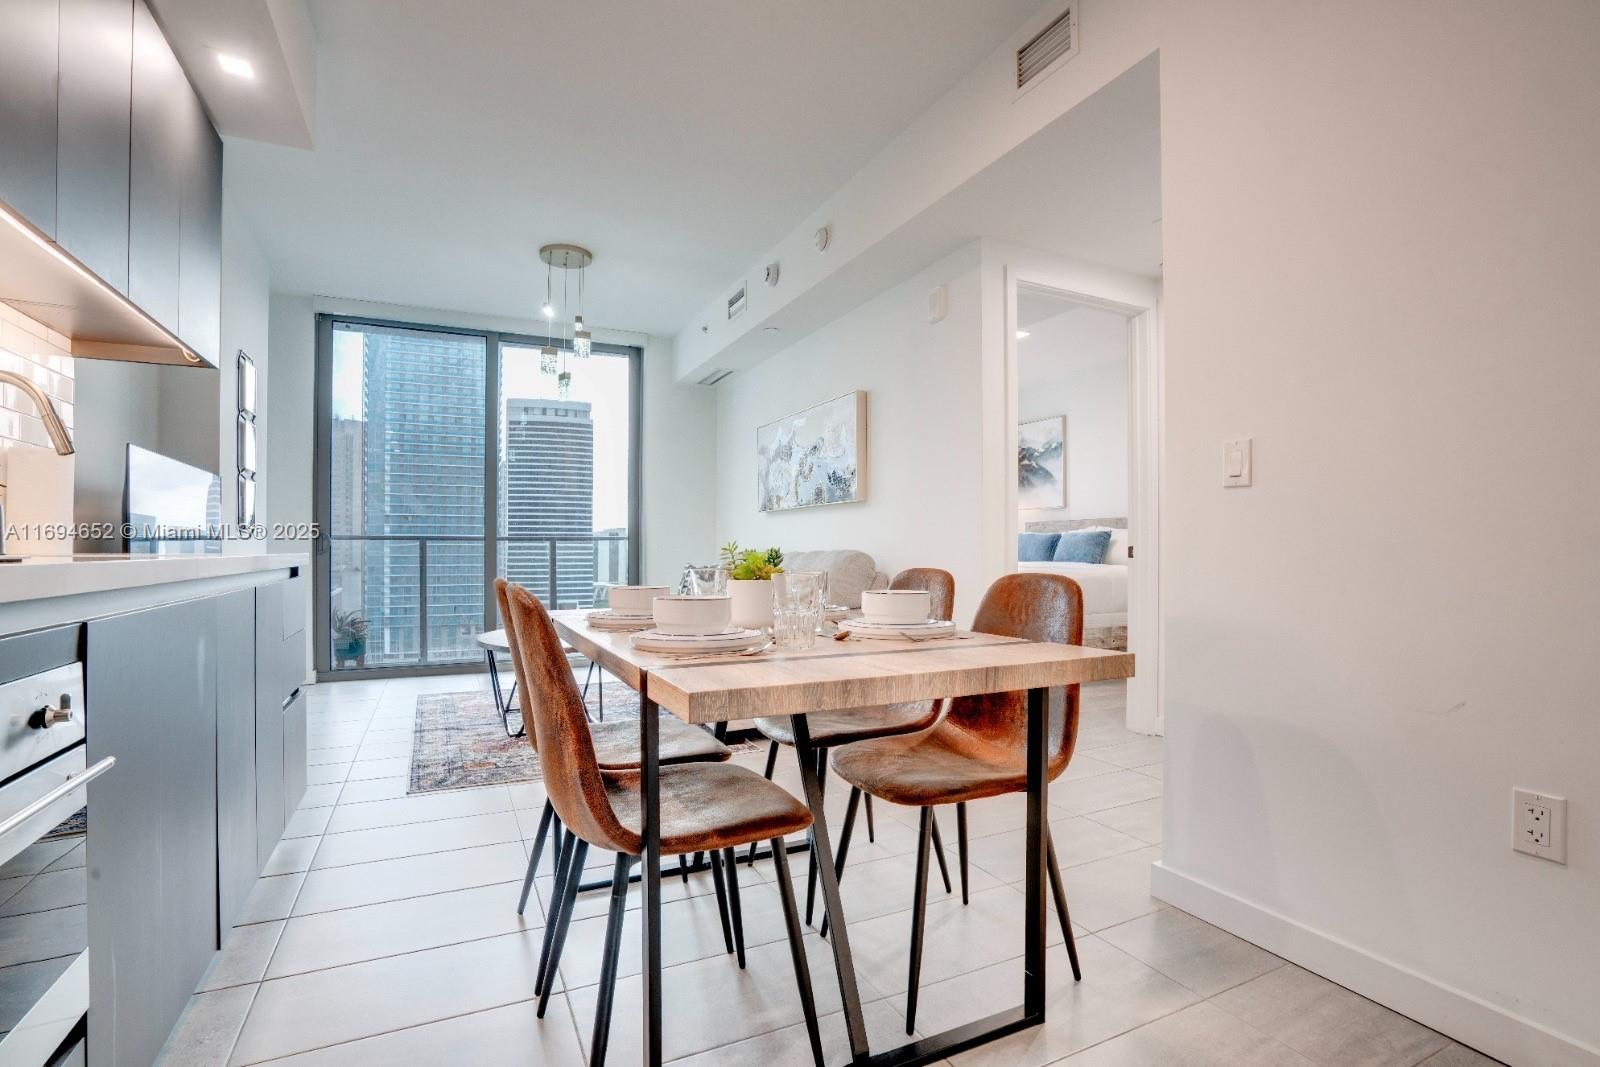
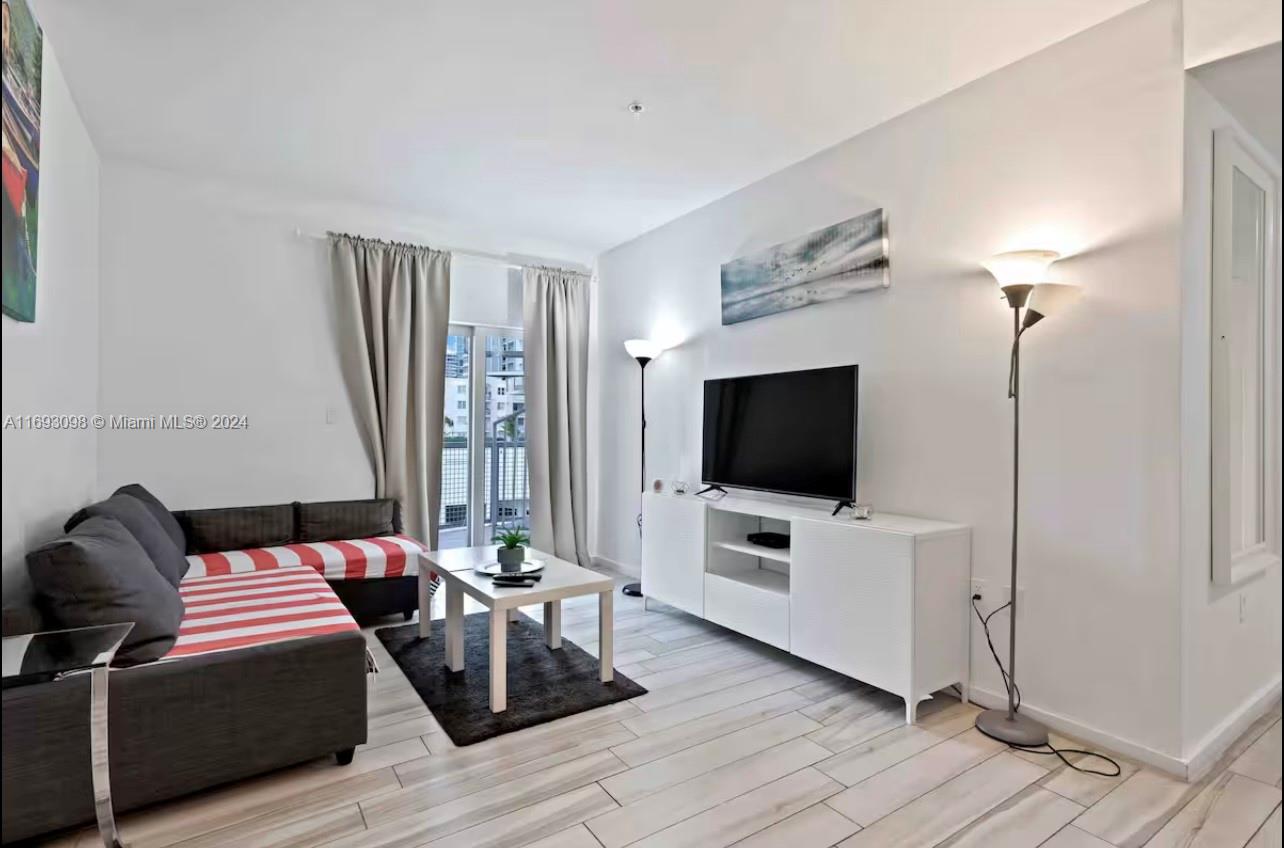
Active
$449,000
1
bds
|
1
ba
|
516
sqft
|
built
2022
227 NE 2nd St, Miami, FL 33132
$-1,608
Cash flow
-18.7%
Cash-on-Cash Return
1.8%
Cap rate
0.7%
Rent to Value Ratio

Active
$945,000
4
bds
|
3
ba
|
2,597
sqft
|
built
1977
8925 SW 11th St, Miami, FL 33174
$-1,664
Cash flow
-9.2%
Cash-on-Cash Return
4.0%
Cap rate
0.6%
Rent to Value Ratio
Active
$590,000
2
bds
|
2
ba
|
1,160
sqft
|
built
1980
555 NE 15th St, Miami, FL 33132
$-2,116
Cash flow
-18.7%
Cash-on-Cash Return
1.8%
Cap rate
0.7%
Rent to Value Ratio

Active
$695,000
3
bds
|
2
ba
|
1,438
sqft
|
built
2015
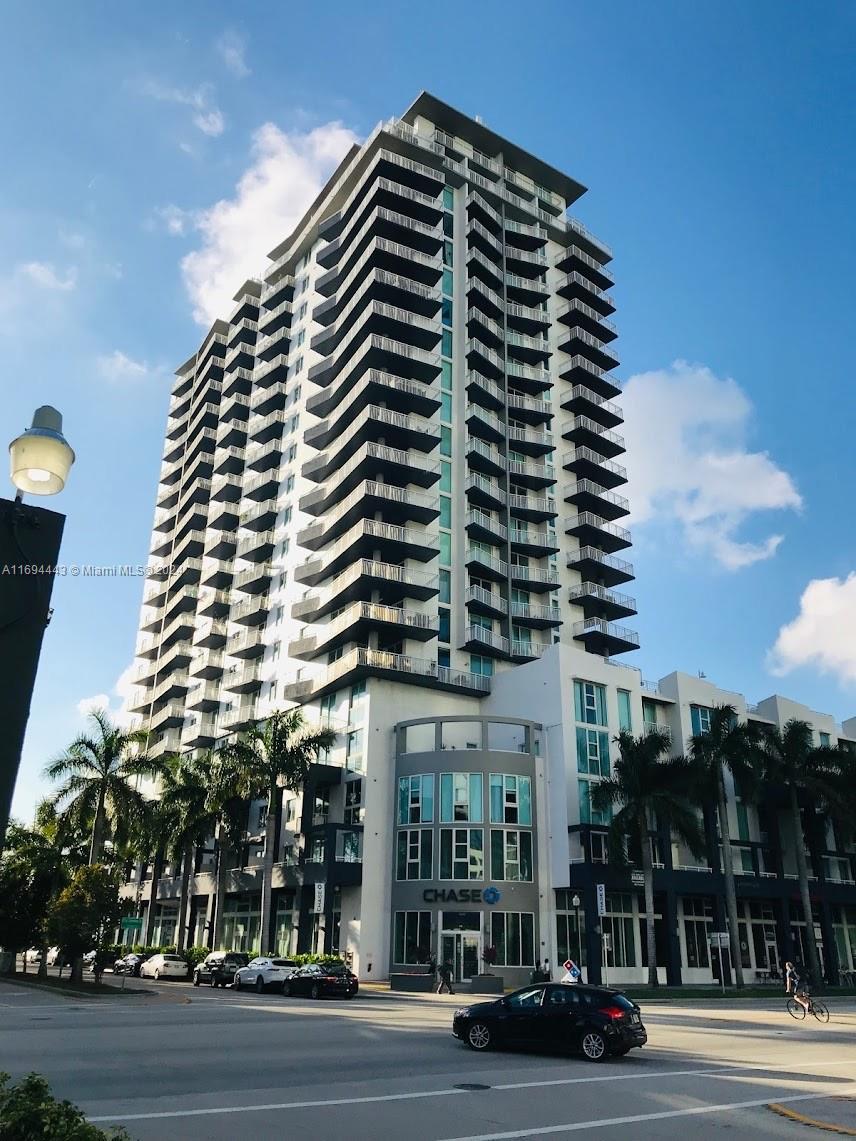
4250 Biscayne Blvd, Miami, FL 33137
$-2,868
Cash flow
-21.5%
Cash-on-Cash Return
1.2%
Cap rate
0.8%
Rent to Value Ratio
Active
$1,975,000
3
bds
|
3
ba
|
2,212
sqft
|
built
1937
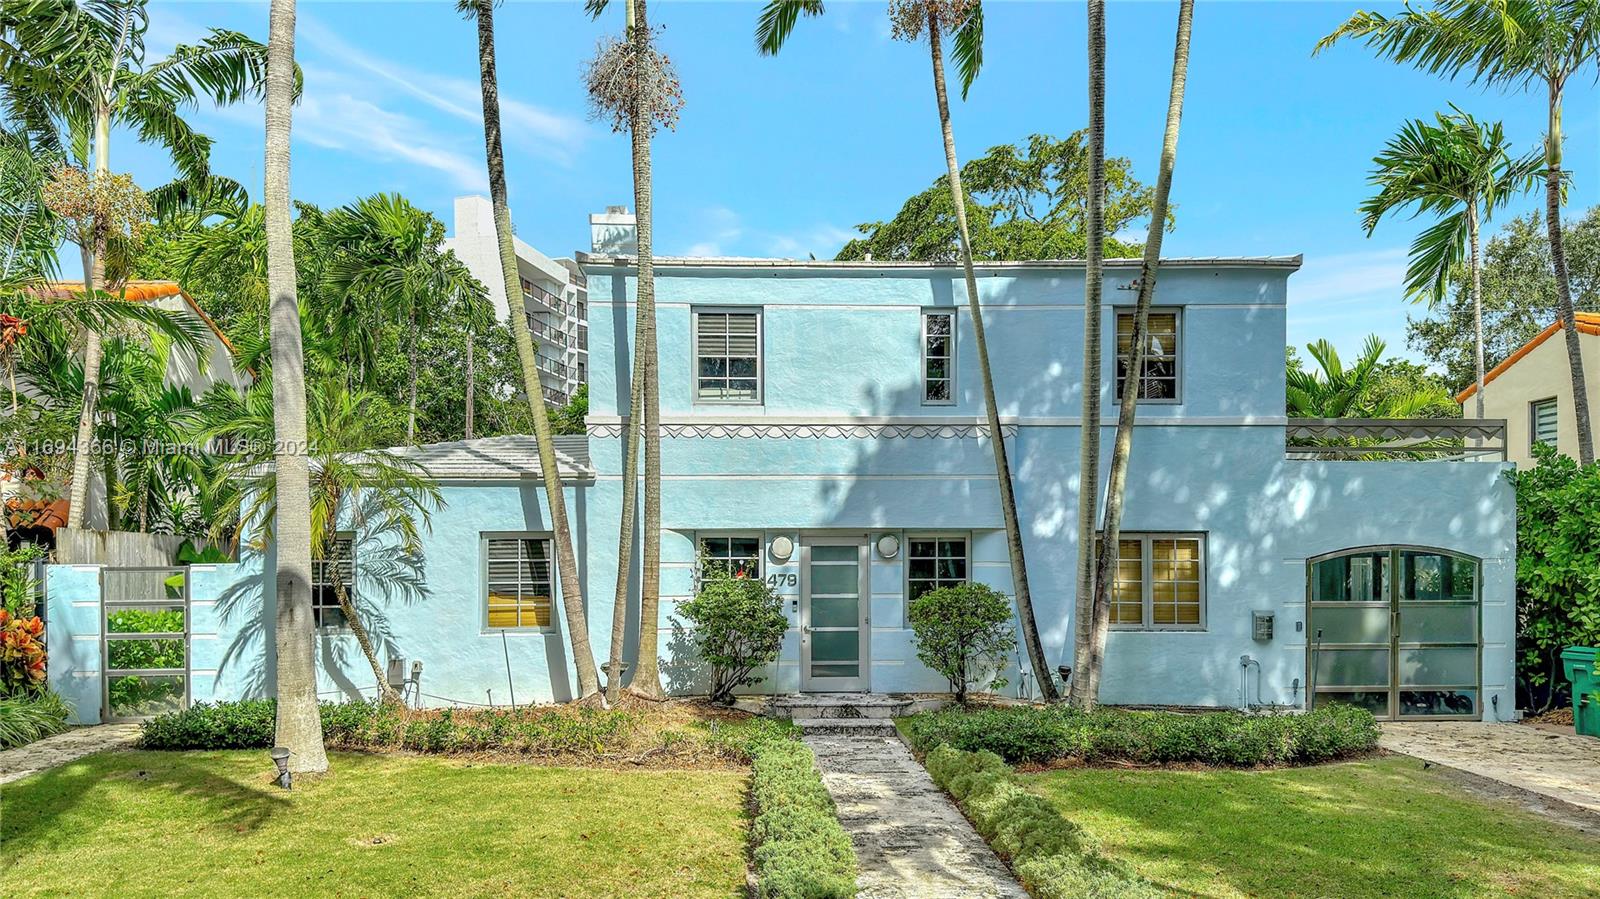
479 NE 56th St, Miami, FL 33137
$-6,896
Cash flow
-18.2%
Cash-on-Cash Return
2.0%
Cap rate
0.4%
Rent to Value Ratio
Active
$420,000
2
bds
|
2
ba
|
1,164
sqft
|
built
1982
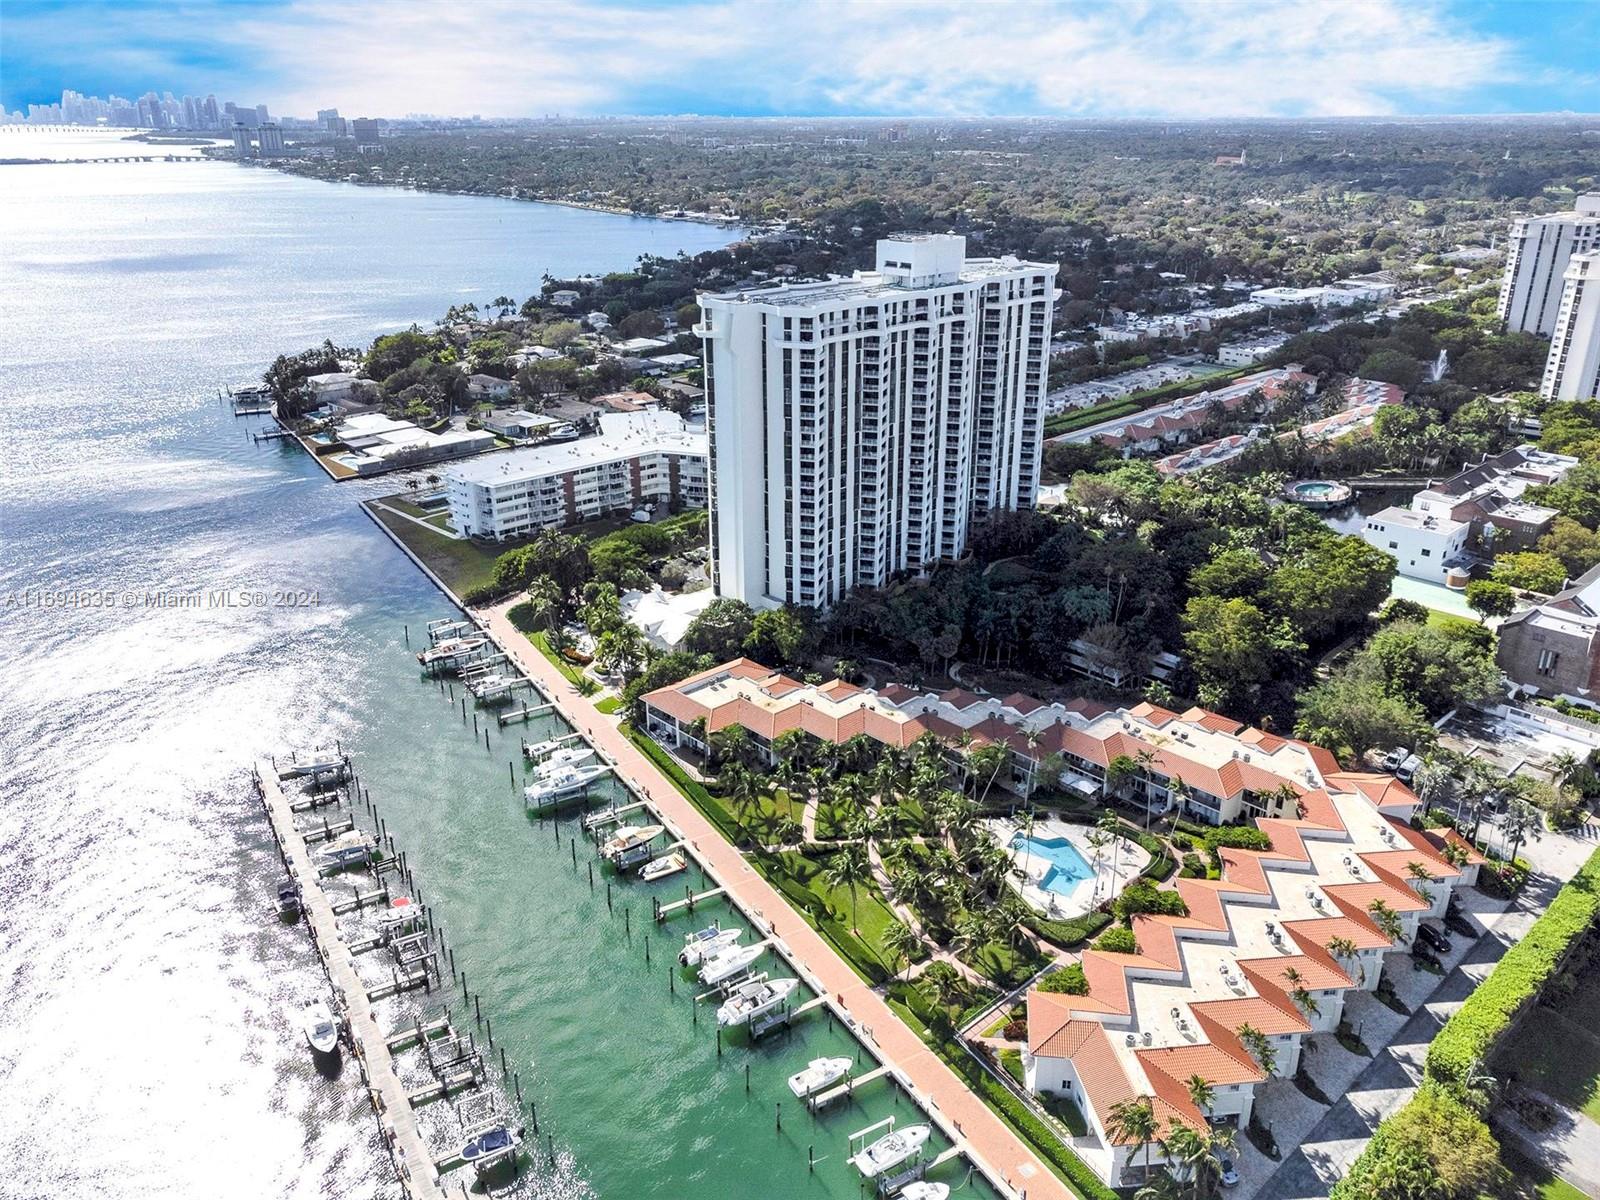
4000 Towerside Ter, Miami, FL 33138
$-817
Cash flow
-10.1%
Cash-on-Cash Return
3.8%
Cap rate
0.9%
Rent to Value Ratio

Active
$849,000
1
bds
|
2
ba
|
1,185
sqft
|
built
2019
851 NE 1st St, Miami, FL 33132
$-4,266
Cash flow
-26.2%
Cash-on-Cash Return
0.1%
Cap rate
0.5%
Rent to Value Ratio
Active
$475,000
2
bds
|
2
ba
|
1,087
sqft
|
built
2005
275 NE 18th St, Miami, FL 33132
$-1,517
Cash flow
-16.7%
Cash-on-Cash Return
2.3%
Cap rate
0.8%
Rent to Value Ratio
Active
$590,000
1
bds
|
1
ba
|
681
sqft
|
built
2018
121 NE 34th St, Miami, FL 33137
$-2,441
Cash flow
-21.6%
Cash-on-Cash Return
1.2%
Cap rate
0.6%
Rent to Value Ratio
Active
$1,260,000
1
bds
|
2
ba
|
1,210
sqft
|
built
1993
2127 Brickell Ave, Miami, FL 33129
$-5,018
Cash flow
-20.8%
Cash-on-Cash Return
1.4%
Cap rate
0.5%
Rent to Value Ratio
Active
$1,425,000
4
bds
|
0
ba
|
2,446
sqft
|
built
1955
900 SW 5th Ave, Miami, FL 33130
$-5,899
Cash flow
-21.6%
Cash-on-Cash Return
1.2%
Cap rate
0.2%
Rent to Value Ratio

Active
$325,000
2
bds
|
2
ba
|
960
sqft
|
built
1988
13820 SW 112th St, Miami, FL 33186
$-892
Cash flow
-14.3%
Cash-on-Cash Return
2.9%
Cap rate
0.8%
Rent to Value Ratio
Active
$329,000
1
bds
|
1
ba
|
564
sqft
|
built
2016
151 SE 1st St, Miami, FL 33131
$-1,192
Cash flow
-18.9%
Cash-on-Cash Return
1.8%
Cap rate
0.7%
Rent to Value Ratio
Active
$329,000
2
bds
|
2
ba
|
936
sqft
|
built
1981
10835 SW 112th Ave, Miami, FL 33176
$-1,000
Cash flow
-15.9%
Cash-on-Cash Return
2.5%
Cap rate
0.7%
Rent to Value Ratio
Active
$449,000
1
bds
|
2
ba
|
1,064
sqft
|
built
1975
1865 Brickell Ave, Miami, FL 33129
$-1,367
Cash flow
-15.9%
Cash-on-Cash Return
2.5%
Cap rate
0.7%
Rent to Value Ratio
Active
$410,000
1
bds
|
2
ba
|
997
sqft
|
built
1986
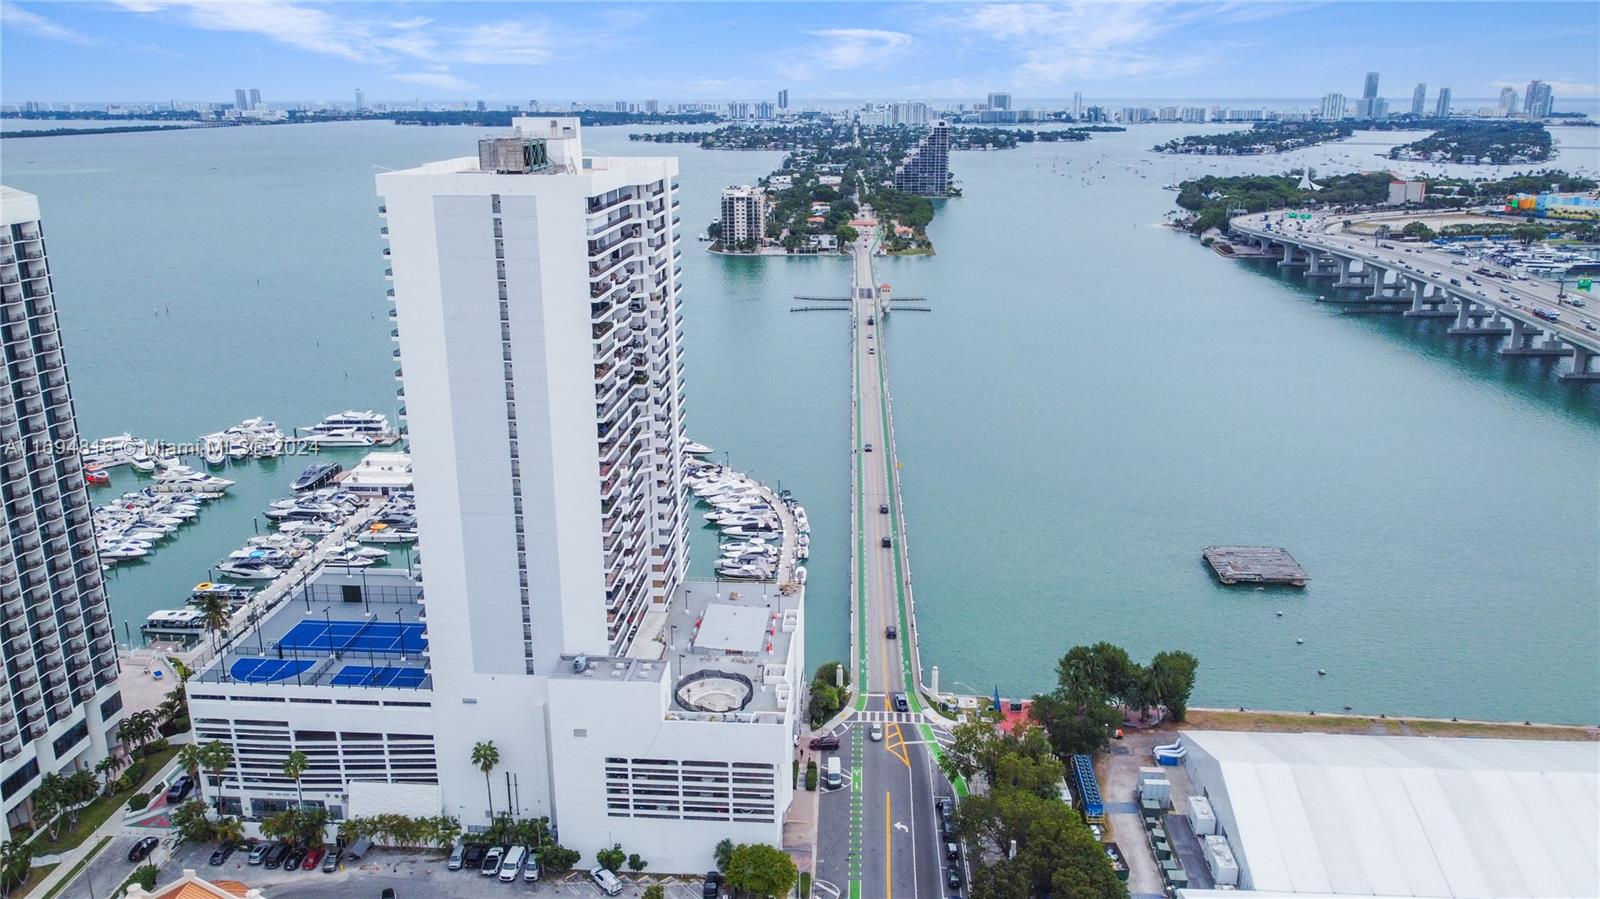
1717 N Bayshore Dr, Miami, FL 33132
$-1,162
Cash flow
-14.8%
Cash-on-Cash Return
2.7%
Cap rate
0.8%
Rent to Value Ratio
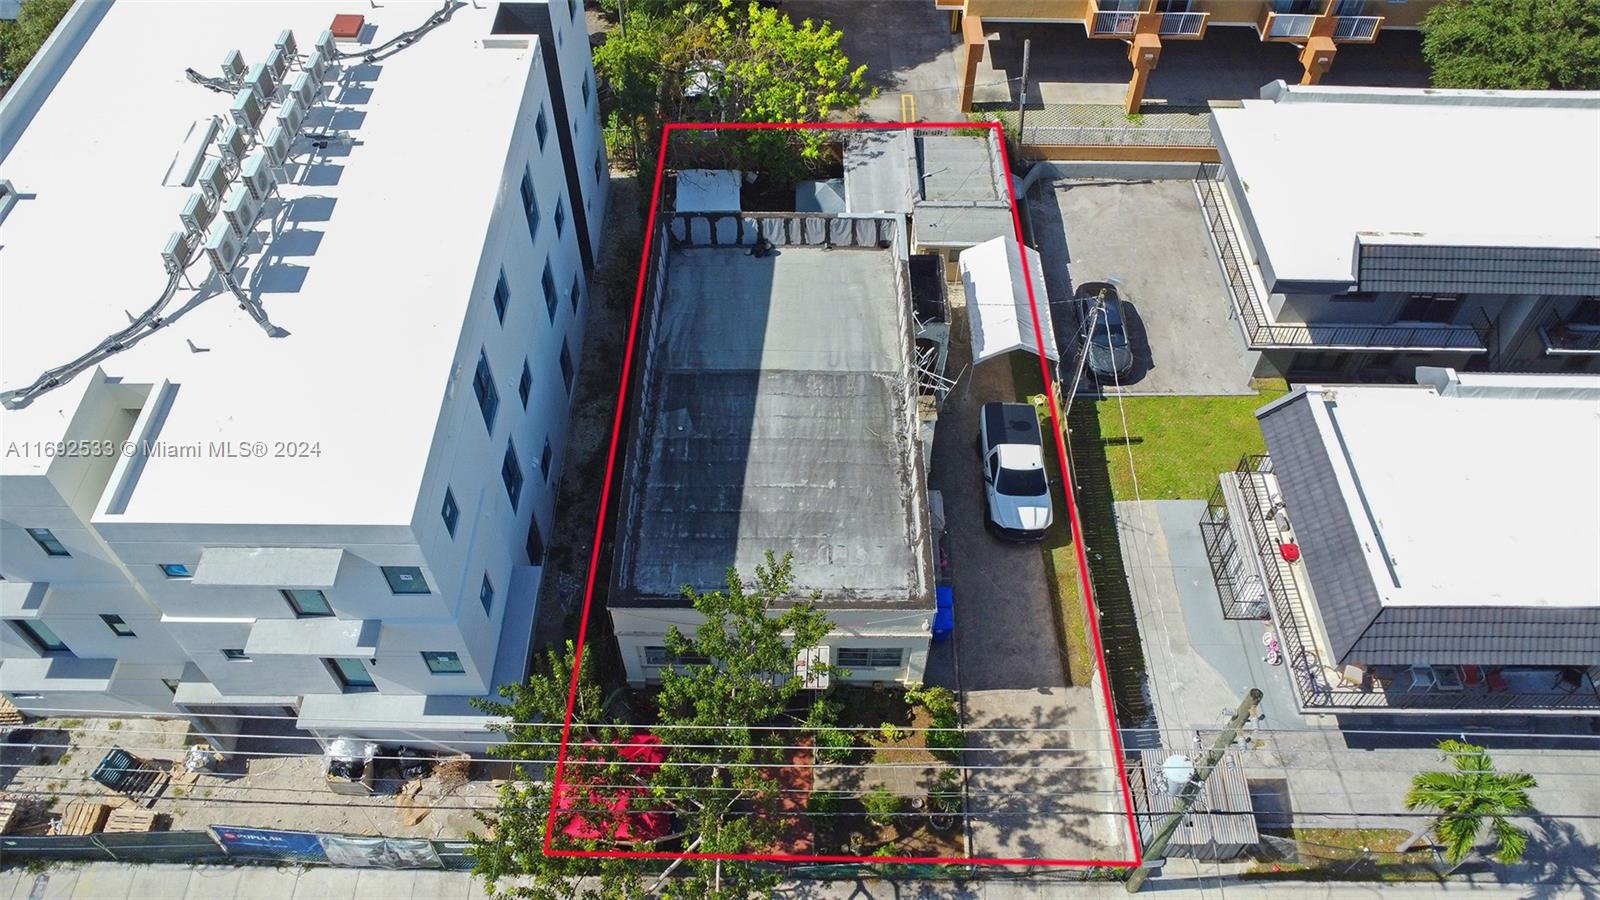
Active under contract
$824,999
2
bds
|
1
ba
|
984
sqft
|
built
1937
260 NW 34th St, Miami, FL 33127
$-1,260
Cash flow
-8.0%
Cash-on-Cash Return
4.3%
Cap rate
0.5%
Rent to Value Ratio
Active
$400,000
1
bds
|
1
ba
|
641
sqft
|
built
2018
481 NE 29th St, Miami, FL 33137
$-1,827
Cash flow
-23.8%
Cash-on-Cash Return
0.7%
Cap rate
0.7%
Rent to Value Ratio
Active
$430,000
3
bds
|
2
ba
|
1,181
sqft
|
built
1935
2944 NW 44th St, Miami, FL 33142
$-455
Cash flow
-5.5%
Cash-on-Cash Return
4.9%
Cap rate
0.7%
Rent to Value Ratio
Active
$800,000
3
bds
|
1
ba
|
1,456
sqft
|
built
1935
520 SW 11th Ave, Miami, FL 33130
$-2,052
Cash flow
-13.4%
Cash-on-Cash Return
3.1%
Cap rate
0.5%
Rent to Value Ratio

Active
$1,050,000
2
bds
|
3
ba
|
1,270
sqft
|
built
2016
88 SW 7th St, Miami, FL 33130
$-4,825
Cash flow
-24.0%
Cash-on-Cash Return
0.6%
Cap rate
0.5%
Rent to Value Ratio
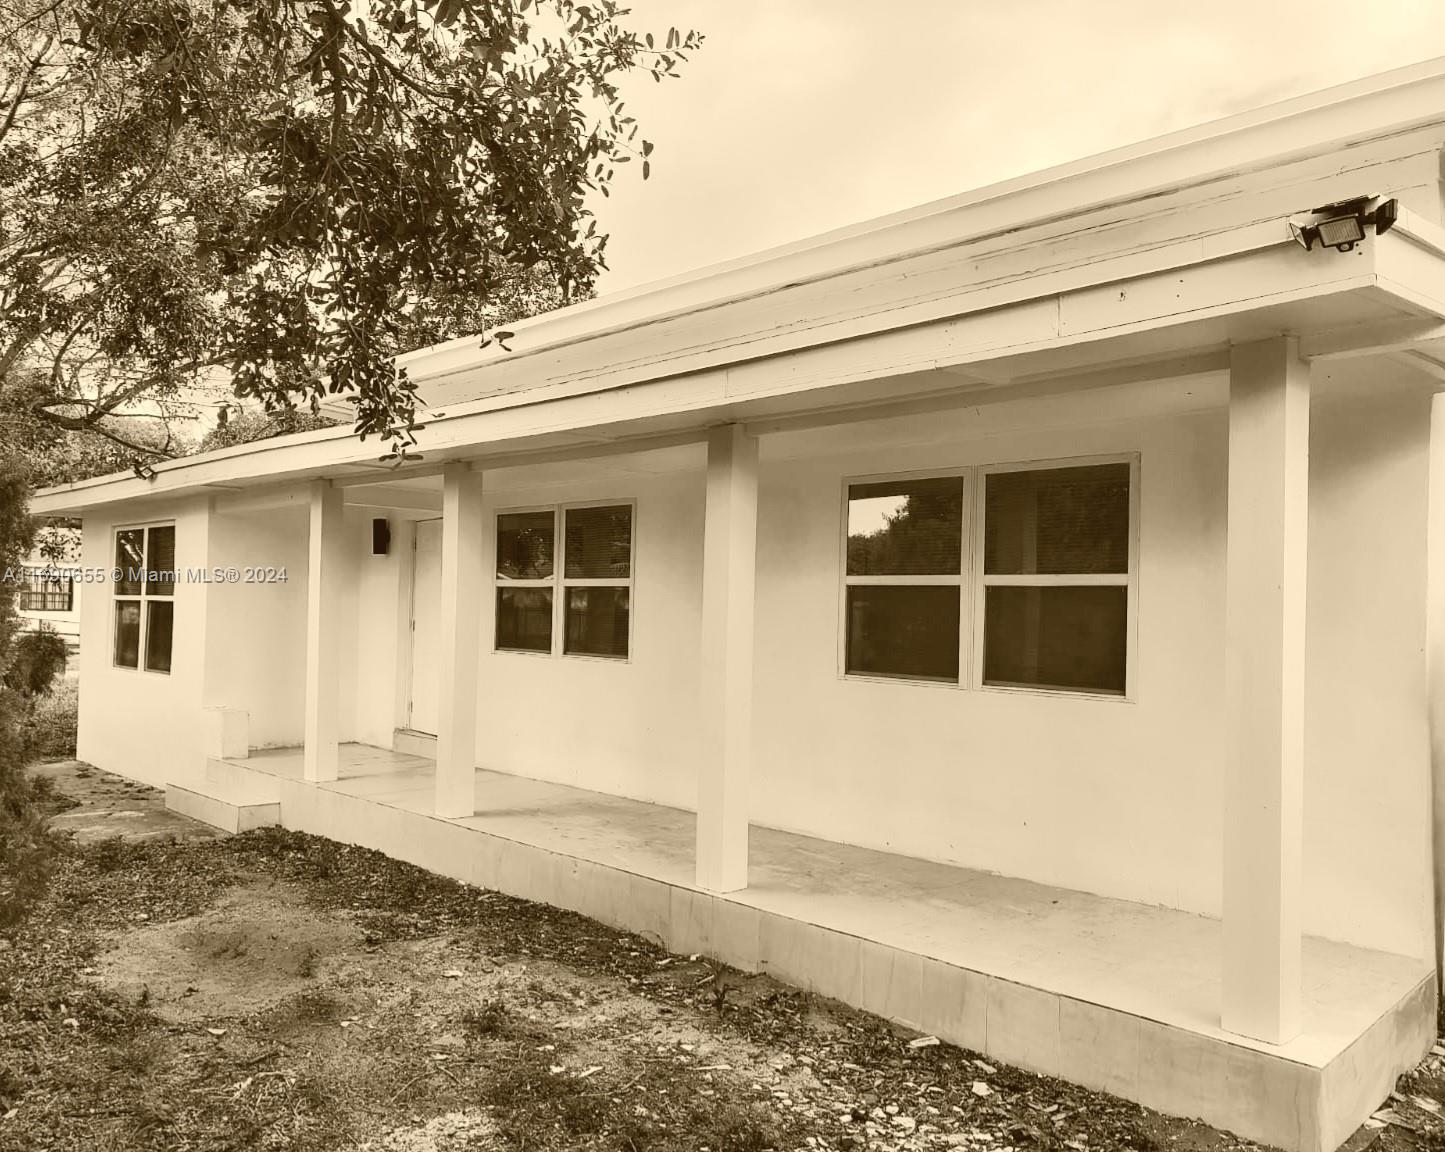
Active
$575,000
4
bds
|
2
ba
|
1,152
sqft
|
built
1954
400 NE 161st St, Miami, FL 33162
$-1,362
Cash flow
-12.4%
Cash-on-Cash Return
3.3%
Cap rate
0.5%
Rent to Value Ratio
Active
$1,075,000
3
bds
|
3
ba
|
1,364
sqft
|
built
2017
45 SW 9th St, Miami, FL 33130
$-4,161
Cash flow
-20.2%
Cash-on-Cash Return
1.5%
Cap rate
0.7%
Rent to Value Ratio
Active
$1,150,000
3
bds
|
3
ba
|
2,340
sqft
|
built
2008
3301 NE 1st Ave, Miami, FL 33137
$-4,362
Cash flow
-19.8%
Cash-on-Cash Return
1.6%
Cap rate
0.5%
Rent to Value Ratio
Active
$710,000
2
bds
|
2
ba
|
864
sqft
|
built
2018
121 NE 34th St, Miami, FL 33137
$-3,329
Cash flow
-24.5%
Cash-on-Cash Return
0.5%
Cap rate
0.6%
Rent to Value Ratio

Active
$3,495,000
4
bds
|
4
ba
|
3,725
sqft
|
built
1982
2000 S Bayshore Dr, Miami, FL 33133
$-14,480
Cash flow
-21.6%
Cash-on-Cash Return
1.2%
Cap rate
0.3%
Rent to Value Ratio
Active
$470,000
3
bds
|
2
ba
|
1,470
sqft
|
built
1960
8221 NW 14th Pl, Miami, FL 33147
$-669
Cash flow
-7.4%
Cash-on-Cash Return
4.4%
Cap rate
0.7%
Rent to Value Ratio

Active
$349,000
2
bds
|
2
ba
|
914
sqft
|
built
1989
800 N Miami Ave, Miami, FL 33136
$-1,232
Cash flow
-18.4%
Cash-on-Cash Return
1.9%
Cap rate
0.8%
Rent to Value Ratio
Active
$195,000
1
bds
|
1
ba
|
612
sqft
|
built
1968
9375 SW 40th Ter, Miami, FL 33165
$58
Cash flow
1.6%
Cash-on-Cash Return
6.5%
Cap rate
1.0%
Rent to Value Ratio

Active
$639,000
2
bds
|
2
ba
|
1,110
sqft
|
built
2010
92 SW 3rd St, Miami, FL 33130
$-2,170
Cash flow
-17.7%
Cash-on-Cash Return
2.1%
Cap rate
0.7%
Rent to Value Ratio
Active
$305,000
3
bds
|
3
ba
|
1,220
sqft
|
built
1975
10661 SW 108th Ave, Miami, FL 33176
$-621
Cash flow
-10.6%
Cash-on-Cash Return
3.7%
Cap rate
0.8%
Rent to Value Ratio
Active
$255,000
1
bds
|
2
ba
|
741
sqft
|
built
1972
3301 N Country Club Dr, Miami, FL 33180
$-754
Cash flow
-15.4%
Cash-on-Cash Return
2.6%
Cap rate
0.9%
Rent to Value Ratio
Active
$750,000
1
bds
|
1
ba
|
790
sqft
|
built
2009
485 Brickell Ave, Miami, FL 33131
$-3,079
Cash flow
-21.4%
Cash-on-Cash Return
1.2%
Cap rate
0.6%
Rent to Value Ratio
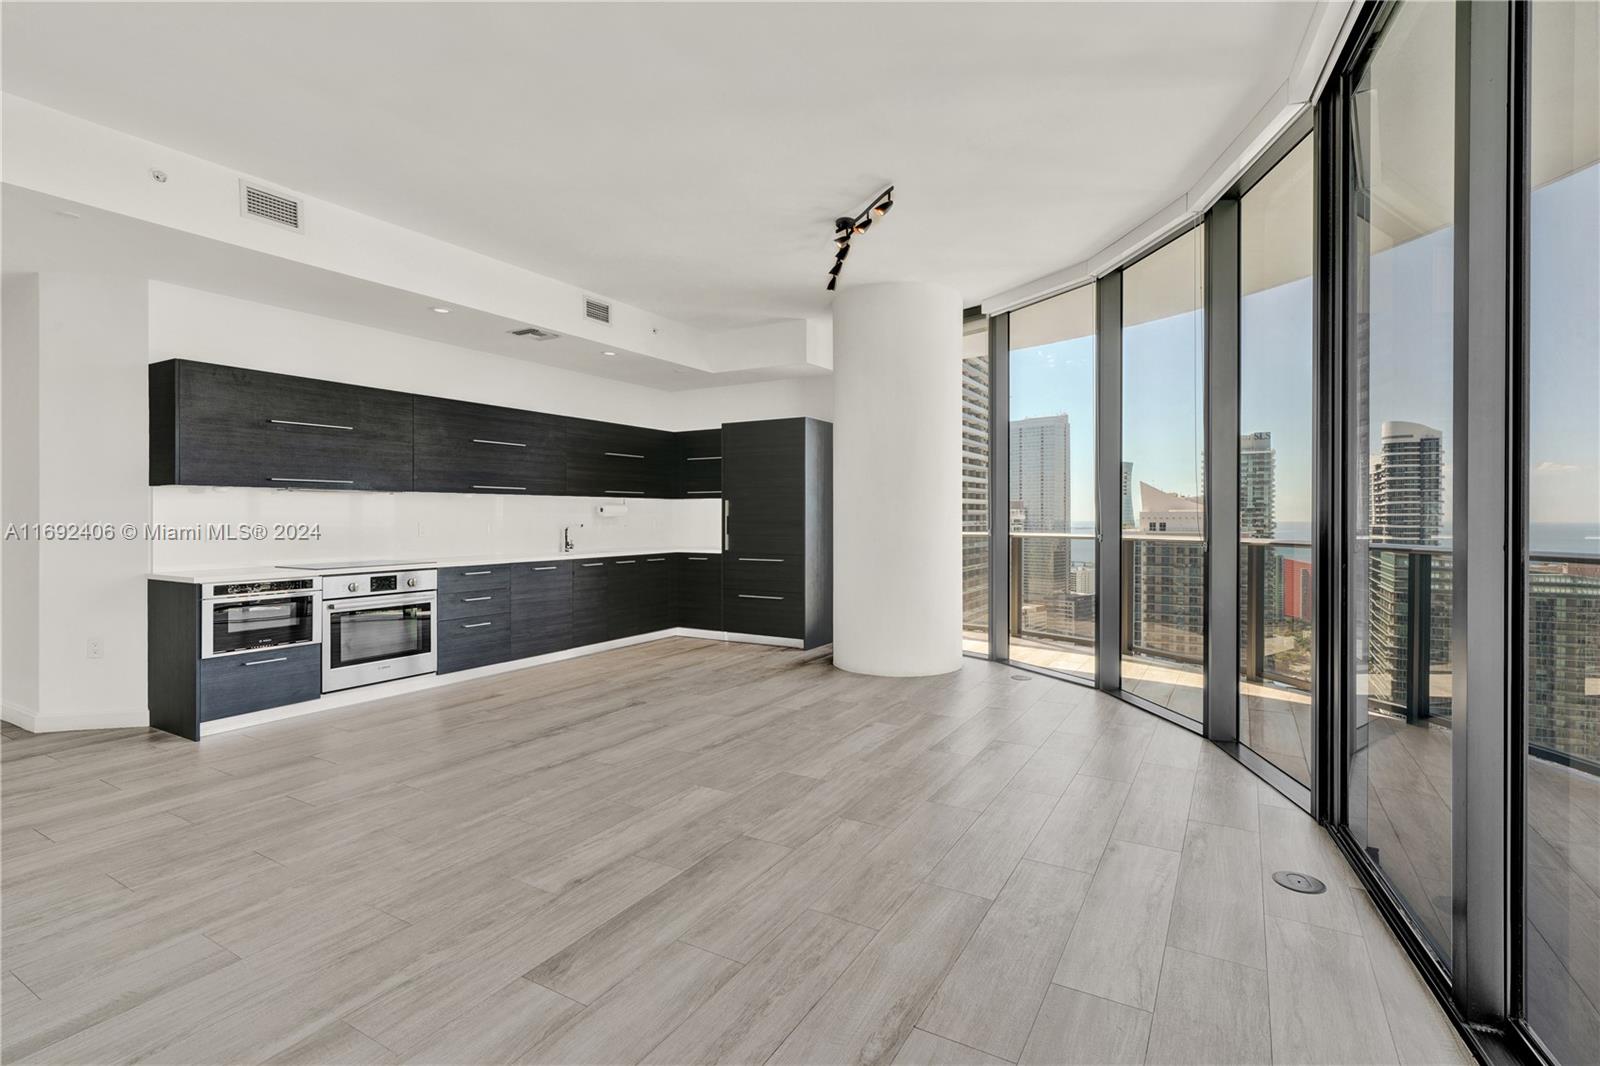
Active
$999,000
2
bds
|
2
ba
|
1,088
sqft
|
built
2016
1300 S Miami Ave, Miami, FL 33130
$-3,379
Cash flow
-17.6%
Cash-on-Cash Return
2.1%
Cap rate
0.6%
Rent to Value Ratio
Active
$675,000
2
bds
|
2
ba
|
1,362
sqft
|
built
1975
1901 Brickell Ave, Miami, FL 33129
$-2,794
Cash flow
-21.6%
Cash-on-Cash Return
1.2%
Cap rate
0.5%
Rent to Value Ratio
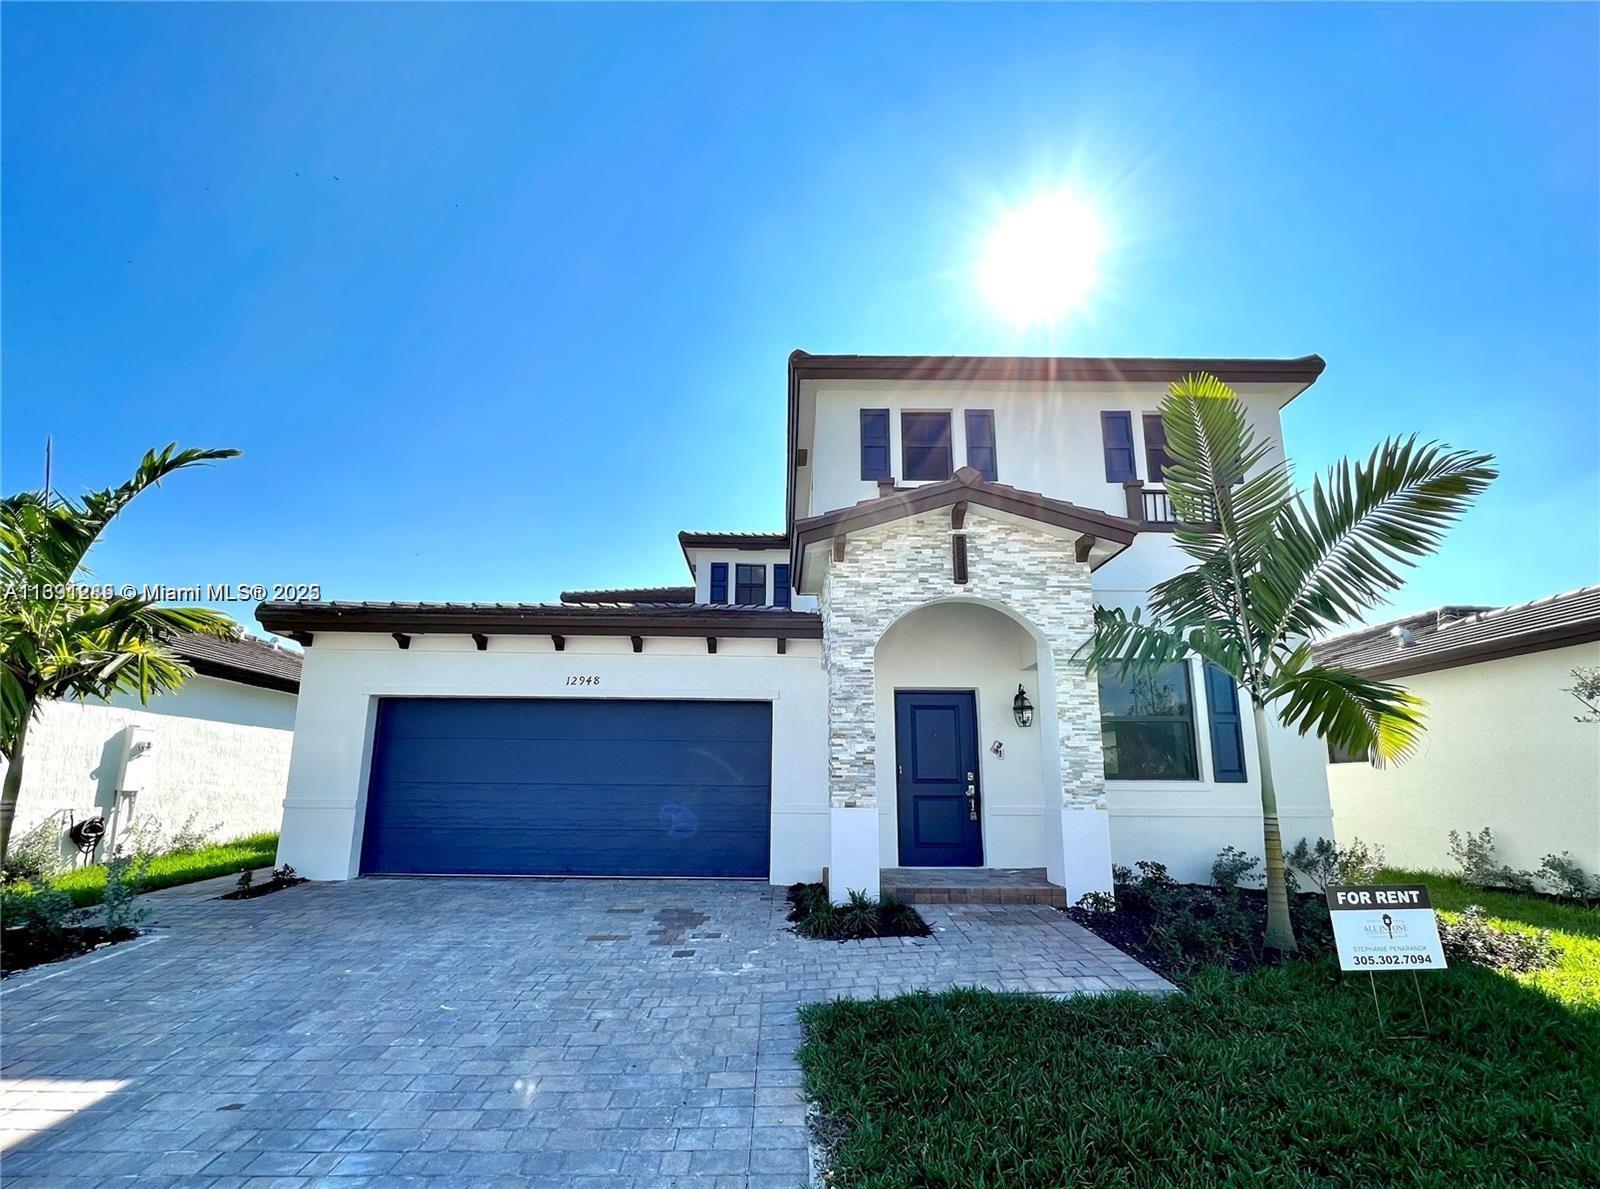
Active
$725,000
4
bds
|
4
ba
|
3,139
sqft
|
built
2022
12948 SW 229th St, Miami, FL 33170
$-1,837
Cash flow
-13.2%
Cash-on-Cash Return
3.1%
Cap rate
0.6%
Rent to Value Ratio