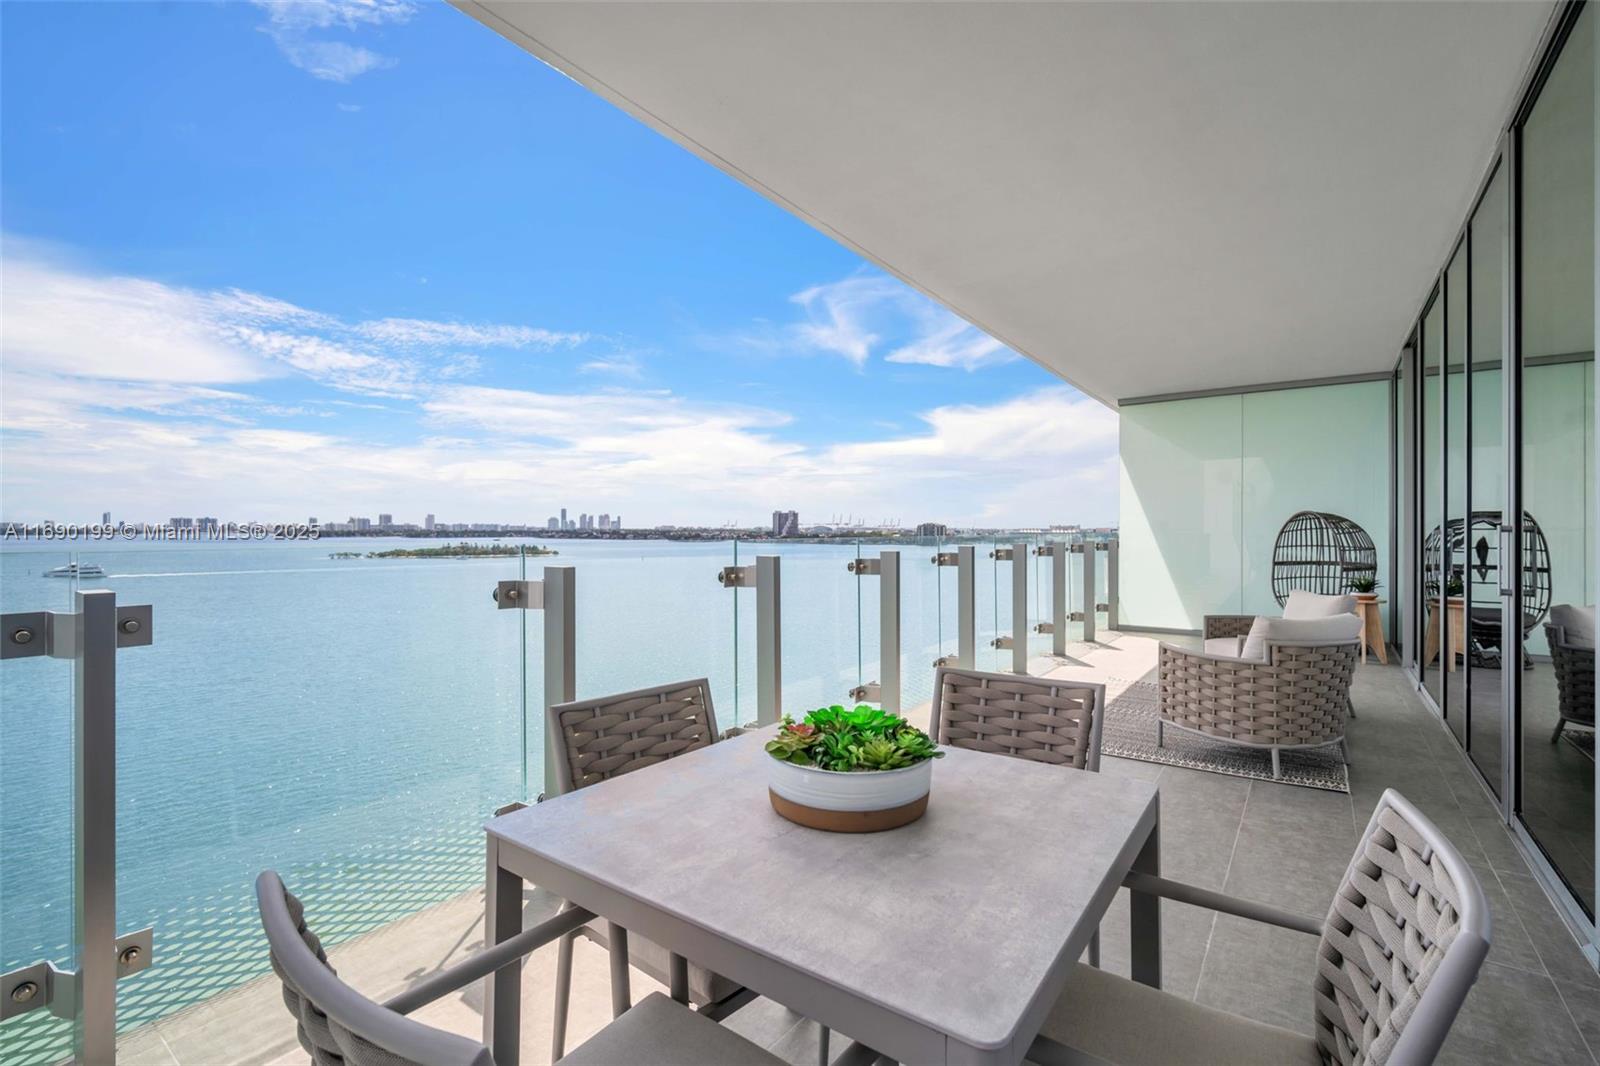
Miami, FL Investment Properties for Sale
Browse homes for sale and investment properties in Miami, FL. Refine your search by price, property type, or more.
Best cash flowing properties in Miami, FL
Active
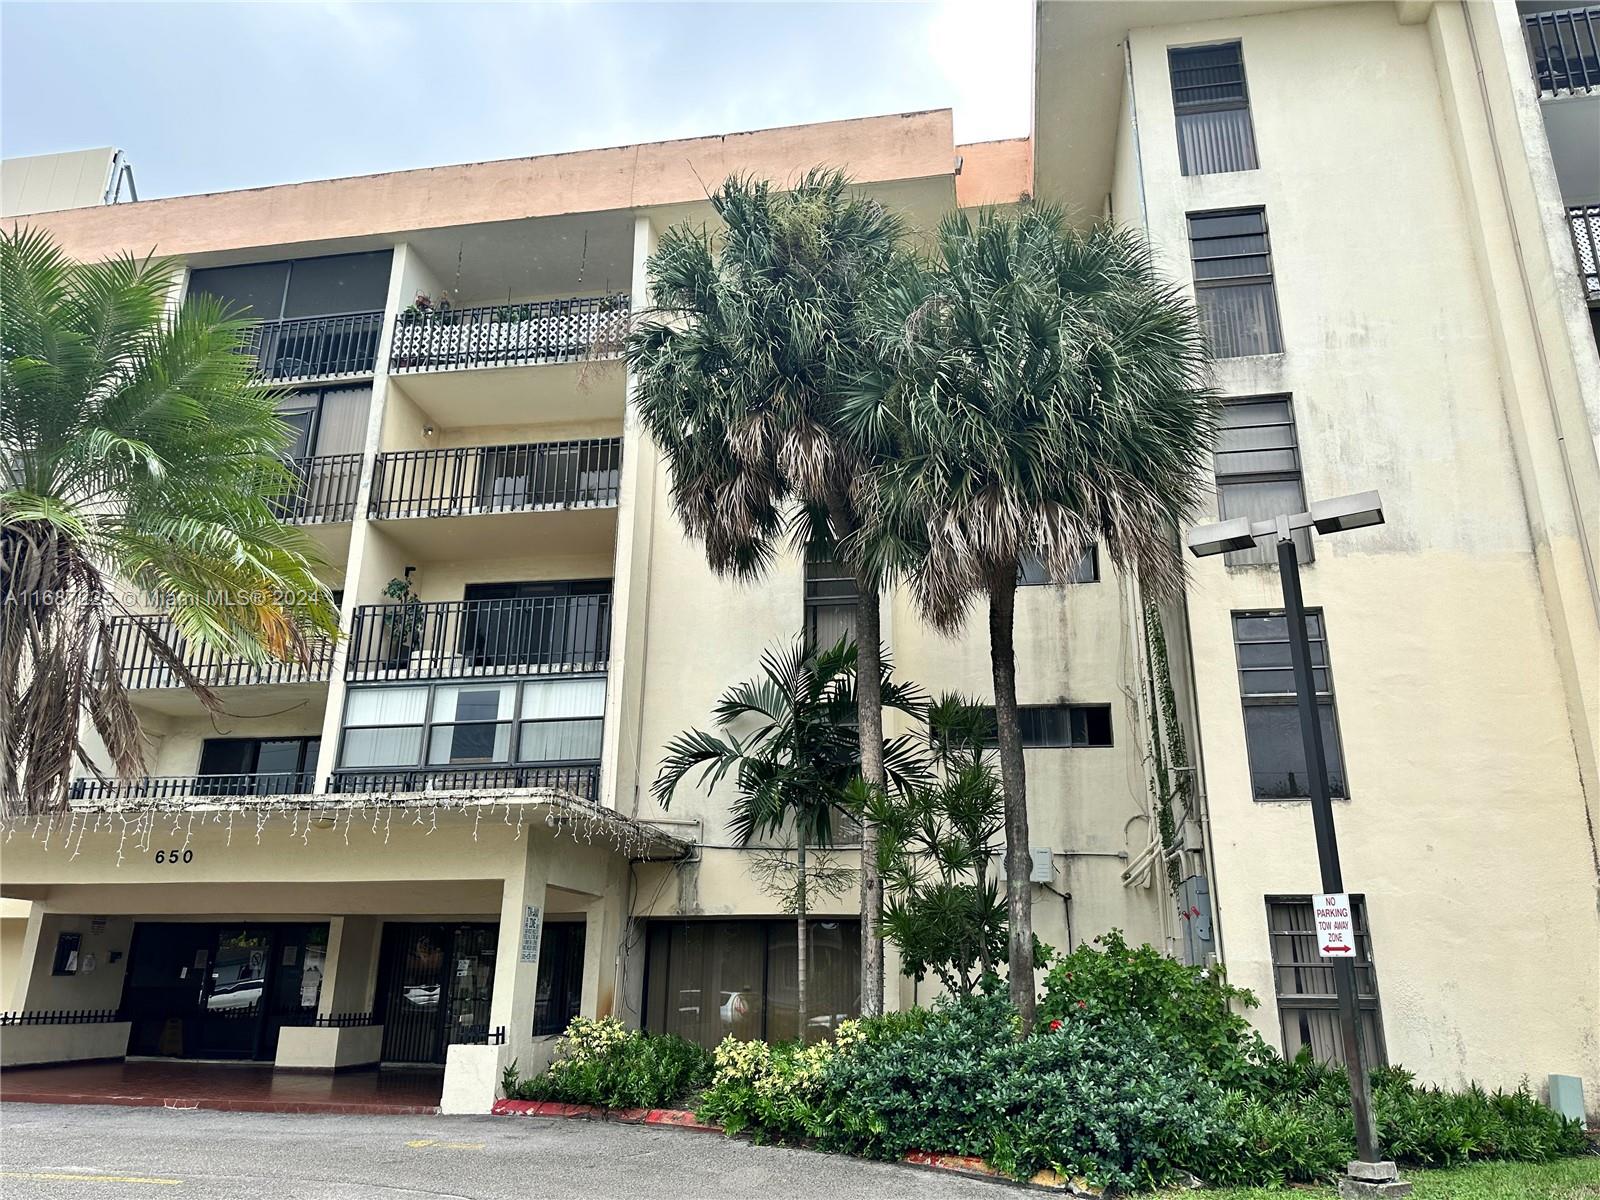
$180,000
2
bds
|
1
ba
|
860
sqft
|
built
1982
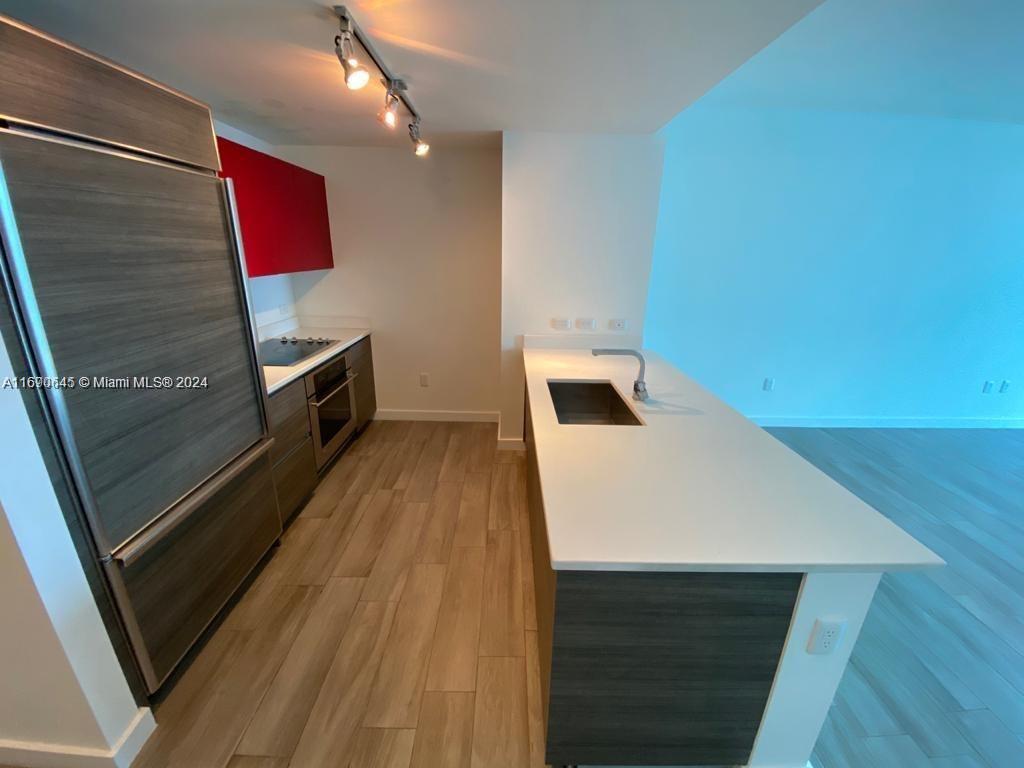
650 NE 149th St, Miami, FL 33161
$-470
Cash flow
-13.6%
Cash-on-Cash Return
3.0%
Cap rate
1.0%
Rent to Value Ratio
Active
$399,000
3
bds
|
1
ba
|
1,597
sqft
|
built
1926
98 NE 70th St, Miami, FL 33138
$-529
Cash flow
-6.9%
Cash-on-Cash Return
4.6%
Cap rate
0.8%
Rent to Value Ratio
6,122 out of 6,953 properties for sale in Miami, FL
Limited Results Shown
Create a free account, or log in to reveal all property listings and enjoy the complete experience.
Active
$1,999,000
5
bds
|
4
ba
|
3,527
sqft
|
built
1996
13460 SW 32nd St, Miami, FL 33175
$-4,578
Cash flow
-11.9%
Cash-on-Cash Return
3.4%
Cap rate
0.5%
Rent to Value Ratio
Active
$375,000
bds
|
1
ba
|
588
sqft
|
built
2018
1600 NE 1st Ave, Miami, FL 33132
$-1,262
Cash flow
-17.6%
Cash-on-Cash Return
2.1%
Cap rate
0.7%
Rent to Value Ratio
Active
$780,000
4
bds
|
3
ba
|
2,716
sqft
|
built
1996
16546 SW 103rd Ln, Miami, FL 33196
$-1,896
Cash flow
-12.7%
Cash-on-Cash Return
3.2%
Cap rate
0.6%
Rent to Value Ratio

Active
$849,000
2
bds
|
2
ba
|
1,142
sqft
|
built
2008
3301 NE 1st Ave, Miami, FL 33137
$-3,581
Cash flow
-22.0%
Cash-on-Cash Return
1.1%
Cap rate
0.5%
Rent to Value Ratio
Active
$375,000
1
bds
|
2
ba
|
836
sqft
|
built
1982
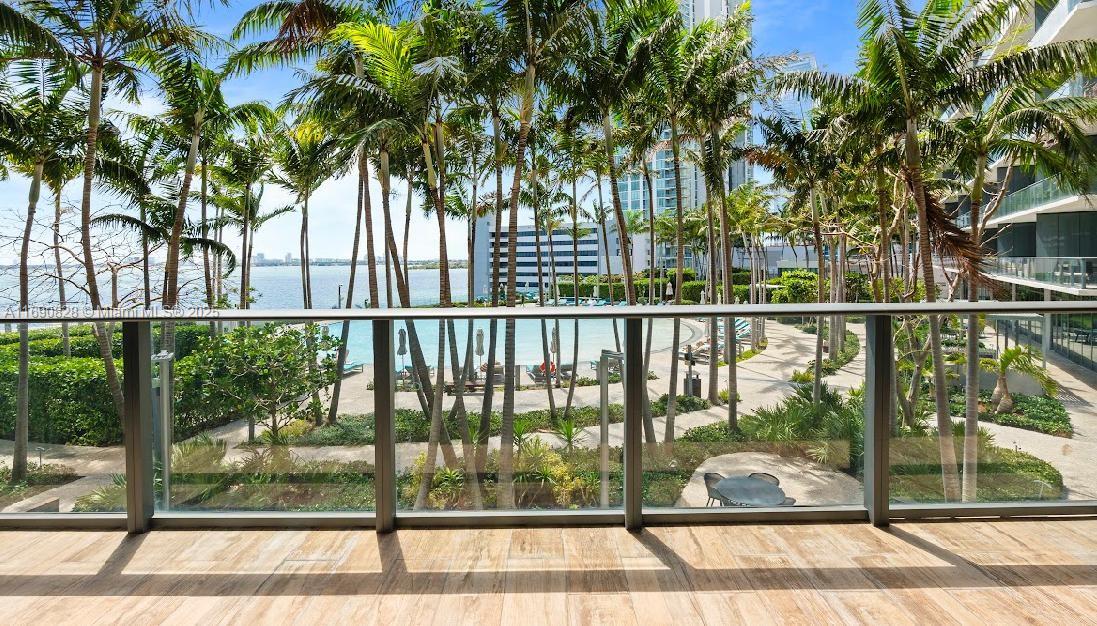
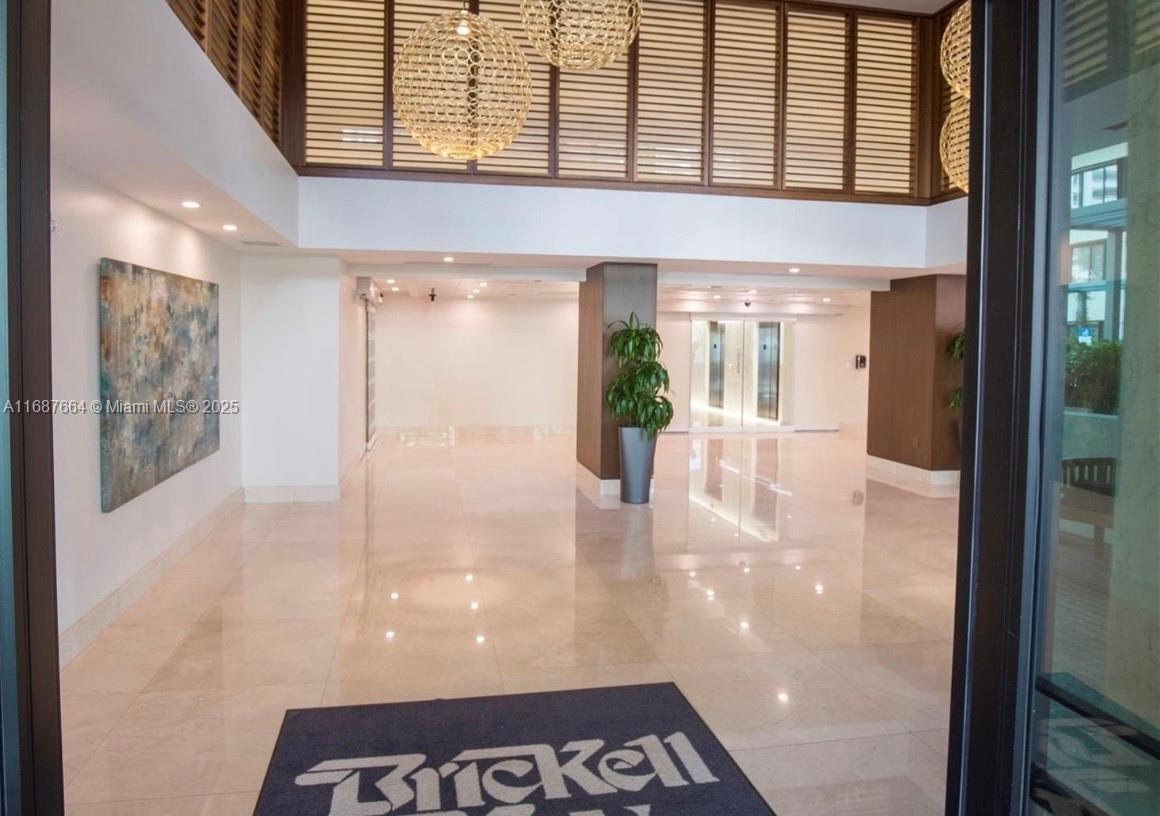
520 Brickell Key Dr, Miami, FL 33131
$-609
Cash flow
-8.5%
Cash-on-Cash Return
4.2%
Cap rate
0.7%
Rent to Value Ratio
Active
$619,990
1
bds
|
2
ba
|
799
sqft
|
built
2008
200 Biscayne Boulevard Way, Miami, FL 33131
$-1,867
Cash flow
-15.7%
Cash-on-Cash Return
2.5%
Cap rate
0.7%
Rent to Value Ratio
Active
$279,000
bds
|
1
ba
|
560
sqft
|
built
1972
1650 NE 115th St, Miami, FL 33181
$-754
Cash flow
-14.1%
Cash-on-Cash Return
2.9%
Cap rate
0.7%
Rent to Value Ratio

Active
$659,000
1
bds
|
2
ba
|
883
sqft
|
built
2018
88 SW 7th St, Miami, FL 33130
$-2,396
Cash flow
-19.0%
Cash-on-Cash Return
1.8%
Cap rate
0.7%
Rent to Value Ratio

Pending
$350,000
1
bds
|
2
ba
|
828
sqft
|
built
1982
780 NE 69th St, Miami, FL 33138
$-725
Cash flow
-10.8%
Cash-on-Cash Return
3.7%
Cap rate
1.0%
Rent to Value Ratio
Active
$590,000
1
bds
|
1
ba
|
877
sqft
|
built
2015
1100 S Miami Ave, Miami, FL 33130
$-1,978
Cash flow
-17.5%
Cash-on-Cash Return
2.1%
Cap rate
0.6%
Rent to Value Ratio
Active
$910,000
2
bds
|
3
ba
|
1,175
sqft
|
built
2018
650 NE 32nd St, Miami, FL 33137
$-3,518
Cash flow
-20.2%
Cash-on-Cash Return
1.5%
Cap rate
0.6%
Rent to Value Ratio
Active
$400,000
1
bds
|
1
ba
|
821
sqft
|
built
2007
1750 N Bayshore Dr, Miami, FL 33132
$-1,619
Cash flow
-21.1%
Cash-on-Cash Return
1.3%
Cap rate
0.7%
Rent to Value Ratio
Active
$385,000
2
bds
|
3
ba
|
1,200
sqft
|
built
1988
21300 San Simeon Way, Miami, FL 33179
$-839
Cash flow
-11.4%
Cash-on-Cash Return
3.5%
Cap rate
0.8%
Rent to Value Ratio
Active
$619,000
1
bds
|
2
ba
|
833
sqft
|
built
2008
888 Biscayne Blvd, Miami, FL 33132
$-2,077
Cash flow
-17.5%
Cash-on-Cash Return
2.1%
Cap rate
0.6%
Rent to Value Ratio

Active
$1,725,000
5
bds
|
3
ba
|
2,017
sqft
|
built
2022
520 NW 41st St, Miami, FL 33127
$-3,448
Cash flow
-10.4%
Cash-on-Cash Return
3.7%
Cap rate
0.6%
Rent to Value Ratio
Active
$640,000
2
bds
|
2
ba
|
1,229
sqft
|
built
1982
520 Brickell Key Dr, Miami, FL 33131
$-863
Cash flow
-7.0%
Cash-on-Cash Return
4.5%
Cap rate
0.7%
Rent to Value Ratio

Active
$675,000
2
bds
|
2
ba
|
1,048
sqft
|
built
2008
1750 N Bayshore Dr, Miami, FL 33132
$-3,456
Cash flow
-26.7%
Cash-on-Cash Return
0.0%
Cap rate
0.6%
Rent to Value Ratio
Active under contract
$1,180,000
2
bds
|
2
ba
|
1,153
sqft
|
built
2017
1451 Brickell Ave, Miami, FL 33131
$-5,610
Cash flow
-24.8%
Cash-on-Cash Return
0.4%
Cap rate
0.5%
Rent to Value Ratio
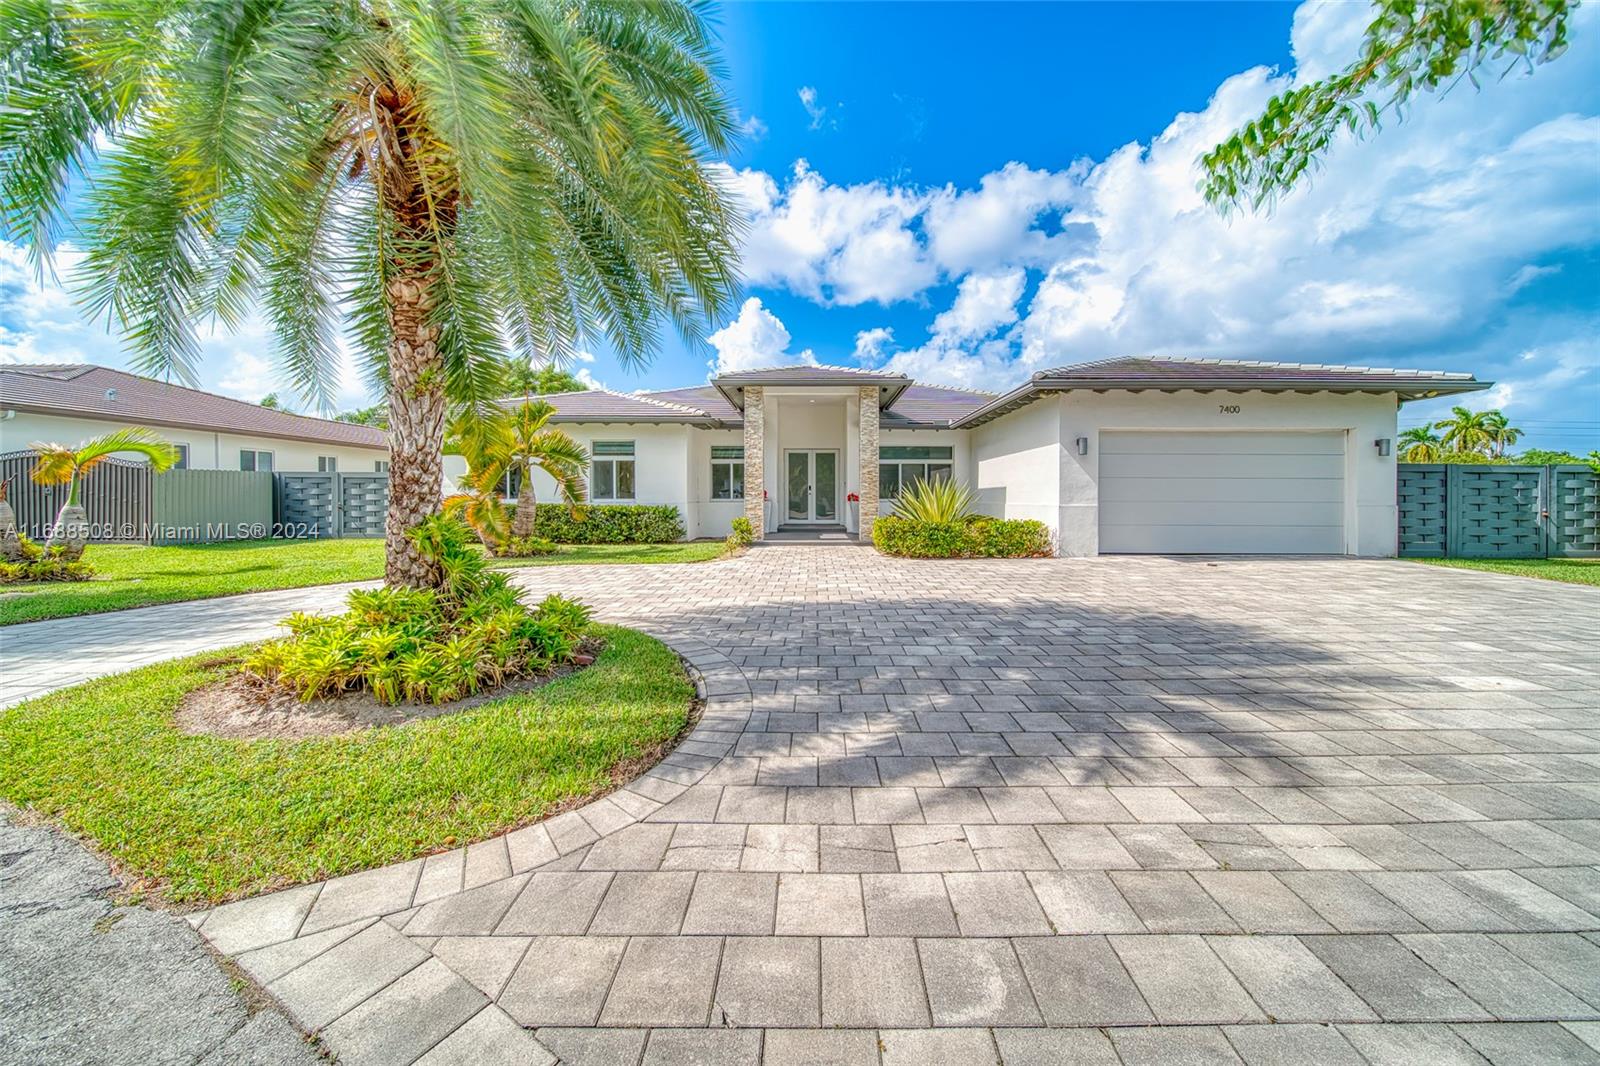
Active
$1,700,000
5
bds
|
4
ba
|
3,179
sqft
|
built
2017
7400 SW 124th Ct, Miami, FL 33183
$-2,802
Cash flow
-8.6%
Cash-on-Cash Return
4.2%
Cap rate
0.6%
Rent to Value Ratio
Active
$2,990,000
3
bds
|
5
ba
|
2,586
sqft
|
built
2023
700 NE 26th Ter, Miami, FL 33137
$-14,667
Cash flow
-25.6%
Cash-on-Cash Return
0.3%
Cap rate
0.3%
Rent to Value Ratio
Active
$335,000
1
bds
|
1
ba
|
756
sqft
|
built
2002
2665 SW 37th Ave, Miami, FL 33133
$-1,045
Cash flow
-16.3%
Cash-on-Cash Return
2.4%
Cap rate
0.7%
Rent to Value Ratio
Active
$640,000
4
bds
|
2
ba
|
1,717
sqft
|
built
1949
286 NW 57th St, Miami, FL 33127
$-1,106
Cash flow
-9.0%
Cash-on-Cash Return
4.1%
Cap rate
0.6%
Rent to Value Ratio

Active
$1,850,000
3
bds
|
3
ba
|
1,936
sqft
|
built
1948
7300 NE 7th Ave, Miami, FL 33138
$-5,604
Cash flow
-15.8%
Cash-on-Cash Return
2.5%
Cap rate
0.4%
Rent to Value Ratio
Active
$6,999,000
4
bds
|
6
ba
|
4,600
sqft
|
built
2019
1000 Biscayne Blvd, Miami, FL 33132
$-48,160
Cash flow
-35.9%
Cash-on-Cash Return
-2.1%
Cap rate
0.1%
Rent to Value Ratio
Active
$630,000
2
bds
|
3
ba
|
1,290
sqft
|
built
2007
185 SW 7th St, Miami, FL 33130
$-2,057
Cash flow
-17.0%
Cash-on-Cash Return
2.2%
Cap rate
0.7%
Rent to Value Ratio
Active
$870,000
4
bds
|
3
ba
|
2,528
sqft
|
built
2002
6641 SW 166th Ct, Miami, FL 33193
$-970
Cash flow
-5.8%
Cash-on-Cash Return
4.8%
Cap rate
0.7%
Rent to Value Ratio
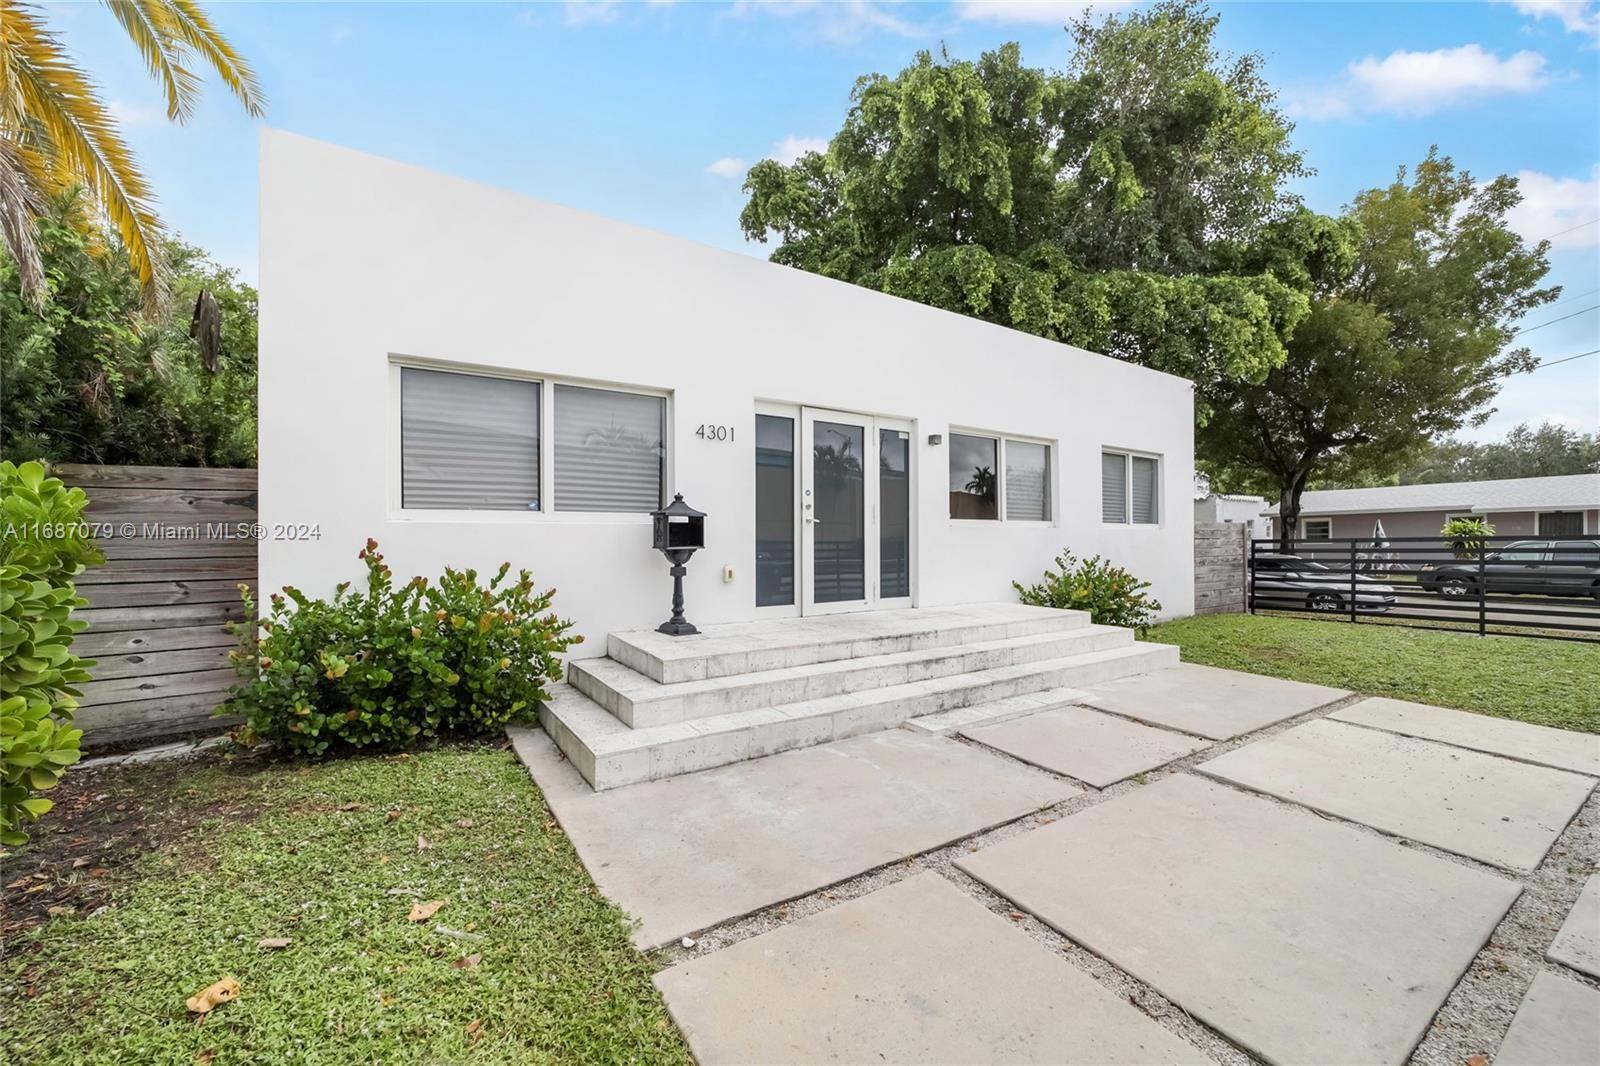
Active
$1,200,000
3
bds
|
3
ba
|
2,094
sqft
|
built
1925
4301 NW 6th Ave, Miami, FL 33127
$-3,036
Cash flow
-13.2%
Cash-on-Cash Return
3.1%
Cap rate
0.5%
Rent to Value Ratio

Active
$914,999
2
bds
|
2
ba
|
1,181
sqft
|
built
2008
3301 NE 1st Ave, Miami, FL 33137
$-3,190
Cash flow
-18.2%
Cash-on-Cash Return
2.0%
Cap rate
0.6%
Rent to Value Ratio
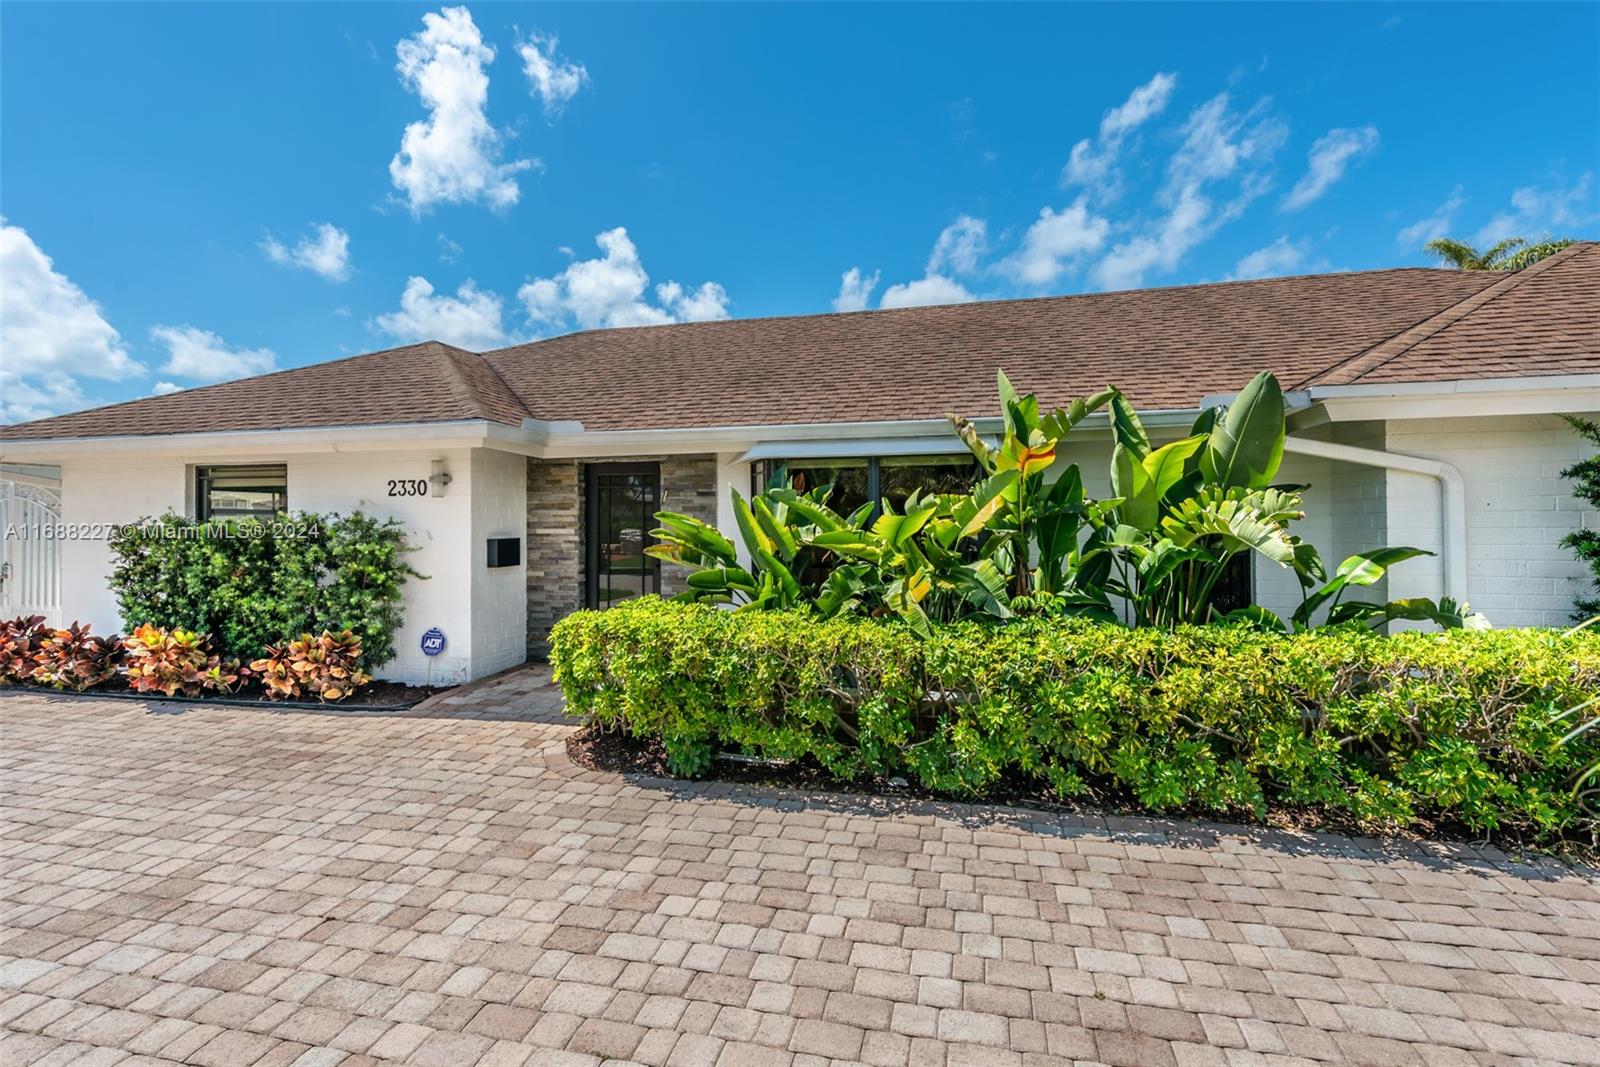
Active
$1,800,000
5
bds
|
4
ba
|
2,335
sqft
|
built
1962
2330 NE 195th St, Miami, FL 33180
$-3,573
Cash flow
-10.4%
Cash-on-Cash Return
3.8%
Cap rate
0.5%
Rent to Value Ratio
Active
$899,000
3
bds
|
2
ba
|
1,503
sqft
|
built
1951
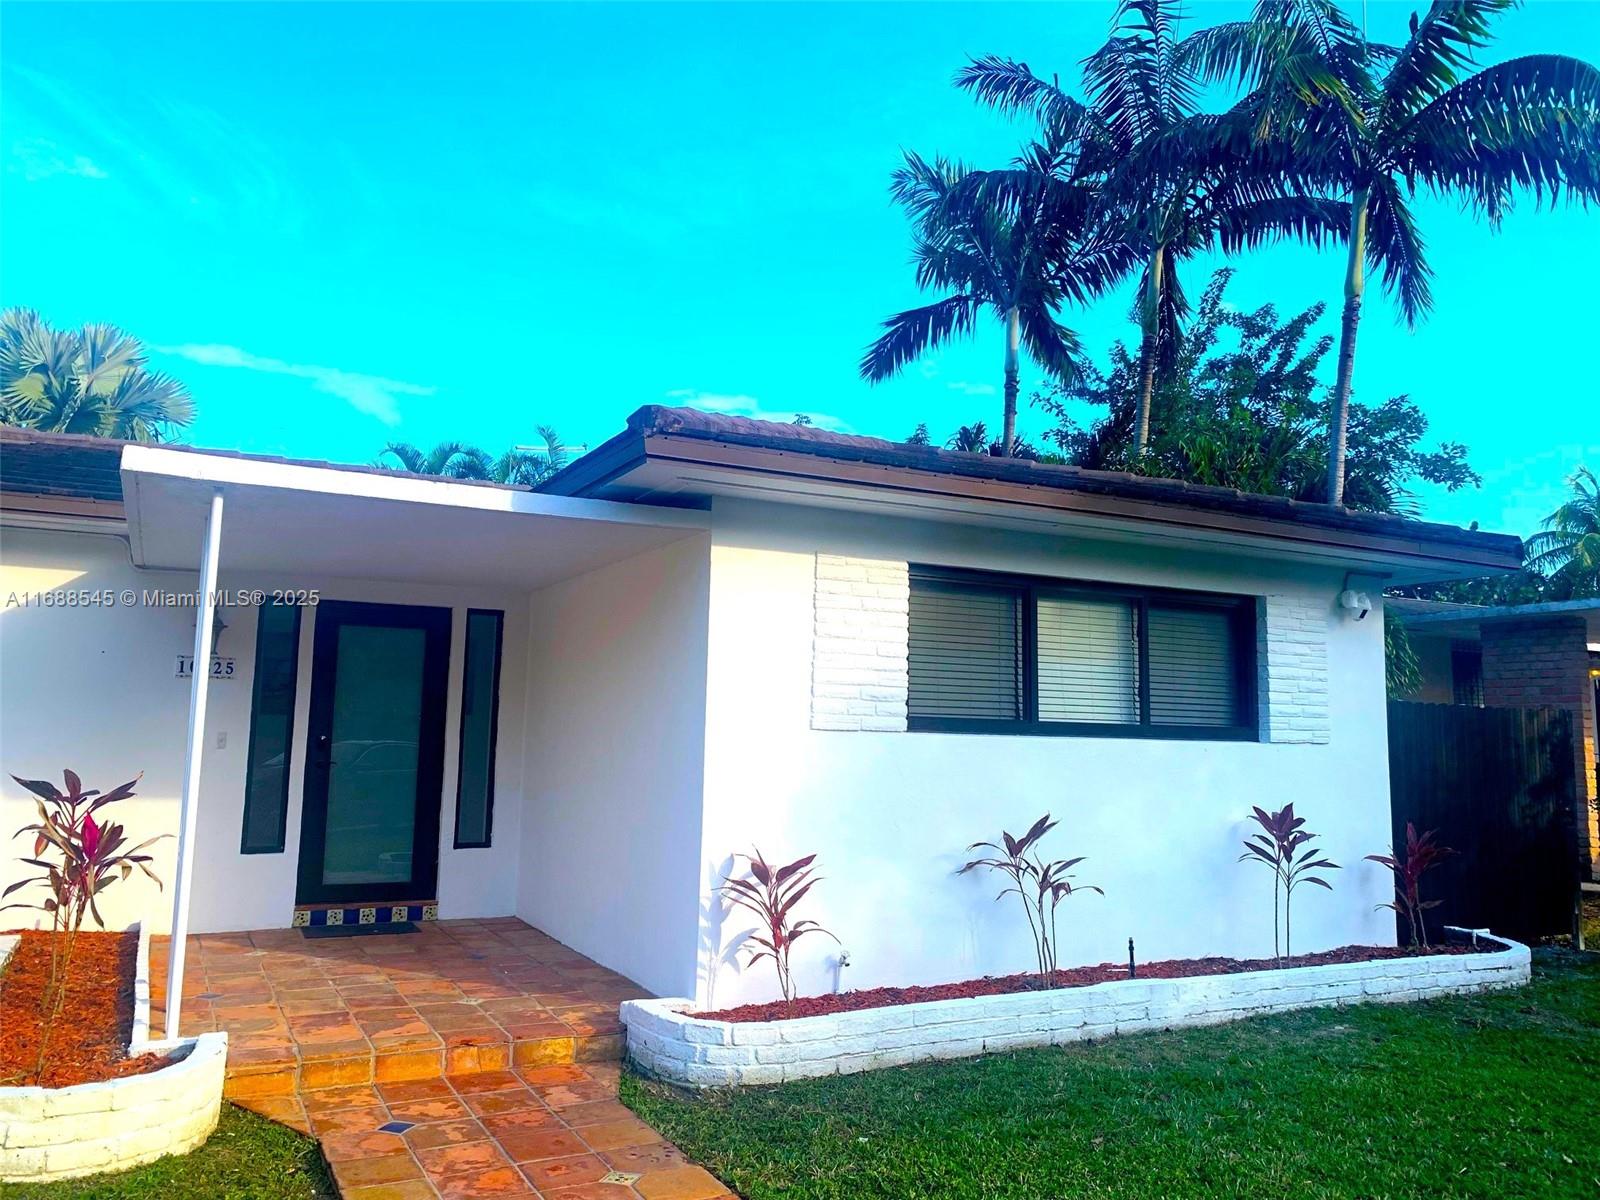
10825 Peachtree Dr, Miami, FL 33161
$-3,663
Cash flow
-21.3%
Cash-on-Cash Return
1.3%
Cap rate
0.3%
Rent to Value Ratio
Active
$399,000
3
bds
|
1
ba
|
1,597
sqft
|
built
1926
98 NE 70th St, Miami, FL 33138
$-529
Cash flow
-6.9%
Cash-on-Cash Return
4.6%
Cap rate
0.8%
Rent to Value Ratio
Active
$2,115,000
3
bds
|
2
ba
|
1,796
sqft
|
built
1946
3794 Irvington Ave, Miami, FL 33133
$-6,085
Cash flow
-15.0%
Cash-on-Cash Return
2.7%
Cap rate
0.4%
Rent to Value Ratio
Active
$950,000
2
bds
|
3
ba
|
1,205
sqft
|
built
2018
488 NE 18th St, Miami, FL 33132
$-3,179
Cash flow
-17.5%
Cash-on-Cash Return
2.1%
Cap rate
0.6%
Rent to Value Ratio
Active
$297,000
2
bds
|
2
ba
|
1,538
sqft
|
built
1981
2000 Towerside Ter, Miami, FL 33138
$-935
Cash flow
-16.4%
Cash-on-Cash Return
2.4%
Cap rate
1.2%
Rent to Value Ratio
Active
$180,000
2
bds
|
1
ba
|
860
sqft
|
built
1982
650 NE 149th St, Miami, FL 33161
$-470
Cash flow
-13.6%
Cash-on-Cash Return
3.0%
Cap rate
1.0%
Rent to Value Ratio

Active
$699,000
3
bds
|
2
ba
|
1,424
sqft
|
built
1964
226 SW 104th Ct, Miami, FL 33174
$-825
Cash flow
-6.2%
Cash-on-Cash Return
4.7%
Cap rate
0.7%
Rent to Value Ratio
Active
$725,000
2
bds
|
2
ba
|
1,020
sqft
|
built
1991
540 Brickell Key Dr, Miami, FL 33131
$-1,265
Cash flow
-9.1%
Cash-on-Cash Return
4.1%
Cap rate
0.6%
Rent to Value Ratio

Active
$2,500,000
4
bds
|
3
ba
|
2,200
sqft
|
built
1981
4090 SW 135th Ave, Miami, FL 33175
$-9,857
Cash flow
-20.6%
Cash-on-Cash Return
1.4%
Cap rate
0.2%
Rent to Value Ratio
Active
$975,900
3
bds
|
2
ba
|
1,602
sqft
|
built
1955
815 NE 178th St, Miami, FL 33162
$-3,118
Cash flow
-16.7%
Cash-on-Cash Return
2.3%
Cap rate
0.4%
Rent to Value Ratio

Active
$1,620,000
4
bds
|
3
ba
|
2,356
sqft
|
built
1955
861 NE 82nd St, Miami, FL 33138
$-3,475
Cash flow
-11.2%
Cash-on-Cash Return
3.6%
Cap rate
0.6%
Rent to Value Ratio