Miami, FL Investment Properties for Sale
Browse homes for sale and investment properties in Miami, FL. Refine your search by price, property type, or more.
Best cash flowing properties in Miami, FL
Active
$270,000
2
bds
|
2
ba
|
1,470
sqft
|
built
1969
800 NE 195th St, Miami, FL 33179
$301
Cash flow
5.8%
Cash-on-Cash Return
7.5%
Cap rate
0.9%
Rent to Value Ratio

Active
$550,000
4
bds
|
1
ba
|
1,267
sqft
|
built
1940
1419 NW 44th St, Miami, FL 33142
$-349
Cash flow
-3.3%
Cash-on-Cash Return
5.4%
Cap rate
0.7%
Rent to Value Ratio
6,092 out of 6,920 properties for sale in Miami, FL
Limited Results Shown
Create a free account, or log in to reveal all property listings and enjoy the complete experience.
Active
$549,999
3
bds
|
2
ba
|
1,200
sqft
|
built
2009
1727 NW 94th St, Miami, FL 33147
$-693
Cash flow
-6.6%
Cash-on-Cash Return
4.6%
Cap rate
0.6%
Rent to Value Ratio
Active
$2,350,000
3
bds
|
2
ba
|
1,812
sqft
|
built
1957
1610 S Bayshore Dr, Miami, FL 33133
$-7,630
Cash flow
-16.9%
Cash-on-Cash Return
2.3%
Cap rate
0.4%
Rent to Value Ratio

Active
$285,000
2
bds
|
2
ba
|
906
sqft
|
built
1974
14611 SW 88th St, Miami, FL 33186
$-490
Cash flow
-9.0%
Cash-on-Cash Return
4.1%
Cap rate
0.8%
Rent to Value Ratio
Active
$550,000
4
bds
|
1
ba
|
1,267
sqft
|
built
1940
1419 NW 44th St, Miami, FL 33142
$-349
Cash flow
-3.3%
Cash-on-Cash Return
5.4%
Cap rate
0.7%
Rent to Value Ratio
Active
$289,000
1
bds
|
2
ba
|
948
sqft
|
built
1972
210 NW 87th Ave, Miami, FL 33172
$-635
Cash flow
-11.5%
Cash-on-Cash Return
3.5%
Cap rate
0.7%
Rent to Value Ratio
Active
$449,000
1
bds
|
2
ba
|
982
sqft
|
built
2008
1060 Brickell Ave, Miami, FL 33131
$-1,912
Cash flow
-22.2%
Cash-on-Cash Return
1.0%
Cap rate
0.7%
Rent to Value Ratio
Active
$1,195,000
3
bds
|
2
ba
|
1,792
sqft
|
built
2005
335 S Biscayne Blvd, Miami, FL 33131
$-5,707
Cash flow
-24.9%
Cash-on-Cash Return
0.4%
Cap rate
0.5%
Rent to Value Ratio
Active
$259,000
1
bds
|
1
ba
|
840
sqft
|
built
1974
13120 SW 92nd Ave, Miami, FL 33176
$-479
Cash flow
-9.6%
Cash-on-Cash Return
3.9%
Cap rate
0.8%
Rent to Value Ratio
Active
$1,350,000
2
bds
|
2
ba
|
1,313
sqft
|
built
2008
465 Brickell Ave, Miami, FL 33131
$-5,474
Cash flow
-21.2%
Cash-on-Cash Return
1.3%
Cap rate
0.4%
Rent to Value Ratio
Active
$990,000
2
bds
|
3
ba
|
1,590
sqft
|
built
2008
244 Biscayne Blvd, Miami, FL 33132
$-3,121
Cash flow
-16.4%
Cash-on-Cash Return
2.4%
Cap rate
0.7%
Rent to Value Ratio
Active
$1,635,000
2
bds
|
3
ba
|
1,673
sqft
|
built
2010
2020 N Bayshore Dr, Miami, FL 33137
$-3,933
Cash flow
-12.6%
Cash-on-Cash Return
3.3%
Cap rate
0.5%
Rent to Value Ratio

Active
$370,000
1
bds
|
1
ba
|
689
sqft
|
built
2007
2301 SW 27th Ave, Miami, FL 33145
$-1,422
Cash flow
-20.1%
Cash-on-Cash Return
1.5%
Cap rate
0.6%
Rent to Value Ratio

Active
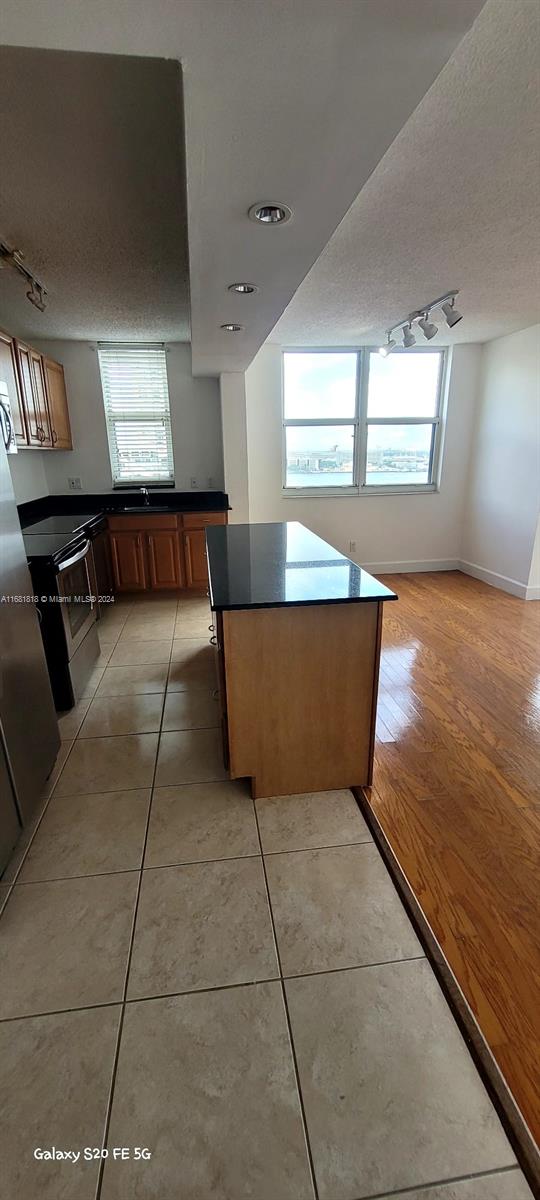
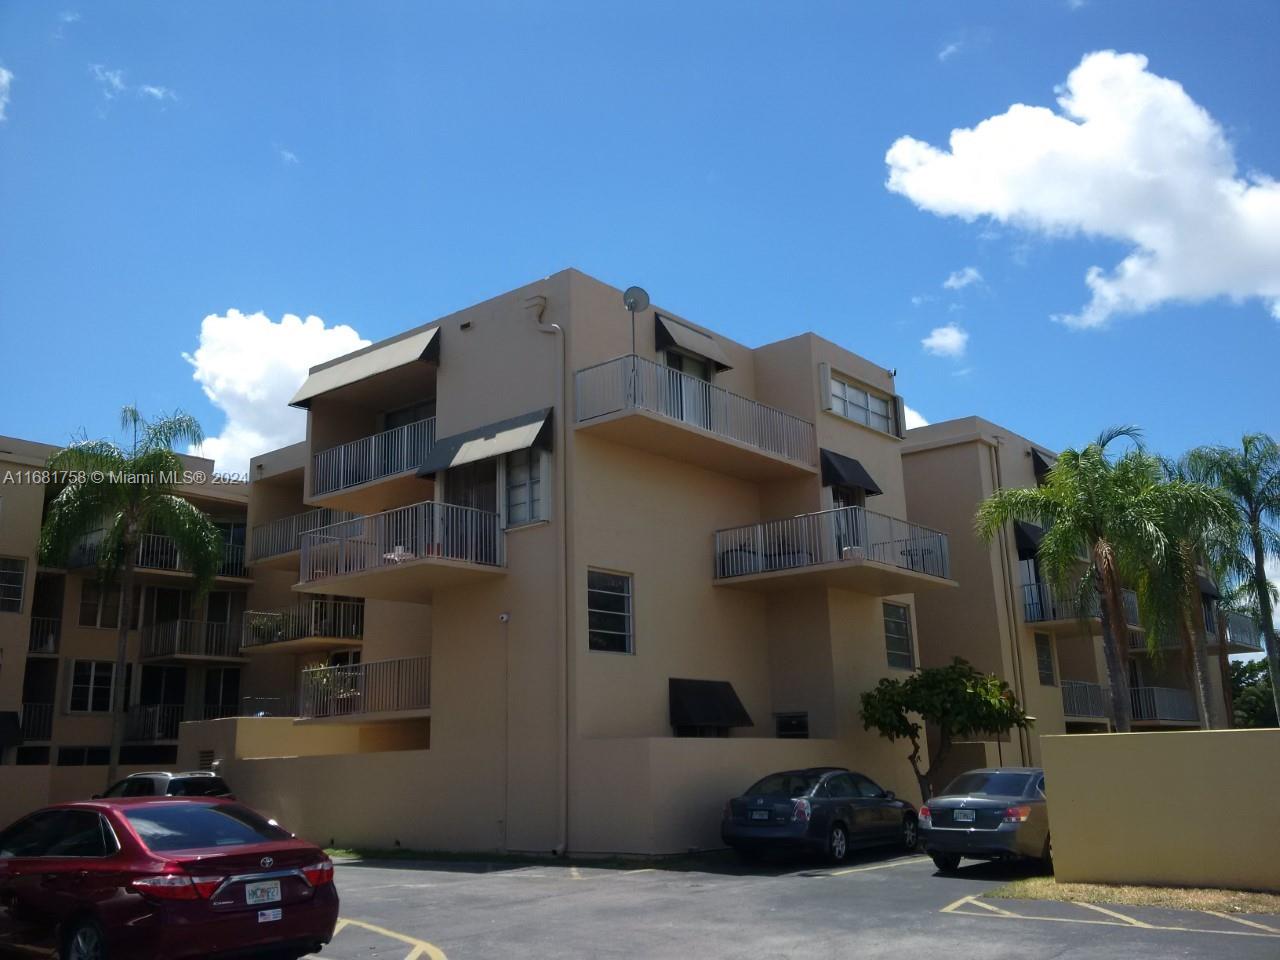
$489,000
2
bds
|
2
ba
|
1,038
sqft
|
built
1981
20505 E Country Club Dr, Miami, FL 33180
$-1,510
Cash flow
-16.1%
Cash-on-Cash Return
2.4%
Cap rate
0.7%
Rent to Value Ratio

Active
$1,299,000
3
bds
|
2
ba
|
1,498
sqft
|
built
1957
2560 NE 215th St, Miami, FL 33180
$-3,067
Cash flow
-12.3%
Cash-on-Cash Return
3.3%
Cap rate
0.4%
Rent to Value Ratio
Active
$820,000
2
bds
|
2
ba
|
1,012
sqft
|
built
2008
475 Brickell Ave, Miami, FL 33131
$-2,792
Cash flow
-17.8%
Cash-on-Cash Return
2.1%
Cap rate
0.7%
Rent to Value Ratio
Active
$3,500,000
4
bds
|
4
ba
|
4,014
sqft
|
built
1981
13851 SW 38th St, Miami, FL 33175
$-11,761
Cash flow
-17.5%
Cash-on-Cash Return
2.1%
Cap rate
0.3%
Rent to Value Ratio
Active
$880,000
6
bds
|
0
ba
|
2,331
sqft
|
built
1960
11515 NE 12th Ave, Miami, FL 33161
$-3,320
Cash flow
-19.7%
Cash-on-Cash Return
1.6%
Cap rate
0.3%
Rent to Value Ratio

Active
$435,000
2
bds
|
2
ba
|
997
sqft
|
built
2003
10 SW South River Dr, Miami, FL 33130
$-1,598
Cash flow
-19.2%
Cash-on-Cash Return
1.7%
Cap rate
0.7%
Rent to Value Ratio
Active
$459,000
3
bds
|
2
ba
|
960
sqft
|
built
1972
10350 SW 175th St, Miami, FL 33157
$-756
Cash flow
-8.6%
Cash-on-Cash Return
4.2%
Cap rate
0.6%
Rent to Value Ratio
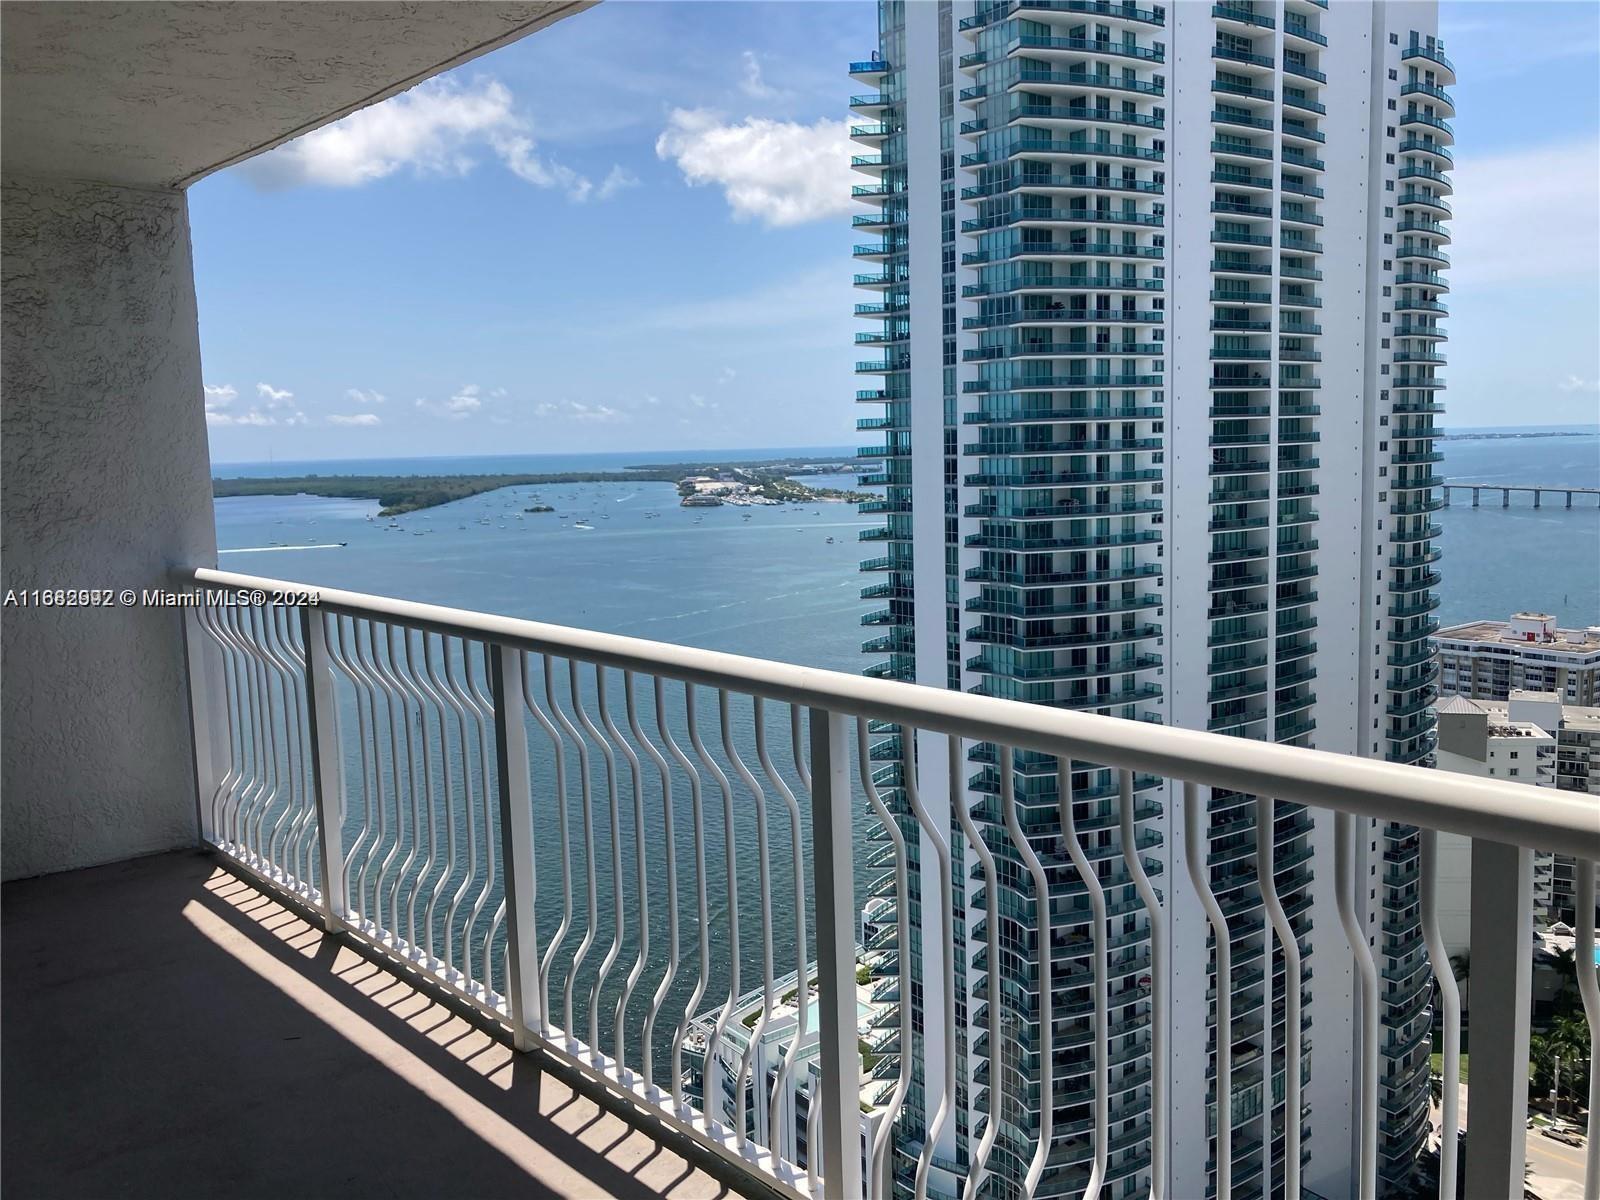
Active
$549,900
1
bds
|
1
ba
|
740
sqft
|
built
2005
1200 Brickell Bay Dr, Miami, FL 33131
$-1,842
Cash flow
-17.5%
Cash-on-Cash Return
2.1%
Cap rate
0.6%
Rent to Value Ratio

Active
$749,000
2
bds
|
2
ba
|
910
sqft
|
built
2015
1100 S Miami Ave, Miami, FL 33130
$-1,714
Cash flow
-11.9%
Cash-on-Cash Return
3.4%
Cap rate
0.5%
Rent to Value Ratio

Active
$2,499,000
4
bds
|
5
ba
|
1,871
sqft
|
built
2019
480 NE 31st St, Miami, FL 33137
$-9,771
Cash flow
-20.4%
Cash-on-Cash Return
1.5%
Cap rate
0.4%
Rent to Value Ratio
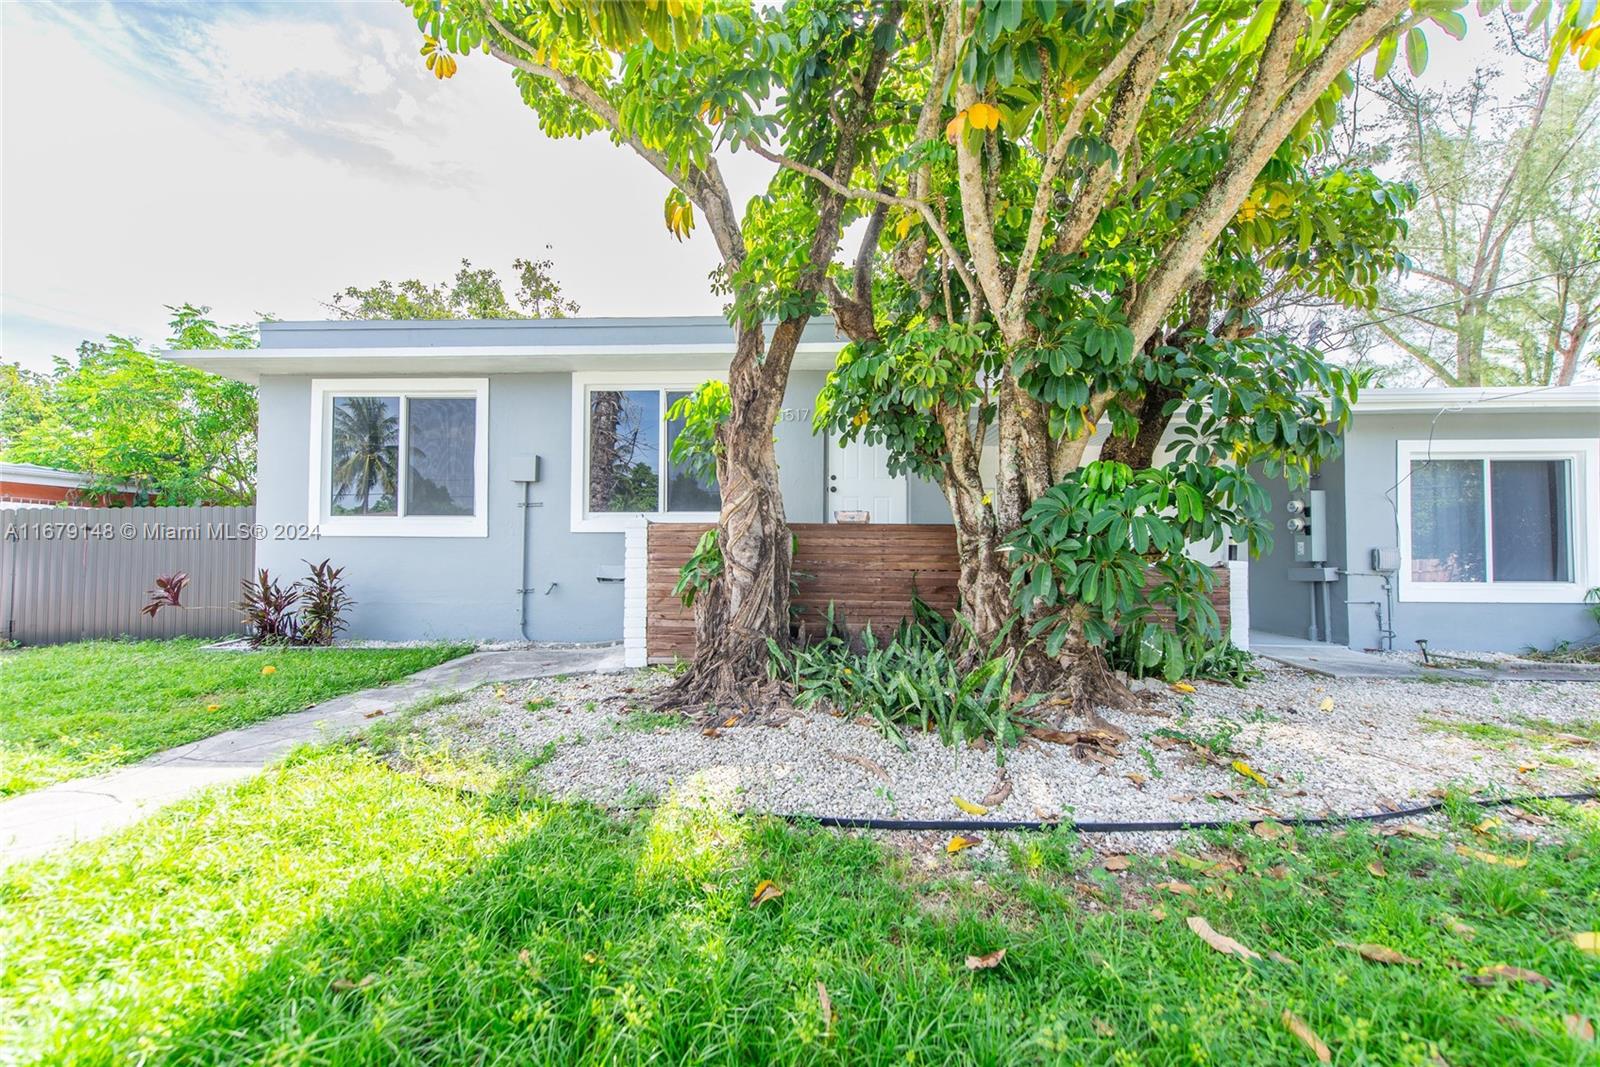
Active
$270,000
2
bds
|
2
ba
|
1,470
sqft
|
built
1969
800 NE 195th St, Miami, FL 33179
$301
Cash flow
5.8%
Cash-on-Cash Return
7.5%
Cap rate
0.9%
Rent to Value Ratio
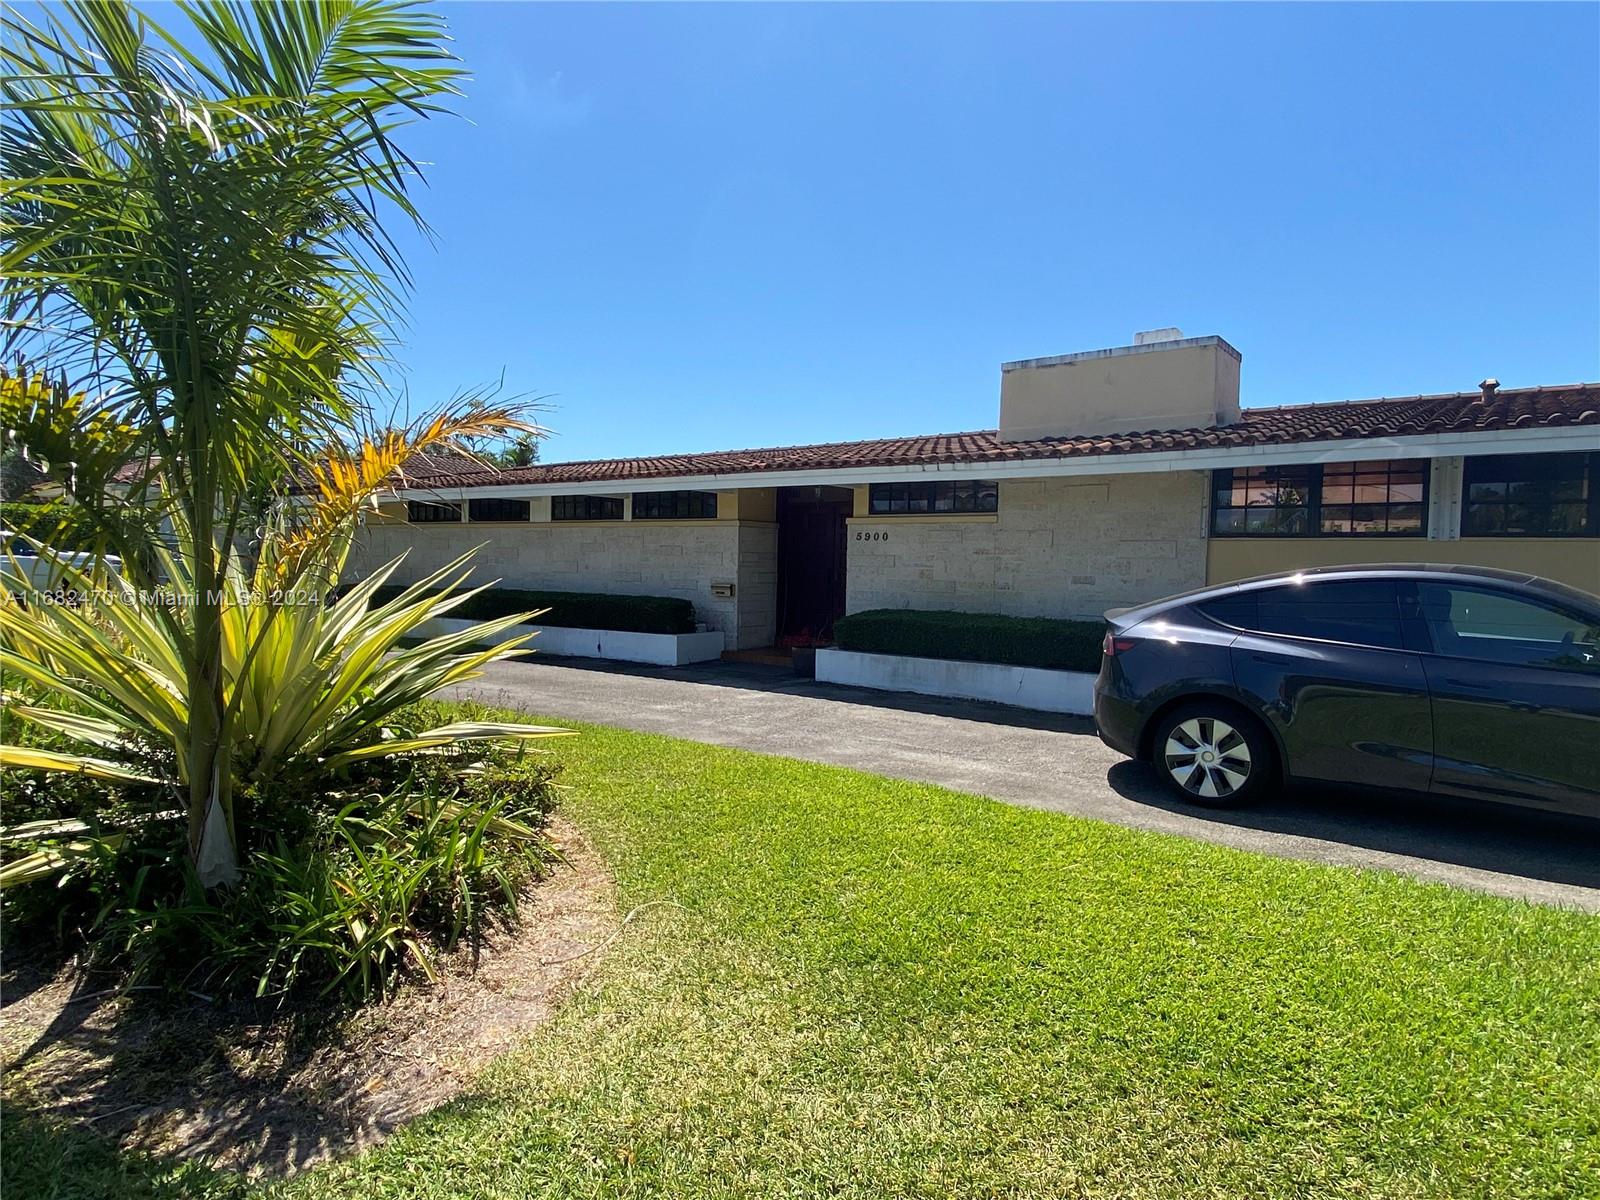
Active
$2,100,000
2
bds
|
2
ba
|
1,739
sqft
|
built
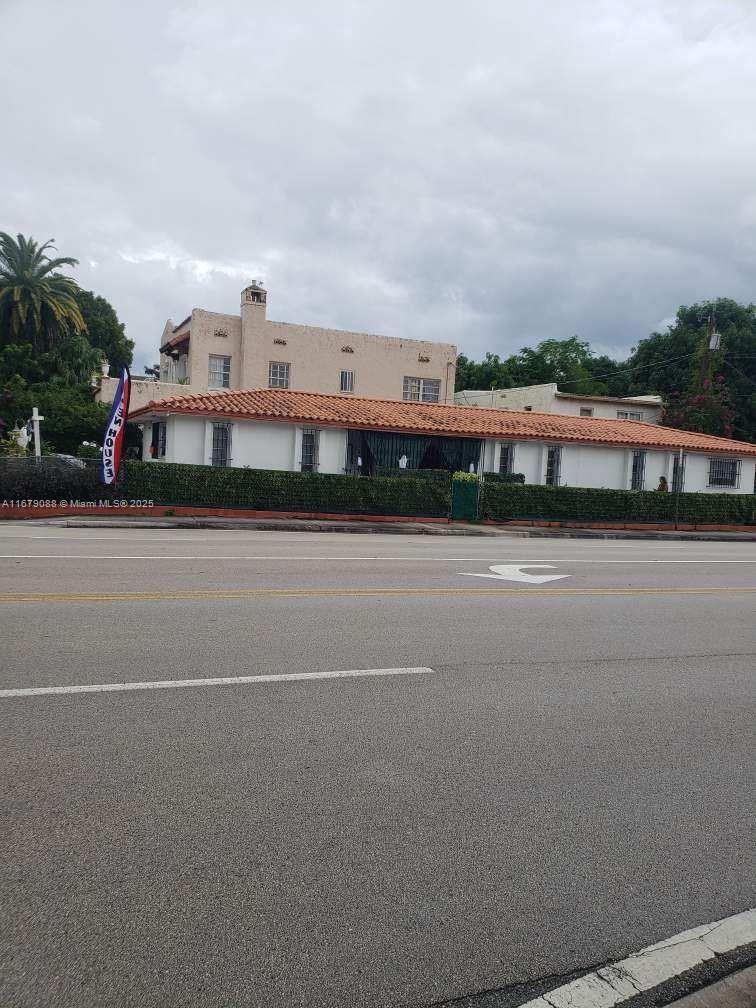
1957
5900 SW 34th St, Miami, FL 33155
$-9,024
Cash flow
-22.4%
Cash-on-Cash Return
1.0%
Cap rate
0.2%
Rent to Value Ratio
Active
$815,000
5
bds
|
5
ba
|
1,716
sqft
|
built
1976
1101 SW 17th Ave, Miami, FL 33135
$-1,016
Cash flow
-6.5%
Cash-on-Cash Return
4.7%
Cap rate
0.7%
Rent to Value Ratio
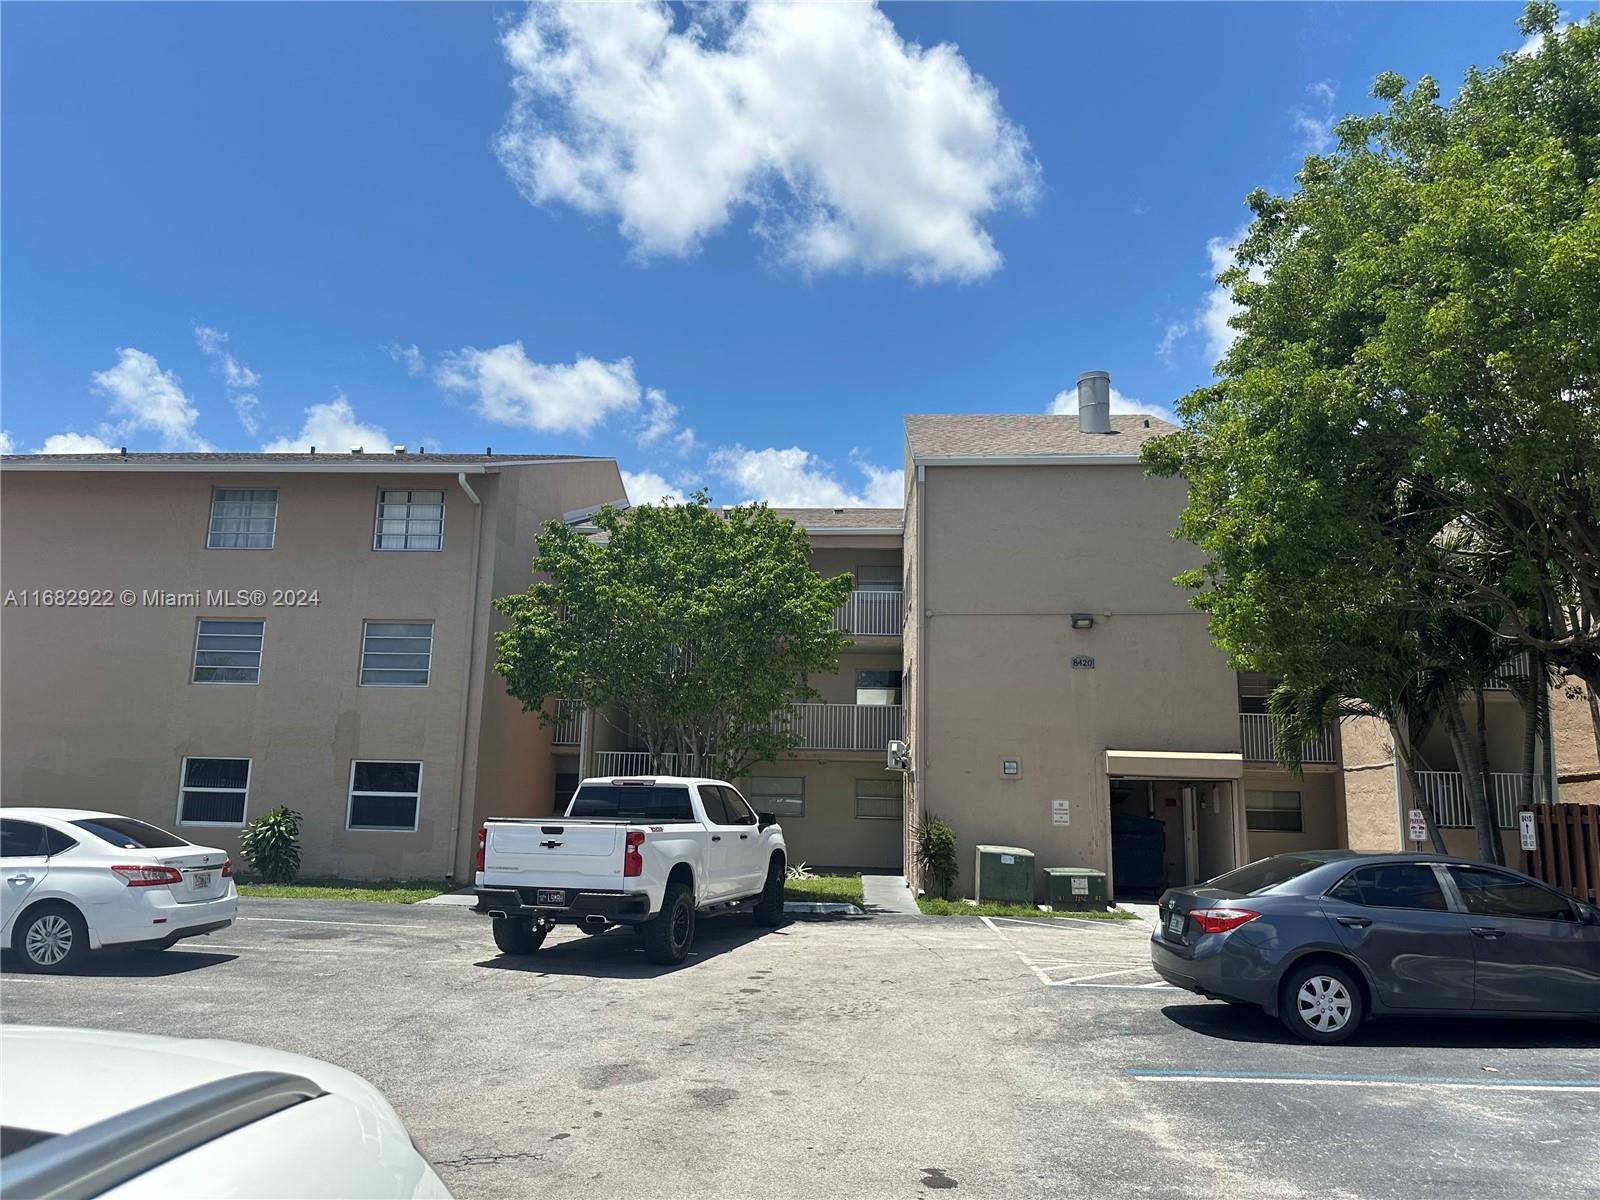
Active
$319,000
3
bds
|
2
ba
|
1,277
sqft
|
built
1980
8420 SW 154th Circle Ct, Miami, FL 33193
$-704
Cash flow
-11.5%
Cash-on-Cash Return
3.5%
Cap rate
0.8%
Rent to Value Ratio
Active
$750,000
2
bds
|
3
ba
|
1,235
sqft
|
built
2010
92 SW 3rd St, Miami, FL 33130
$-3,067
Cash flow
-21.3%
Cash-on-Cash Return
1.2%
Cap rate
0.6%
Rent to Value Ratio
Active
$620,000
1
bds
|
1
ba
|
442
sqft
|
built
2022
398 NE 5th St, Miami, FL 33132
$-2,172
Cash flow
-18.3%
Cash-on-Cash Return
1.9%
Cap rate
0.6%
Rent to Value Ratio
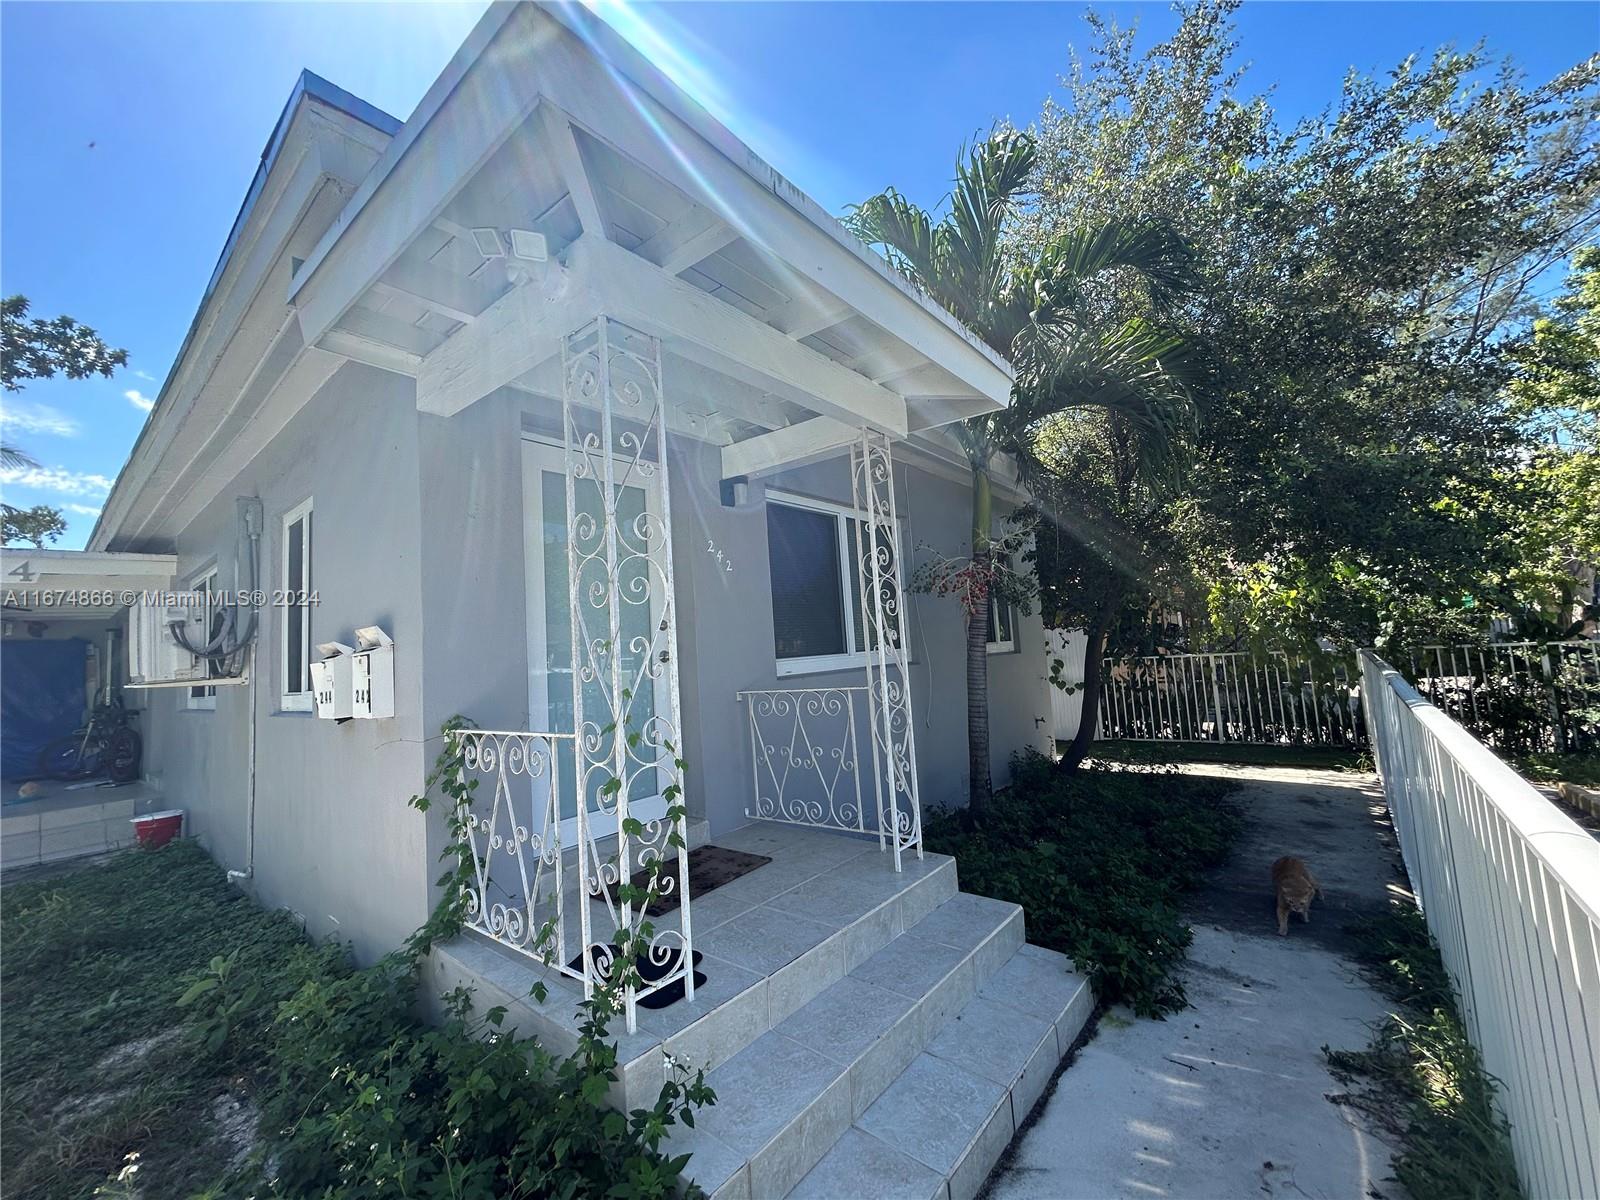
Active
$1,240,000
4
bds
|
0
ba
|
1,620
sqft
|
built
1953
242 NE 55th Ter, Miami, FL 33137
$-4,437
Cash flow
-18.7%
Cash-on-Cash Return
1.9%
Cap rate
0.3%
Rent to Value Ratio
Active
$470,000
2
bds
|
2
ba
|
1,257
sqft
|
built
2006
20000 E Country Club Dr, Miami, FL 33180
$-1,067
Cash flow
-11.8%
Cash-on-Cash Return
3.4%
Cap rate
0.7%
Rent to Value Ratio
Active
$490,000
2
bds
|
2
ba
|
1,048
sqft
|
built
2007
1750 N Bayshore Dr, Miami, FL 33132
$-2,730
Cash flow
-29.1%
Cash-on-Cash Return
-0.5%
Cap rate
0.7%
Rent to Value Ratio
Active
$584,900
1
bds
|
1
ba
|
636
sqft
|
built
2019
3900 Biscayne Blvd, Miami, FL 33137
$-1,856
Cash flow
-16.6%
Cash-on-Cash Return
2.3%
Cap rate
0.7%
Rent to Value Ratio

Active
$760,000
2
bds
|
3
ba
|
1,340
sqft
|
built
2010
92 SW 3rd St, Miami, FL 33130
$-2,453
Cash flow
-16.8%
Cash-on-Cash Return
2.3%
Cap rate
0.7%
Rent to Value Ratio
Active
$520,000
2
bds
|
2
ba
|
1,065
sqft
|
built
1990
770 Claughton Island Dr, Miami, FL 33131
$-2,999
Cash flow
-30.1%
Cash-on-Cash Return
-0.8%
Cap rate
0.7%
Rent to Value Ratio
Active
$299,900
3
bds
|
3
ba
|
1,190
sqft
|
built
1971
10801 SW 109th Ct, Miami, FL 33176
$-632
Cash flow
-11.0%
Cash-on-Cash Return
3.6%
Cap rate
0.8%
Rent to Value Ratio
Active
$950,000
4
bds
|
0
ba
|
3,105
sqft
|
built
1945
62 NW 73rd Pl, Miami, FL 33126
$-3,679
Cash flow
-20.2%
Cash-on-Cash Return
1.5%
Cap rate
0.3%
Rent to Value Ratio

Active
$209,000
1
bds
|
1
ba
|
598
sqft
|
built
1972
801 NW 47th Ave, Miami, FL 33126
$-469
Cash flow
-11.7%
Cash-on-Cash Return
3.5%
Cap rate
0.9%
Rent to Value Ratio

Active under contract
$375,000
1
bds
|
1
ba
|
711
sqft
|
built
2002
2665 SW 37th Ave, Miami, FL 33133
$-1,113
Cash flow
-15.5%
Cash-on-Cash Return
2.6%
Cap rate
0.7%
Rent to Value Ratio
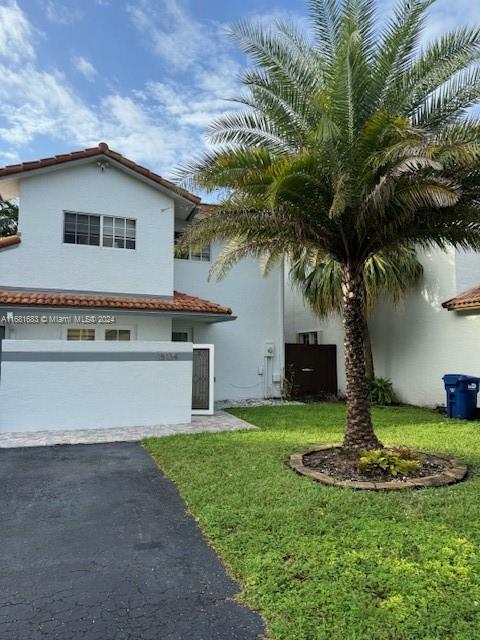
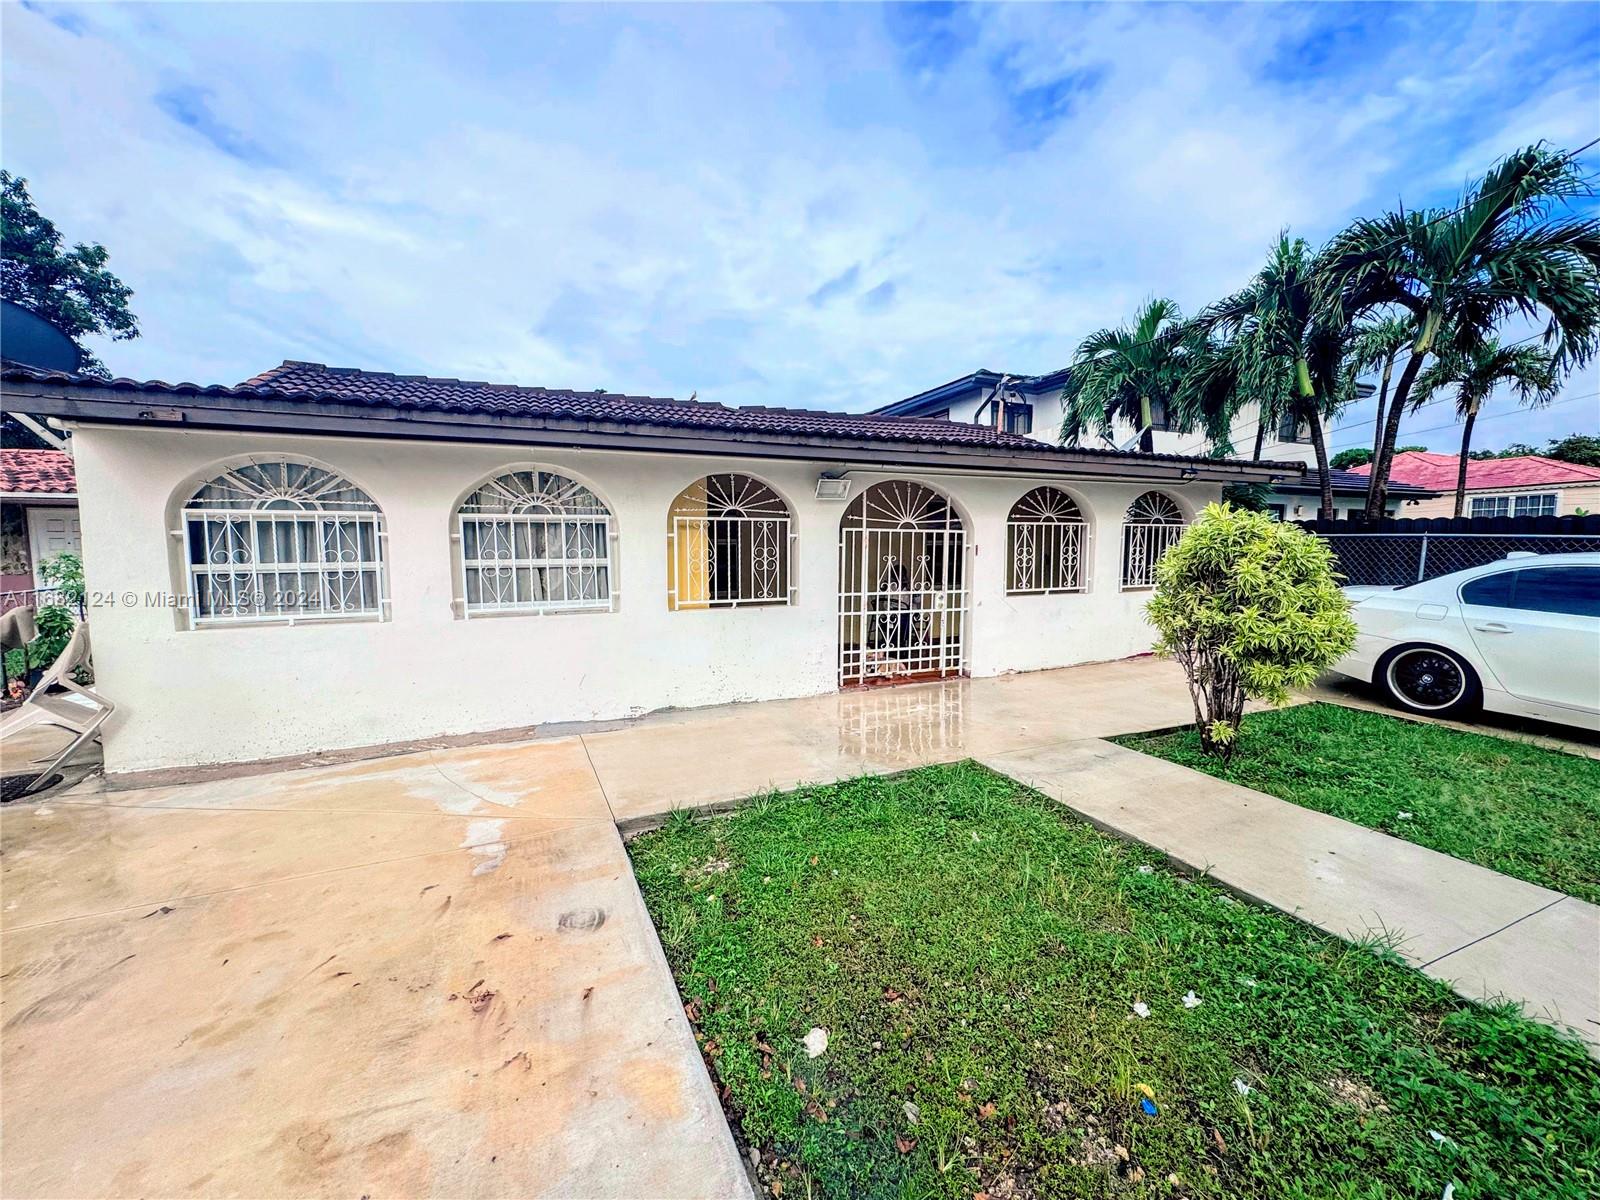
Active
$669,000
3
bds
|
3
ba
|
1,712
sqft
|
built
1986
15134 SW 94th Ter, Miami, FL 33196
$-1,310
Cash flow
-10.2%
Cash-on-Cash Return
3.8%
Cap rate
0.6%
Rent to Value Ratio
Active
$1,480,000
4
bds
|
0
ba
|
3,554
sqft
|
built
1922
405 SW 11th Ave, Miami, FL 33130
$-5,243
Cash flow
-18.5%
Cash-on-Cash Return
1.9%
Cap rate
0.3%
Rent to Value Ratio