Miami, FL Investment Properties for Sale
Browse homes for sale and investment properties in Miami, FL. Refine your search by price, property type, or more.
Best cash flowing properties in Miami, FL
Active
$99,000
bds
|
0
ba
|
65
sqft
|
built
1981
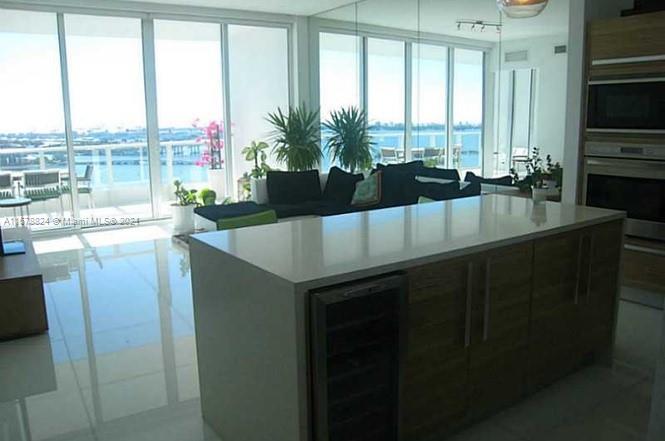
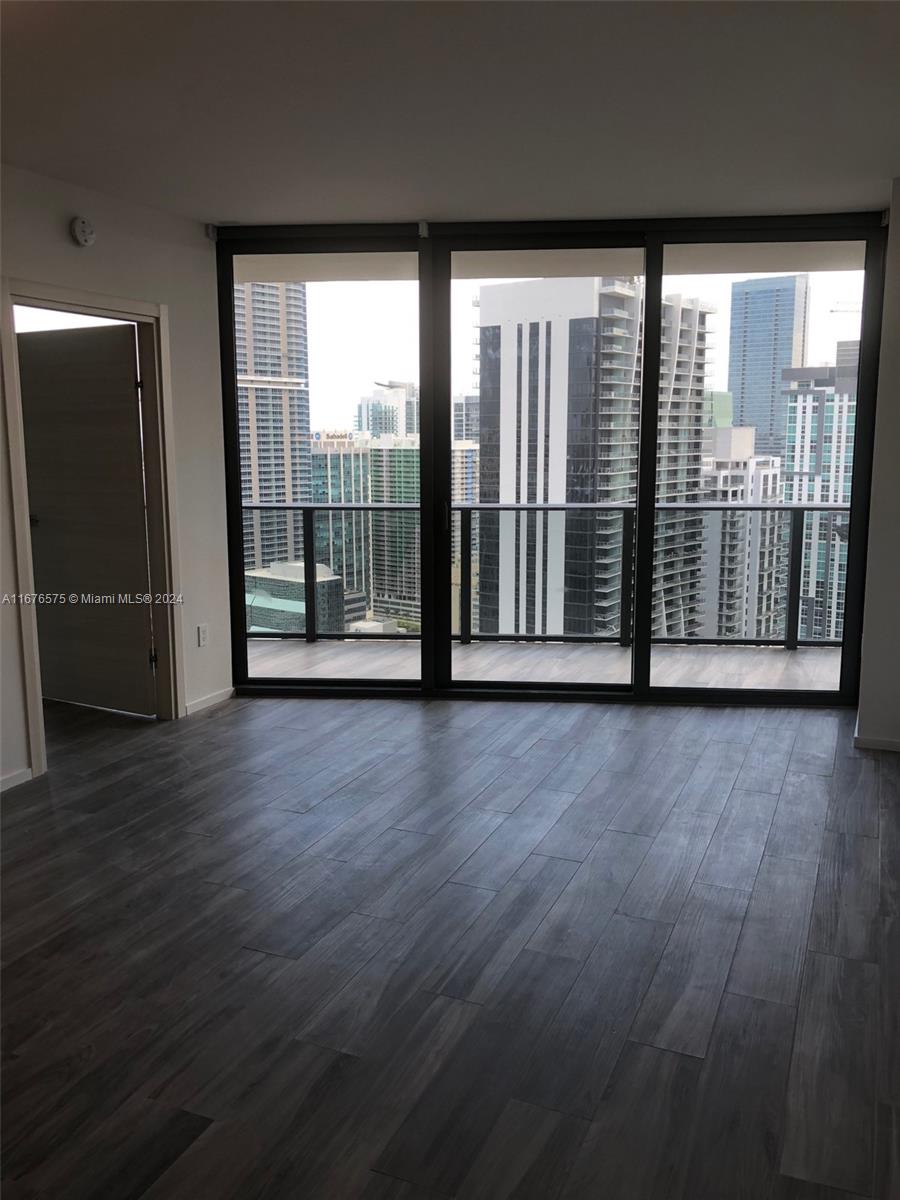
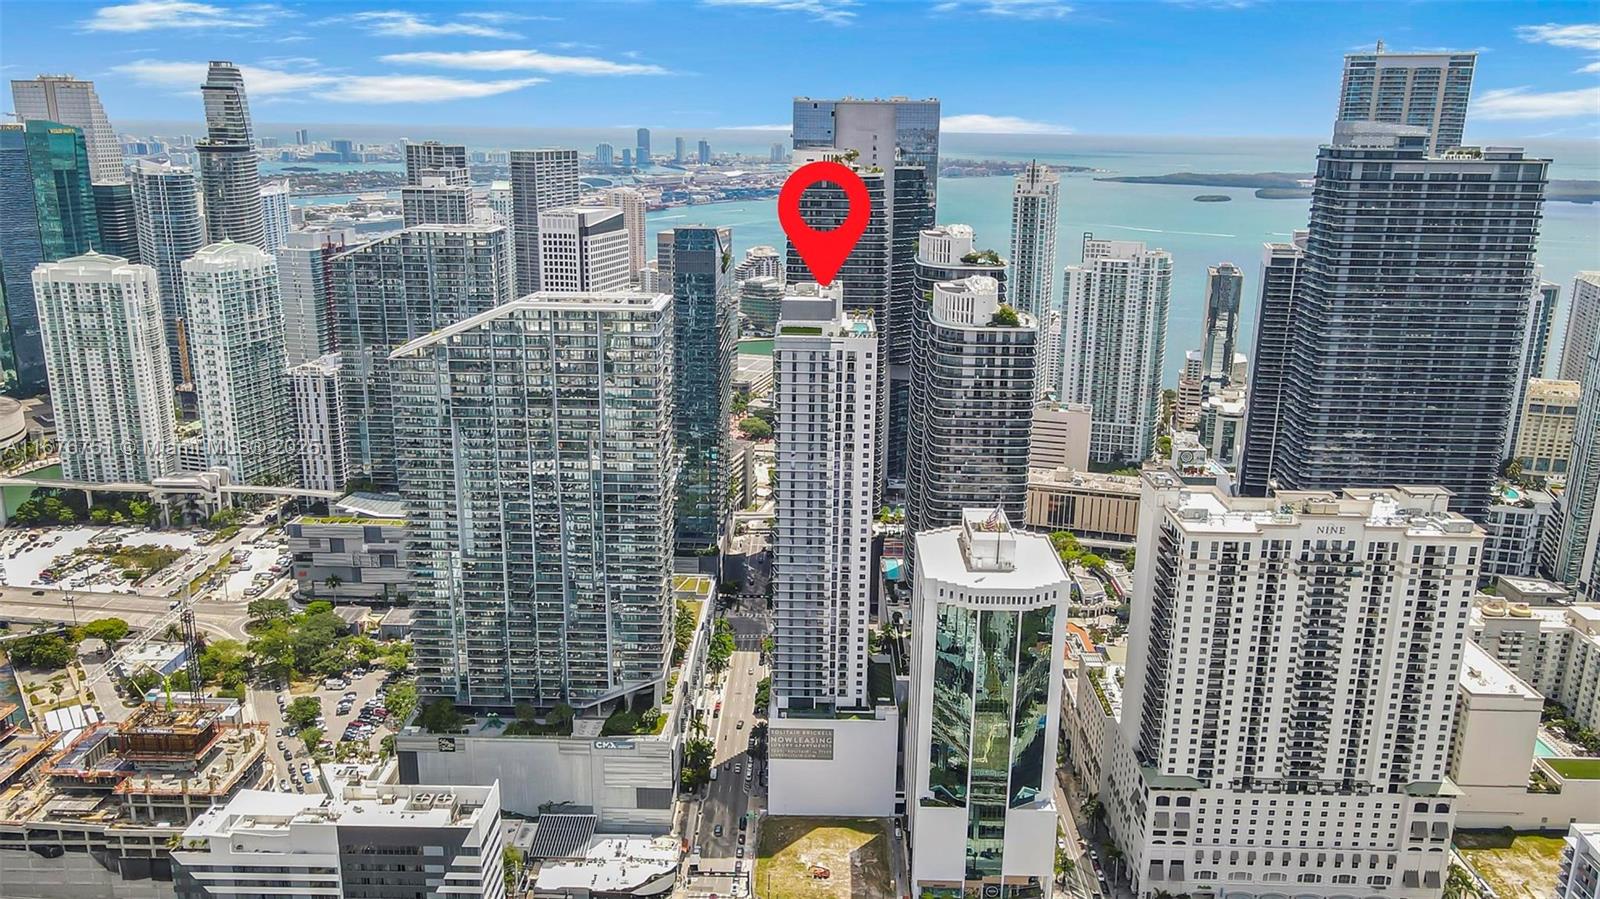
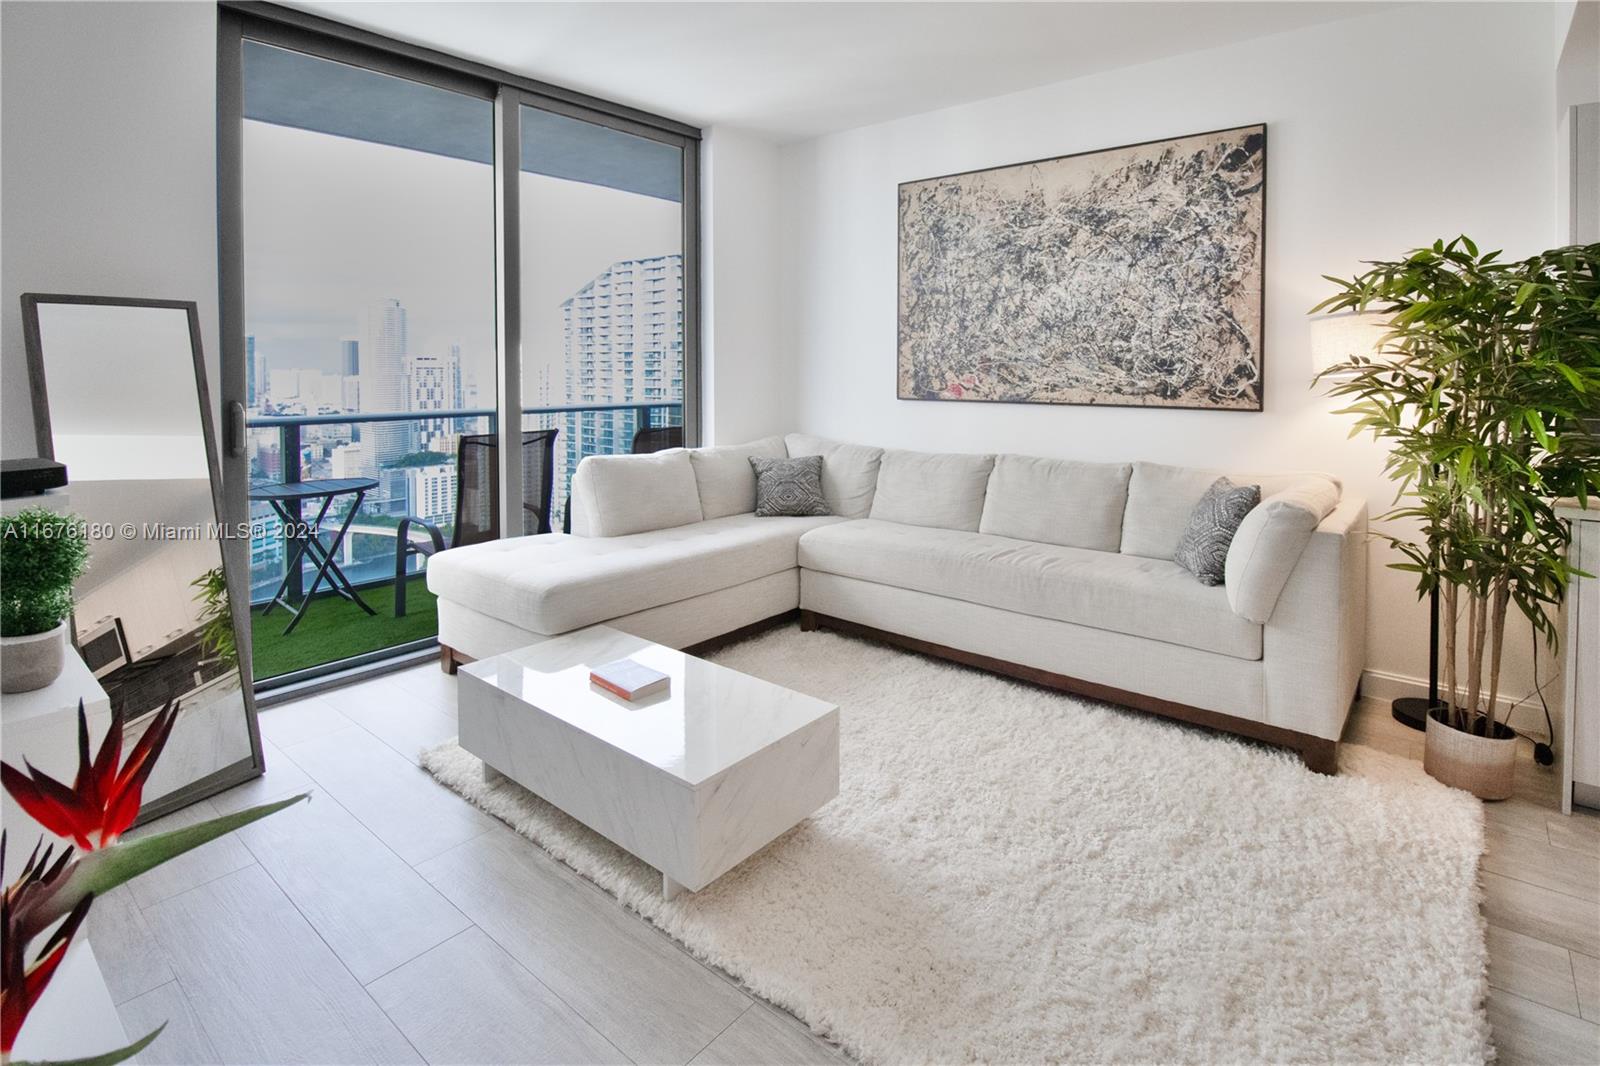
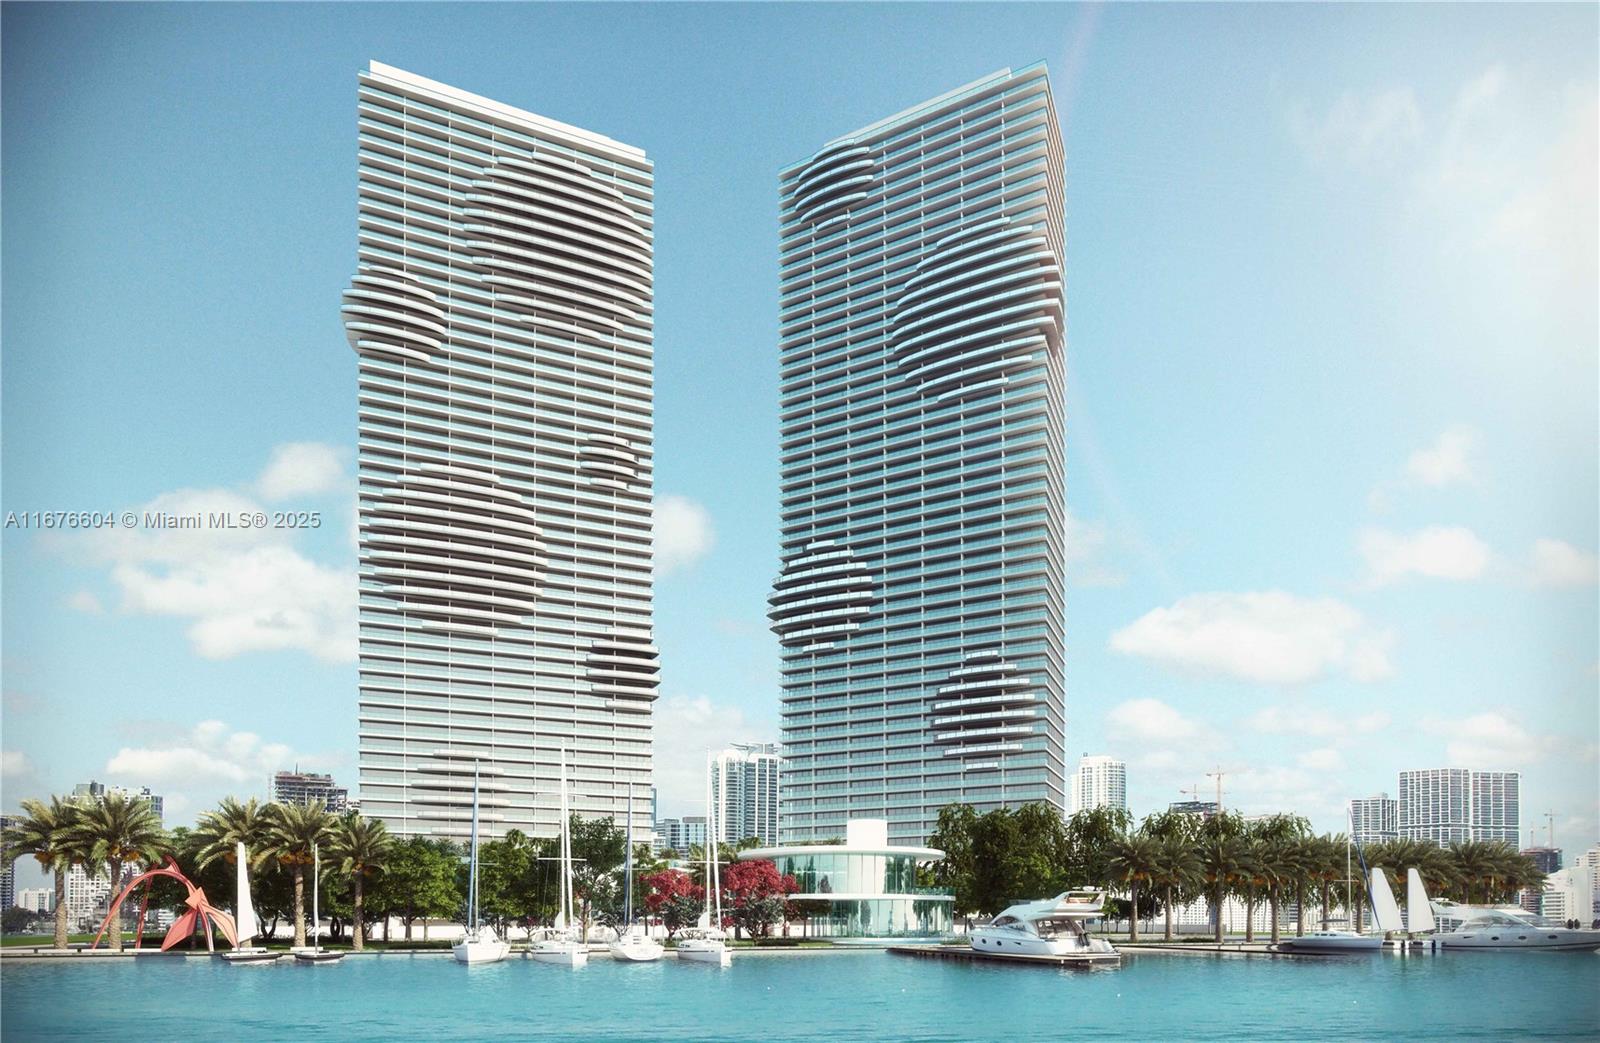
1541 Brickell Ave, Miami, FL 33129
$3,390
Cash flow
178.7%
Cash-on-Cash Return
47.4%
Cap rate
5.8%
Rent to Value Ratio

Active
$225,900
1
bds
|
1
ba
|
680
sqft
|
built
1973
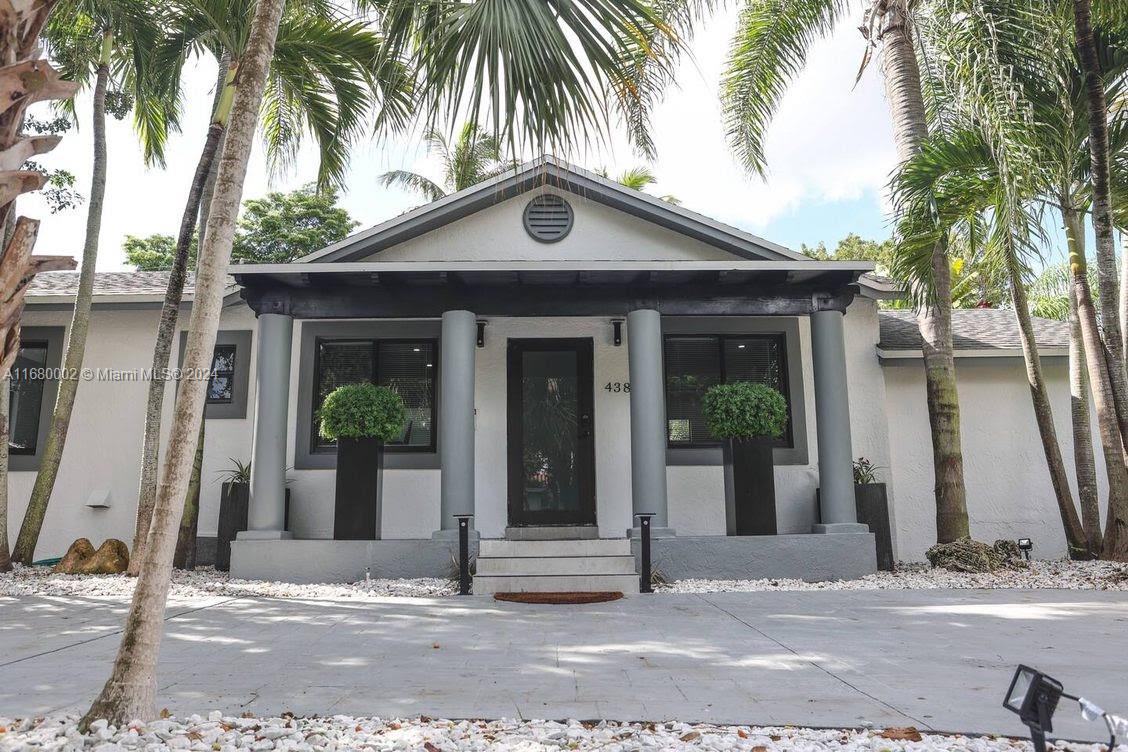
399 NW 72nd Ave, Miami, FL 33126
$-271
Cash flow
-6.3%
Cash-on-Cash Return
4.8%
Cap rate
0.9%
Rent to Value Ratio
6,163 out of 6,996 properties for sale in Miami, FL
Limited Results Shown
Create a free account, or log in to reveal all property listings and enjoy the complete experience.
Active
$1,080,000
4
bds
|
3
ba
|
959
sqft
|
built
1939
4384 SW 12th St, Miami, FL 33134
$-2,885
Cash flow
-13.9%
Cash-on-Cash Return
3.1%
Cap rate
0.5%
Rent to Value Ratio
Active
$829,000
3
bds
|
3
ba
|
990
sqft
|
built
1968
905 Brickell Bay Dr, Miami, FL 33131
$-4,088
Cash flow
-25.7%
Cash-on-Cash Return
0.4%
Cap rate
0.6%
Rent to Value Ratio
Active
$760,000
2
bds
|
2
ba
|
1,227
sqft
|
built
2005
325 S Biscayne Blvd, Miami, FL 33131
$-2,078
Cash flow
-14.3%
Cash-on-Cash Return
3.0%
Cap rate
0.5%
Rent to Value Ratio
Active
$499,000
2
bds
|
2
ba
|
985
sqft
|
built
1990
770 Claughton Island Dr, Miami, FL 33131
$-2,460
Cash flow
-25.7%
Cash-on-Cash Return
0.4%
Cap rate
0.8%
Rent to Value Ratio
Active
$1,099,000
2
bds
|
2
ba
|
1,390
sqft
|
built
2009
495 Brickell Ave, Miami, FL 33131
$-4,326
Cash flow
-20.5%
Cash-on-Cash Return
1.6%
Cap rate
0.5%
Rent to Value Ratio
Active
$1,420,000
3
bds
|
3
ba
|
1,195
sqft
|
built
1959
13550 SW 99th Pl, Miami, FL 33176
$-4,069
Cash flow
-15.0%
Cash-on-Cash Return
2.8%
Cap rate
0.4%
Rent to Value Ratio

Active
$899,000
3
bds
|
2
ba
|
1,192
sqft
|
built
1940
844 SW 8th Ave, Miami, FL 33130
$-1,620
Cash flow
-9.4%
Cash-on-Cash Return
4.1%
Cap rate
0.6%
Rent to Value Ratio
Pending
$580,000
3
bds
|
0
ba
|
1,538
sqft
|
built
1939
1439 NW 26th St, Miami, FL 33142
$-1,779
Cash flow
-16.0%
Cash-on-Cash Return
2.6%
Cap rate
0.4%
Rent to Value Ratio
Active
$293,500
2
bds
|
2
ba
|
900
sqft
|
built
1972
210 Fontainebleau Blvd, Miami, FL 33172
$-372
Cash flow
-6.6%
Cash-on-Cash Return
4.8%
Cap rate
0.8%
Rent to Value Ratio
Active
$940,000
1
bds
|
2
ba
|
1,147
sqft
|
built
2010
2020 N Bayshore Dr, Miami, FL 33137
$-3,670
Cash flow
-20.4%
Cash-on-Cash Return
1.6%
Cap rate
0.6%
Rent to Value Ratio
Active
$869,000
4
bds
|
3
ba
|
2,250
sqft
|
built
1948
821 NW 40th Ave, Miami, FL 33126
$-1,742
Cash flow
-10.5%
Cash-on-Cash Return
3.9%
Cap rate
0.5%
Rent to Value Ratio
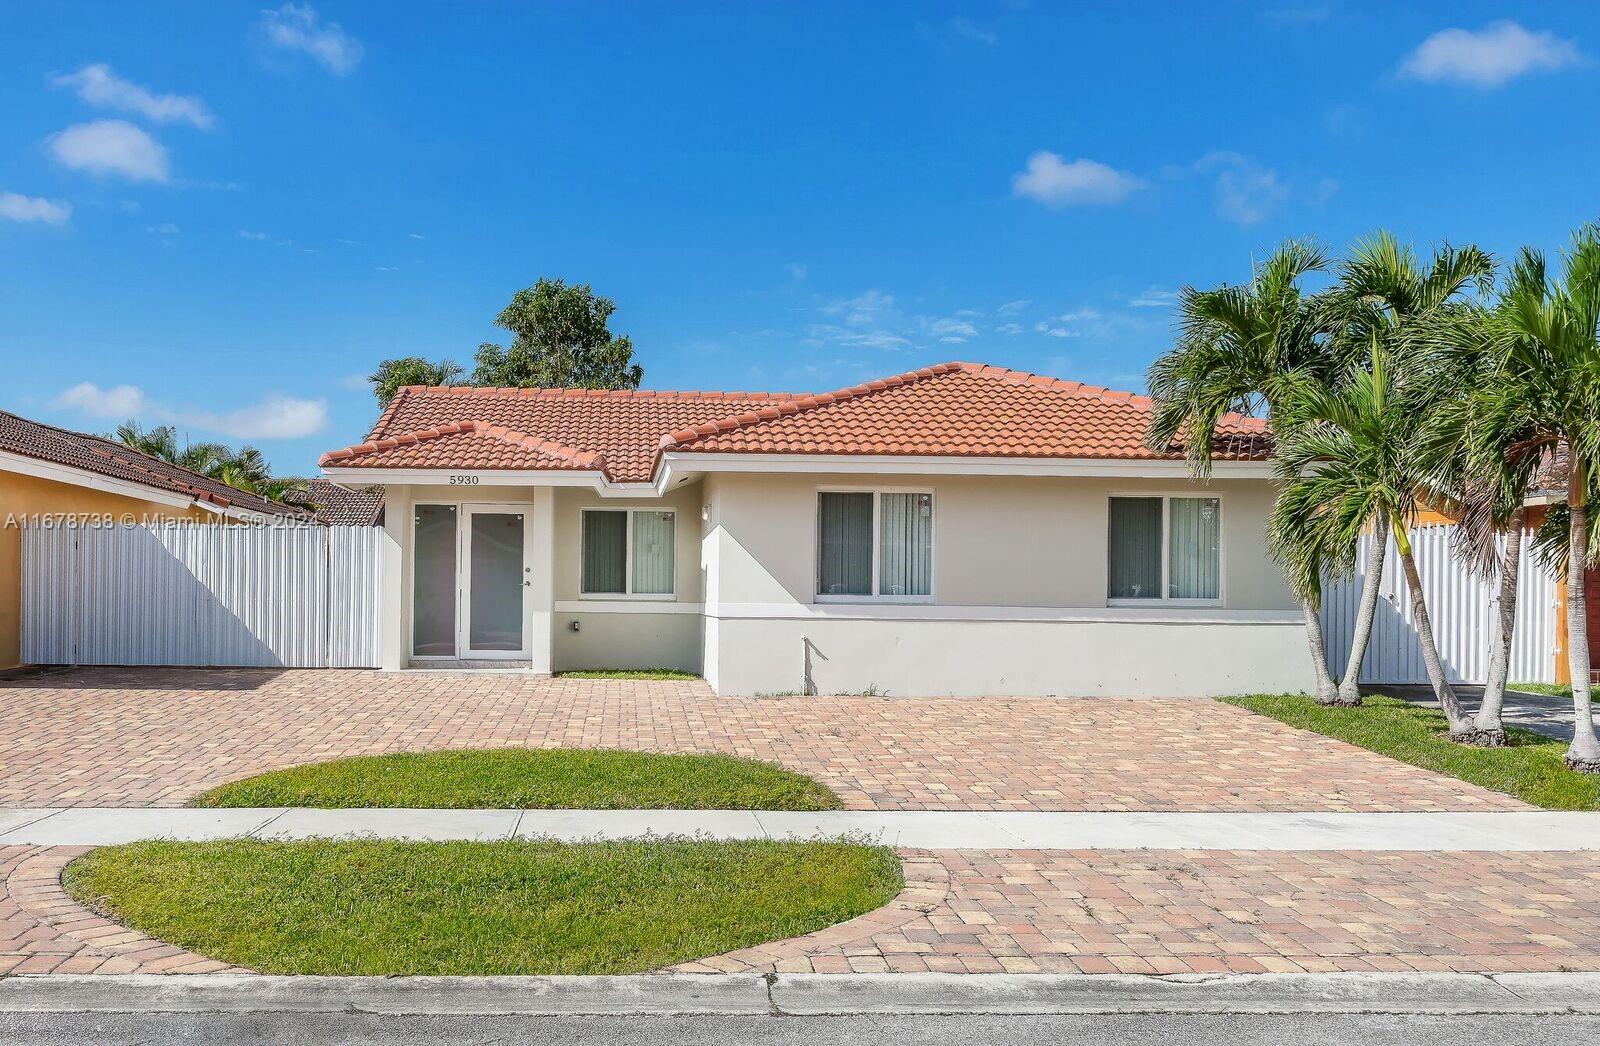
Active
$700,000
4
bds
|
3
ba
|
1,324
sqft
|
built
1987
5930 SW 147th Ct, Miami, FL 33193
$-1,364
Cash flow
-10.2%
Cash-on-Cash Return
3.9%
Cap rate
0.6%
Rent to Value Ratio
Active
$955,000
1
bds
|
2
ba
|
1,135
sqft
|
built
2010
2020 N Bayshore Dr, Miami, FL 33137
$-3,623
Cash flow
-19.8%
Cash-on-Cash Return
1.7%
Cap rate
0.6%
Rent to Value Ratio
Active
$749,500
2
bds
|
3
ba
|
1,316
sqft
|
built
1983
1627 Brickell Ave, Miami, FL 33129
$-2,466
Cash flow
-17.2%
Cash-on-Cash Return
2.3%
Cap rate
0.7%
Rent to Value Ratio
Active
$1,100,000
2
bds
|
2
ba
|
1,500
sqft
|
built
2009
495 Brickell Ave, Miami, FL 33131
$-3,855
Cash flow
-18.3%
Cash-on-Cash Return
2.1%
Cap rate
0.6%
Rent to Value Ratio
Active
$1,150,000
2
bds
|
3
ba
|
1,647
sqft
|
built
2009
1100 Biscayne Blvd, Miami, FL 33132
$-4,479
Cash flow
-20.3%
Cash-on-Cash Return
1.6%
Cap rate
0.6%
Rent to Value Ratio

Active
$3,750,000
7
bds
|
5
ba
|
4,072
sqft
|
built
1954
9234 SW 112th St, Miami, FL 33176
$-14,645
Cash flow
-20.4%
Cash-on-Cash Return
1.6%
Cap rate
0.2%
Rent to Value Ratio
Active
$539,000
1
bds
|
2
ba
|
1,058
sqft
|
built
2006
41 SE 5th St, Miami, FL 33131
$-1,585
Cash flow
-15.3%
Cash-on-Cash Return
2.8%
Cap rate
0.6%
Rent to Value Ratio

Active
$1,200,000
2
bds
|
2
ba
|
1,633
sqft
|
built
2009
495 Brickell Ave, Miami, FL 33131
$-4,748
Cash flow
-20.6%
Cash-on-Cash Return
1.5%
Cap rate
0.5%
Rent to Value Ratio
Active
$669,900
1
bds
|
2
ba
|
1,031
sqft
|
built
2005
901 Brickell Key Blvd, Miami, FL 33131
$-2,678
Cash flow
-20.9%
Cash-on-Cash Return
1.5%
Cap rate
0.6%
Rent to Value Ratio
Active
$4,450,000
2
bds
|
3
ba
|
2,232
sqft
|
built
2020
2811 S Bayshore Dr, Miami, FL 33133
$-26,446
Cash flow
-31.0%
Cash-on-Cash Return
-0.8%
Cap rate
0.2%
Rent to Value Ratio

Active
$749,000
2
bds
|
3
ba
|
1,340
sqft
|
built
2010
92 SW 3rd St, Miami, FL 33130
$-2,836
Cash flow
-19.8%
Cash-on-Cash Return
1.7%
Cap rate
0.7%
Rent to Value Ratio

Active
$2,000,000
3
bds
|
1
ba
|
1,725
sqft
|
built
1958
10875 SW 7th Ter, Miami, FL 33174
$-7,020
Cash flow
-18.3%
Cash-on-Cash Return
2.1%
Cap rate
0.3%
Rent to Value Ratio
Active
$580,000
1
bds
|
1
ba
|
636
sqft
|
built
2019
3900 Biscayne Blvd, Miami, FL 33137
$-2,137
Cash flow
-19.2%
Cash-on-Cash Return
1.9%
Cap rate
0.6%
Rent to Value Ratio
Active
$350,000
bds
|
1
ba
|
638
sqft
|
built
2006
690 SW 1st Ct, Miami, FL 33130
$-1,266
Cash flow
-18.9%
Cash-on-Cash Return
1.9%
Cap rate
0.7%
Rent to Value Ratio

Active
$224,000
2
bds
|
2
ba
|
1,172
sqft
|
built
1973
661 NE 195th St, Miami, FL 33179
$-430
Cash flow
-10.0%
Cash-on-Cash Return
4.0%
Cap rate
1.0%
Rent to Value Ratio
Active
$99,000
bds
|
0
ba
|
65
sqft
|
built
1981
1541 Brickell Ave, Miami, FL 33129
$3,390
Cash flow
178.7%
Cash-on-Cash Return
47.4%
Cap rate
5.8%
Rent to Value Ratio
Active
$229,000
2
bds
|
2
ba
|
1,116
sqft
|
built
1967
1540 NE 191st St, Miami, FL 33179
$-388
Cash flow
-8.8%
Cash-on-Cash Return
4.2%
Cap rate
1.0%
Rent to Value Ratio

Active
$1,800,000
2
bds
|
1
ba
|
1,333
sqft
|
built
1948
10815 SW 7th Ter, Miami, FL 33174
$-7,674
Cash flow
-22.2%
Cash-on-Cash Return
1.2%
Cap rate
0.2%
Rent to Value Ratio
Active
$599,900
2
bds
|
2
ba
|
1,203
sqft
|
built
2008
244 Biscayne Blvd, Miami, FL 33132
$-2,268
Cash flow
-19.7%
Cash-on-Cash Return
1.7%
Cap rate
0.8%
Rent to Value Ratio

Active
$785,000
2
bds
|
2
ba
|
1,315
sqft
|
built
2008
888 Biscayne Blvd, Miami, FL 33132
$-2,724
Cash flow
-18.1%
Cash-on-Cash Return
2.1%
Cap rate
0.6%
Rent to Value Ratio

Active under contract
$699,000
3
bds
|
3
ba
|
1,688
sqft
|
built
2006
20000 E Country Club Dr, Miami, FL 33180
$-2,815
Cash flow
-21.0%
Cash-on-Cash Return
1.5%
Cap rate
0.7%
Rent to Value Ratio
Active
$1,095,000
3
bds
|
2
ba
|
1,110
sqft
|
built
2018
501 NE 31st St, Miami, FL 33137
$-3,900
Cash flow
-18.6%
Cash-on-Cash Return
2.0%
Cap rate
0.6%
Rent to Value Ratio
Active
$735,000
1
bds
|
2
ba
|
838
sqft
|
built
2018
801 S Miami Ave, Miami, FL 33130
$-2,930
Cash flow
-20.8%
Cash-on-Cash Return
1.5%
Cap rate
0.6%
Rent to Value Ratio
Active
$225,900
1
bds
|
1
ba
|
680
sqft
|
built
1973
399 NW 72nd Ave, Miami, FL 33126
$-271
Cash flow
-6.3%
Cash-on-Cash Return
4.8%
Cap rate
0.9%
Rent to Value Ratio
Active
$850,000
1
bds
|
2
ba
|
889
sqft
|
built
2016
88 SW 7th St, Miami, FL 33130
$-2,833
Cash flow
-17.4%
Cash-on-Cash Return
2.3%
Cap rate
0.7%
Rent to Value Ratio
Active
$599,999
1
bds
|
2
ba
|
776
sqft
|
built
2017
55 SW 9th St, Miami, FL 33130
$-2,391
Cash flow
-20.8%
Cash-on-Cash Return
1.5%
Cap rate
0.6%
Rent to Value Ratio
Active
$820,000
2
bds
|
0
ba
|
1,640
sqft
|
built
1941
15 NE 70th St, Miami, FL 33138
$-3,117
Cash flow
-19.8%
Cash-on-Cash Return
1.7%
Cap rate
0.3%
Rent to Value Ratio
Active
$945,000
2
bds
|
3
ba
|
1,322
sqft
|
built
2019
480 NE 31st St, Miami, FL 33137
$-3,697
Cash flow
-20.4%
Cash-on-Cash Return
1.6%
Cap rate
0.6%
Rent to Value Ratio
Active
$629,000
1
bds
|
2
ba
|
851
sqft
|
built
2017
55 SW 9th St, Miami, FL 33130
$-2,703
Cash flow
-22.4%
Cash-on-Cash Return
1.1%
Cap rate
0.6%
Rent to Value Ratio