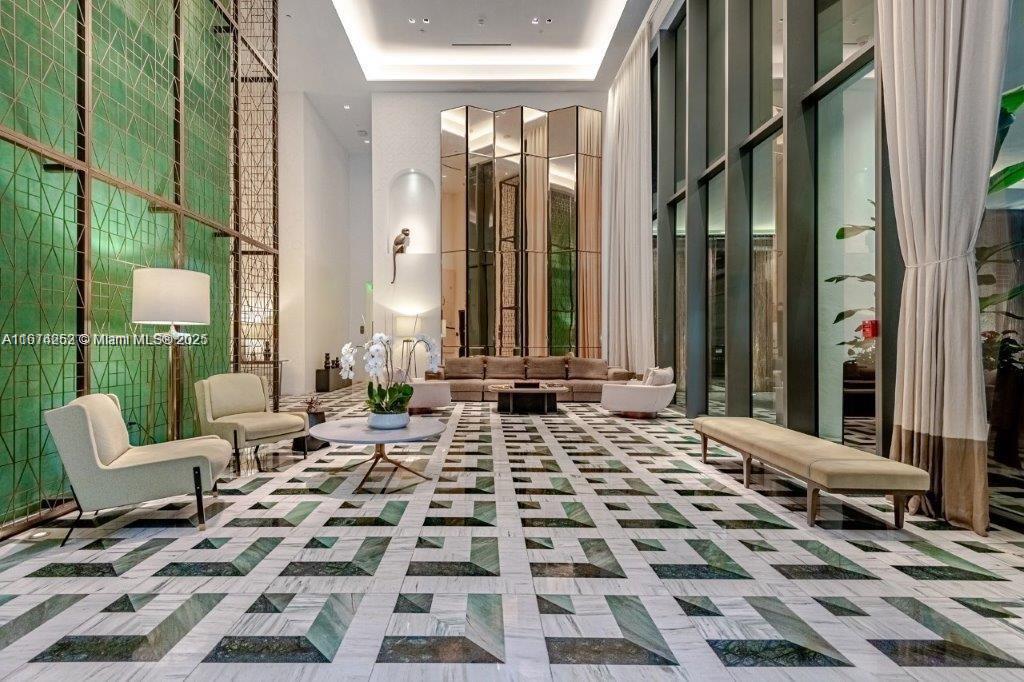
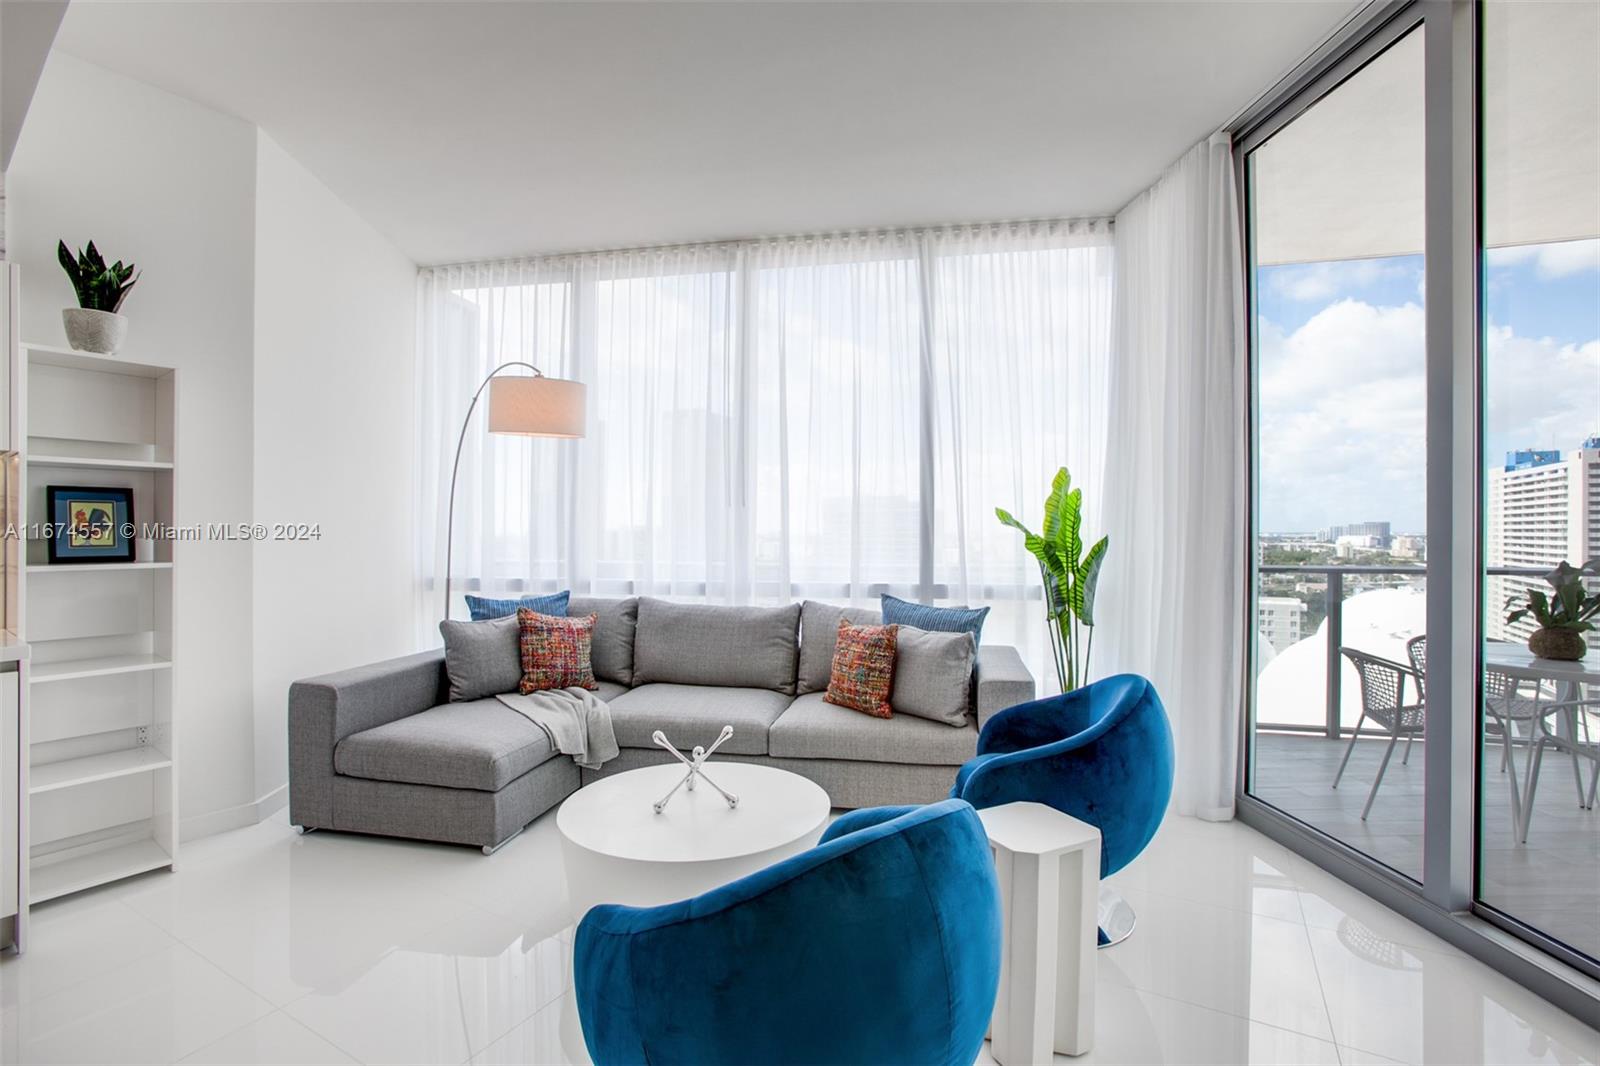
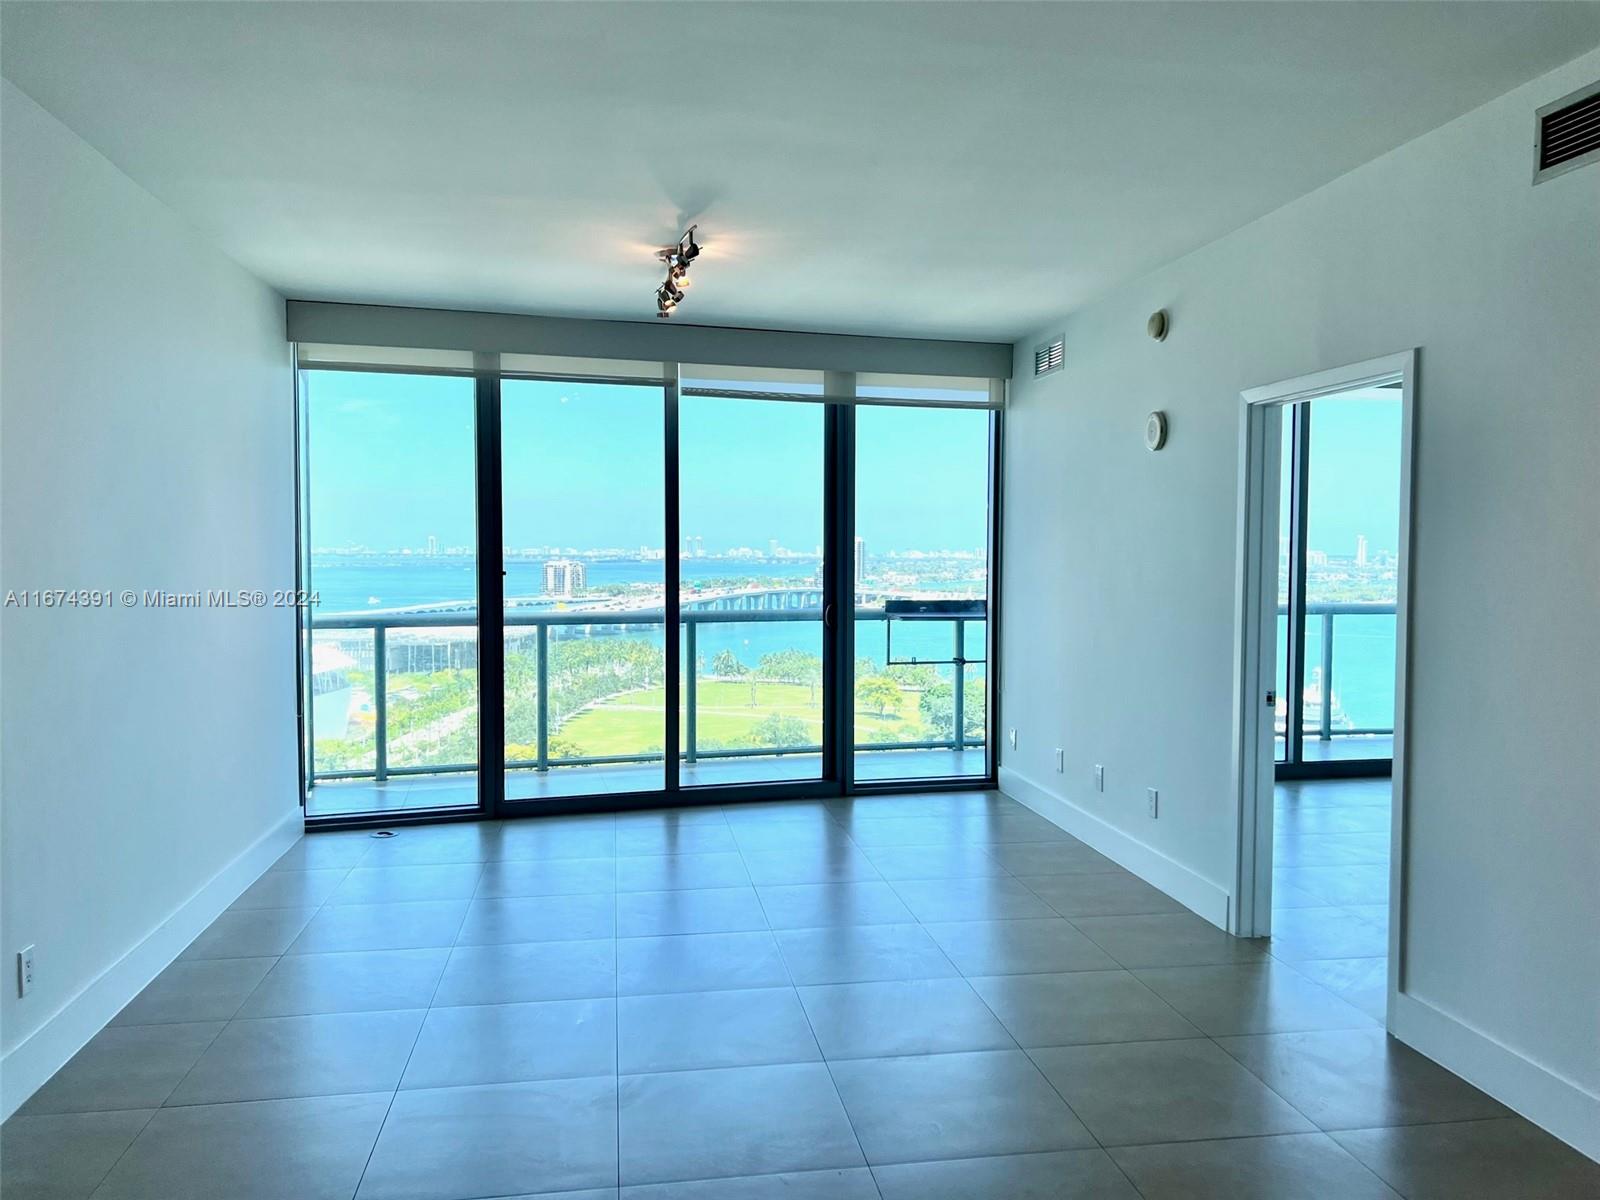
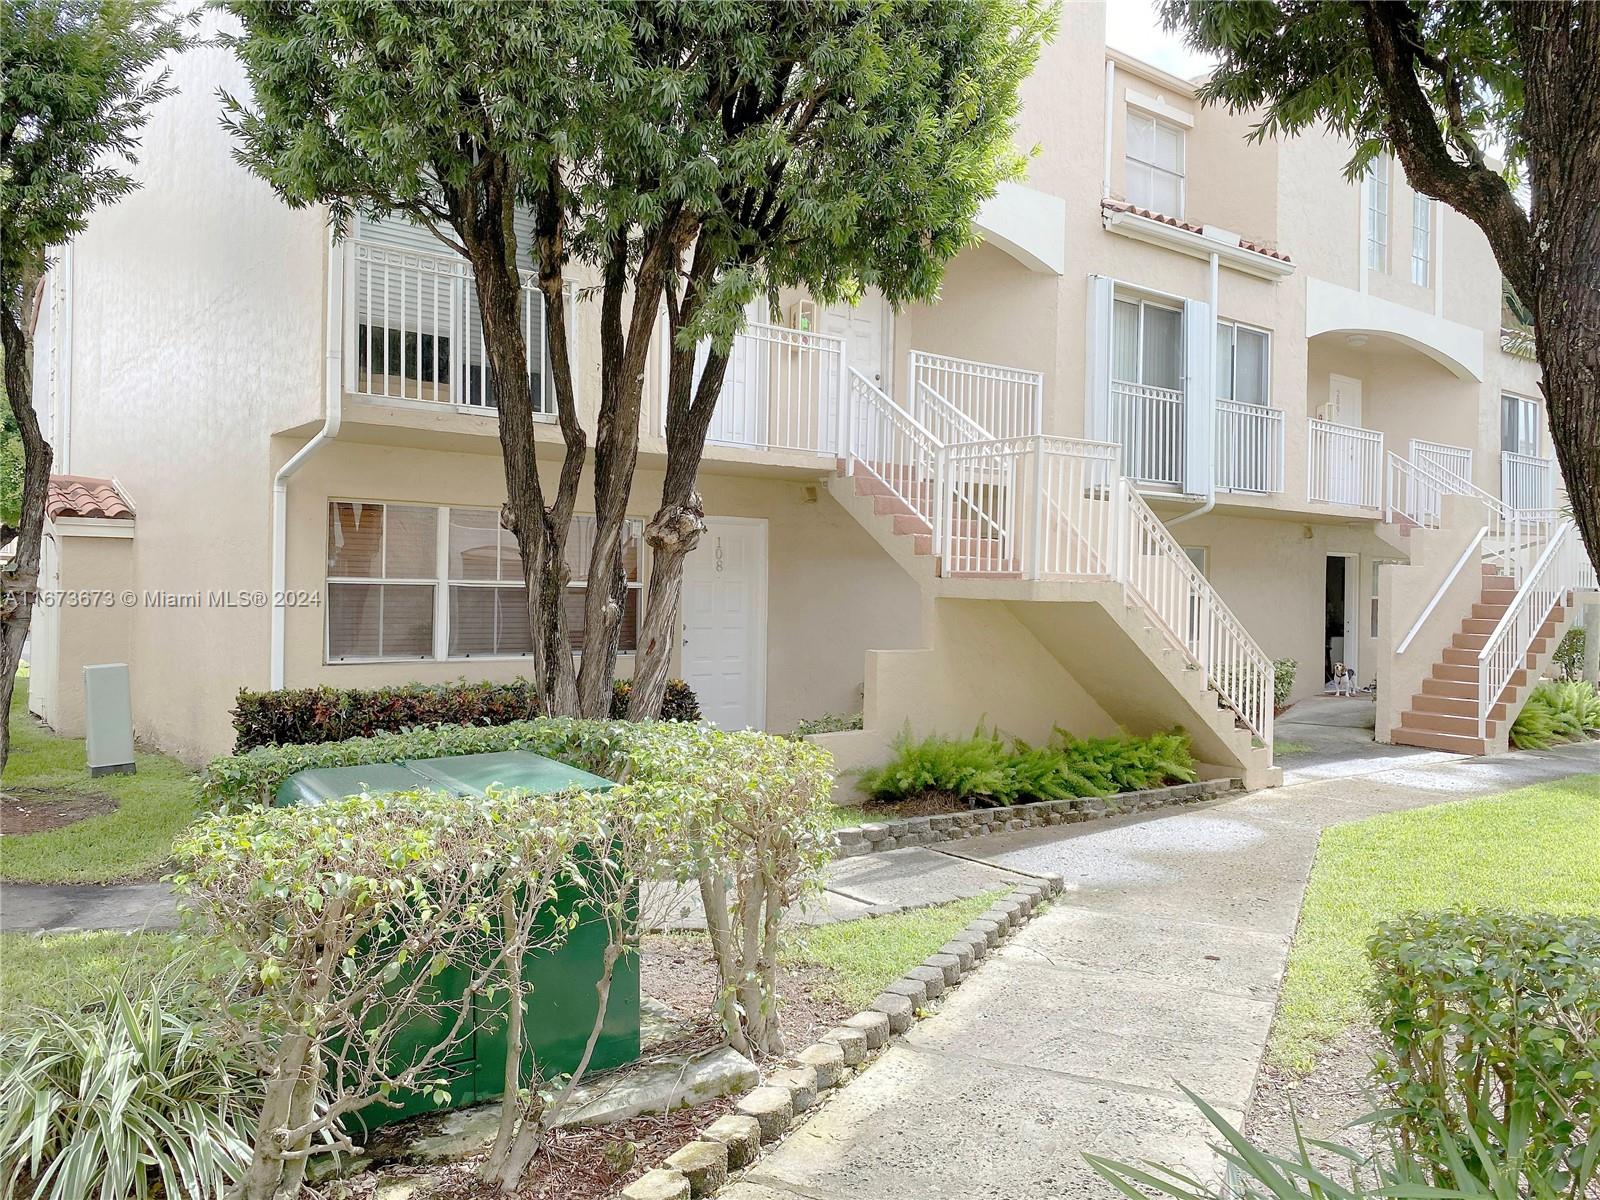
Miami, FL Investment Properties for Sale
Browse homes for sale and investment properties in Miami, FL. Refine your search by price, property type, or more.
Best cash flowing properties in Miami, FL
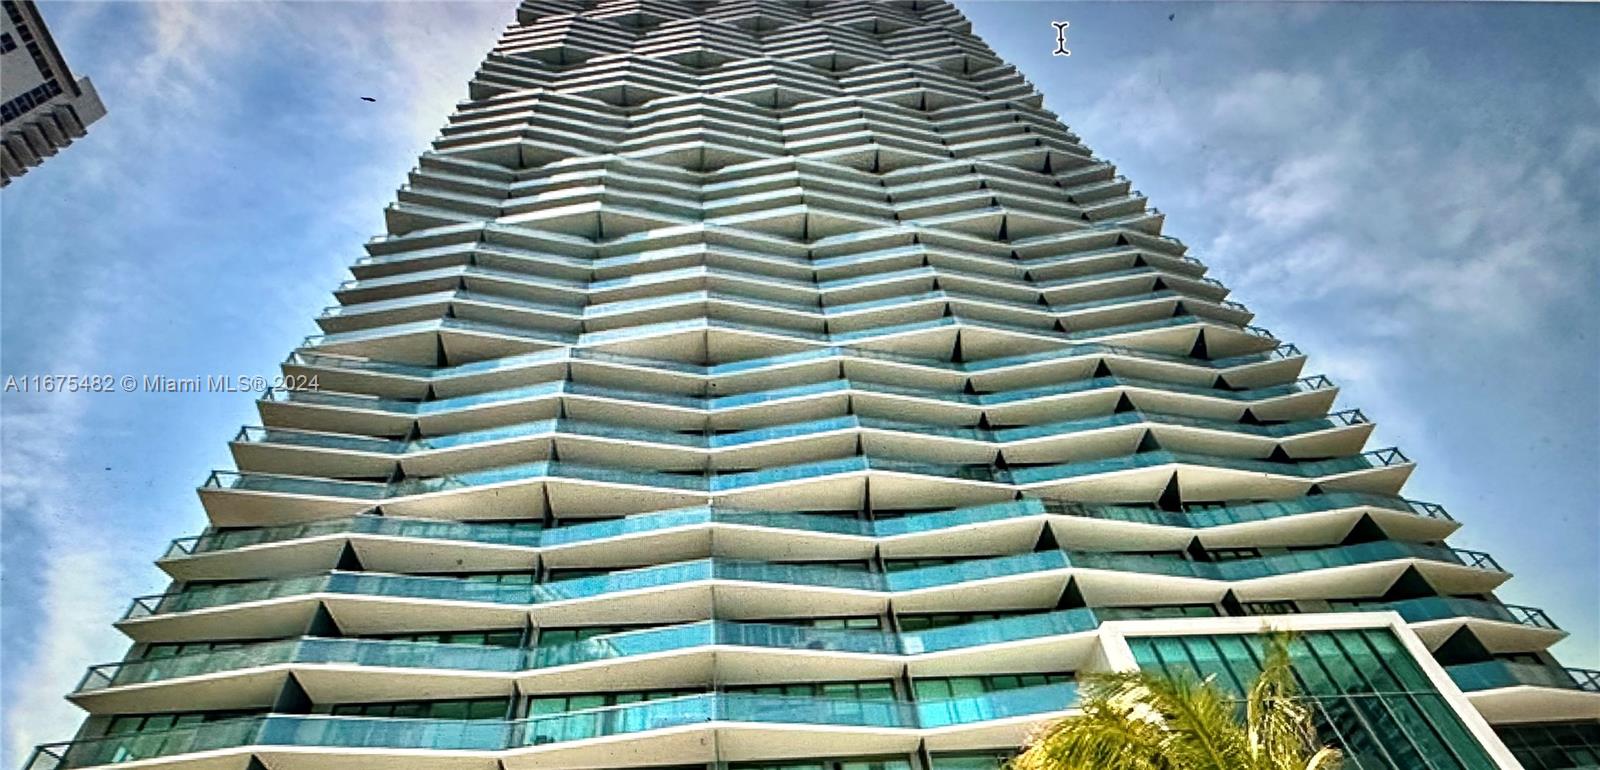
Active
$160,000
1
bds
|
2
ba
|
846
sqft
|
built
1967
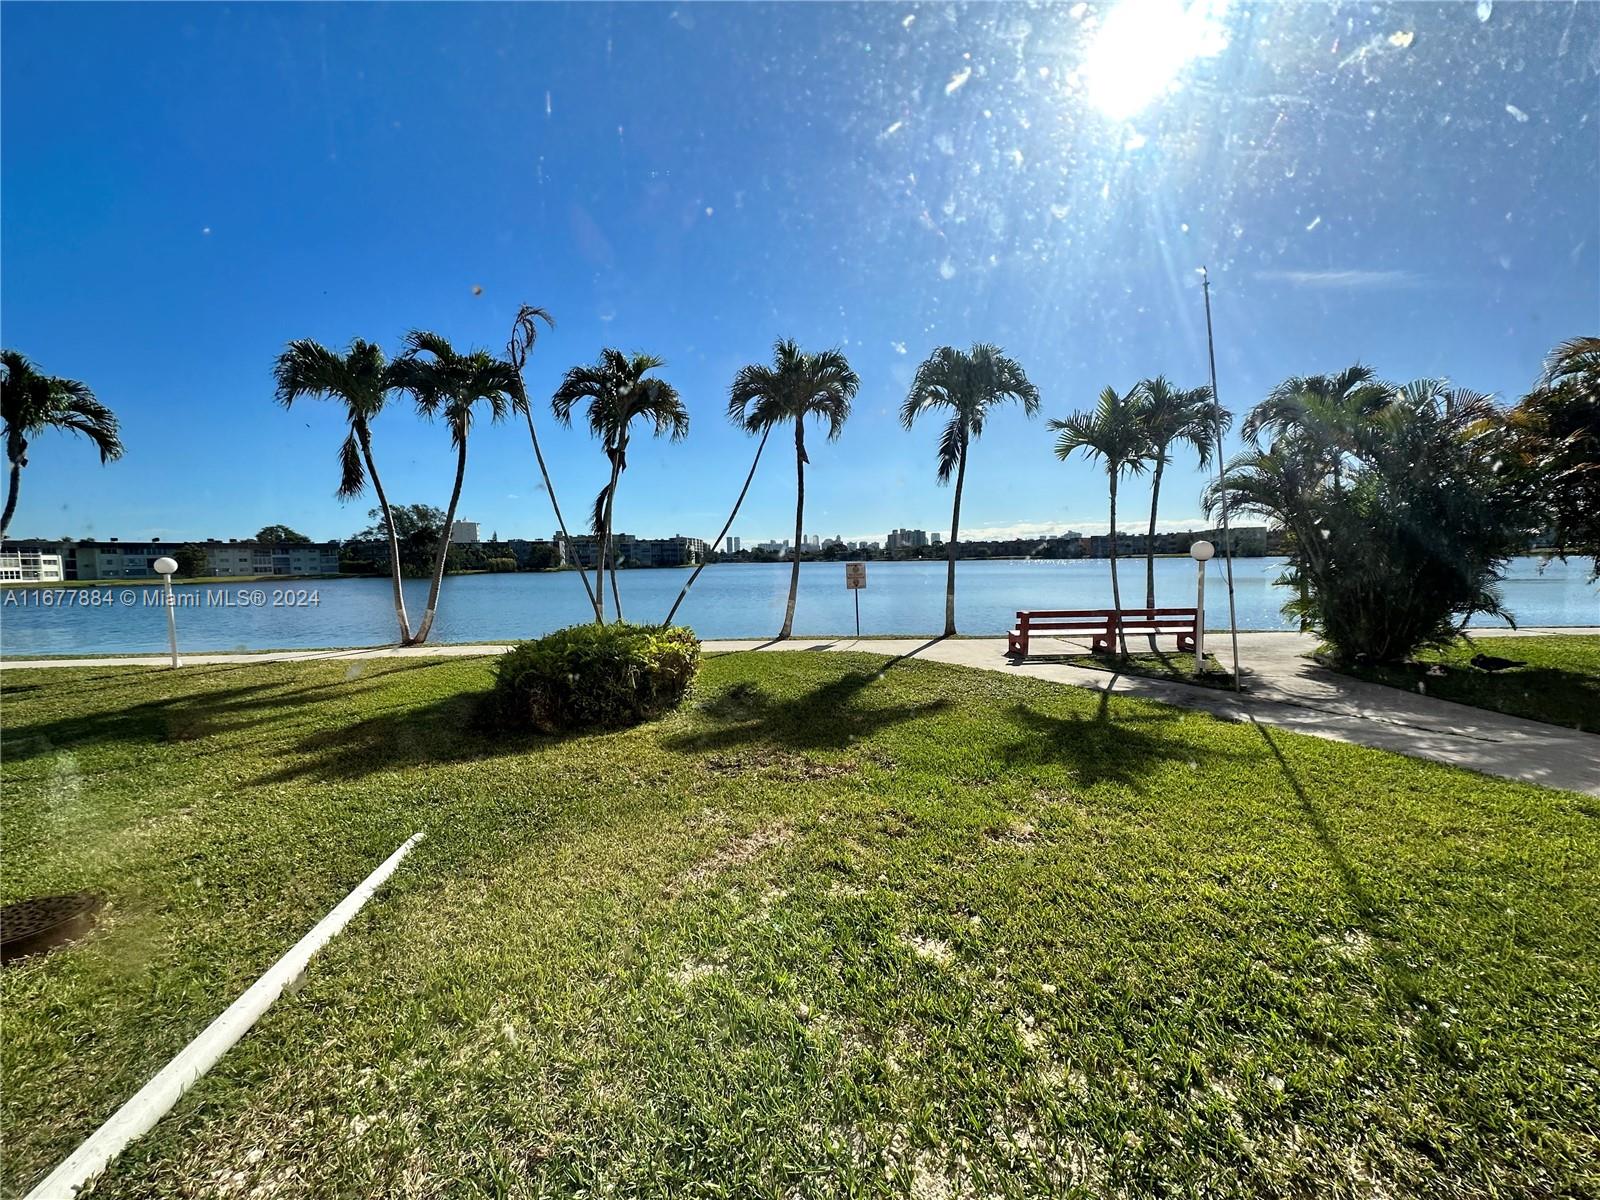
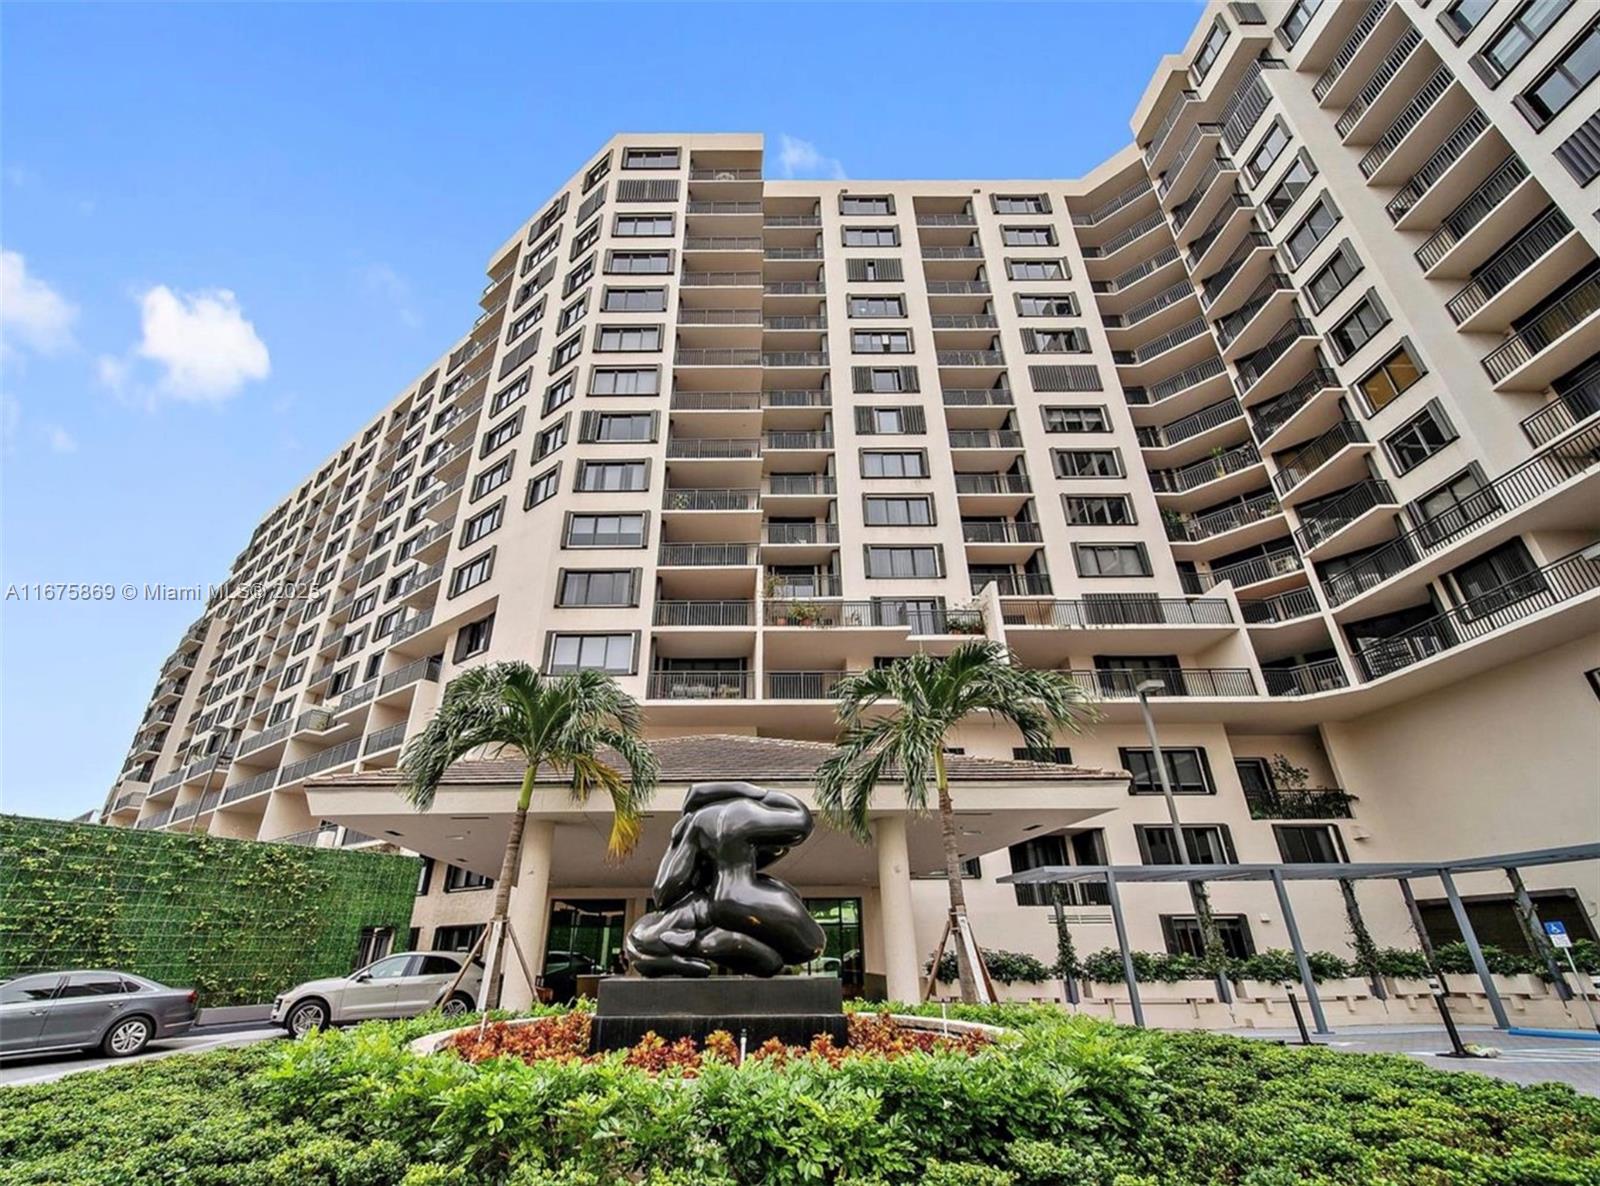
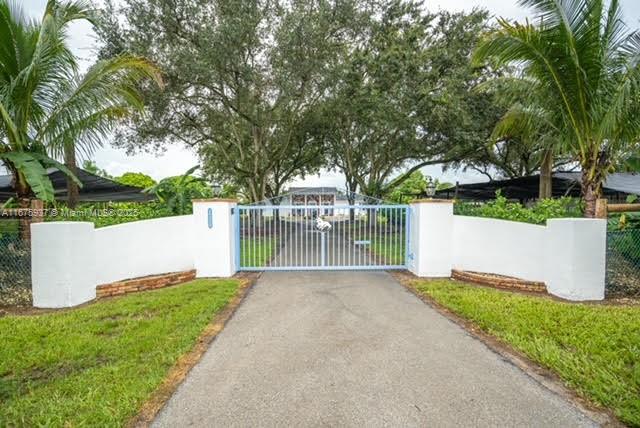
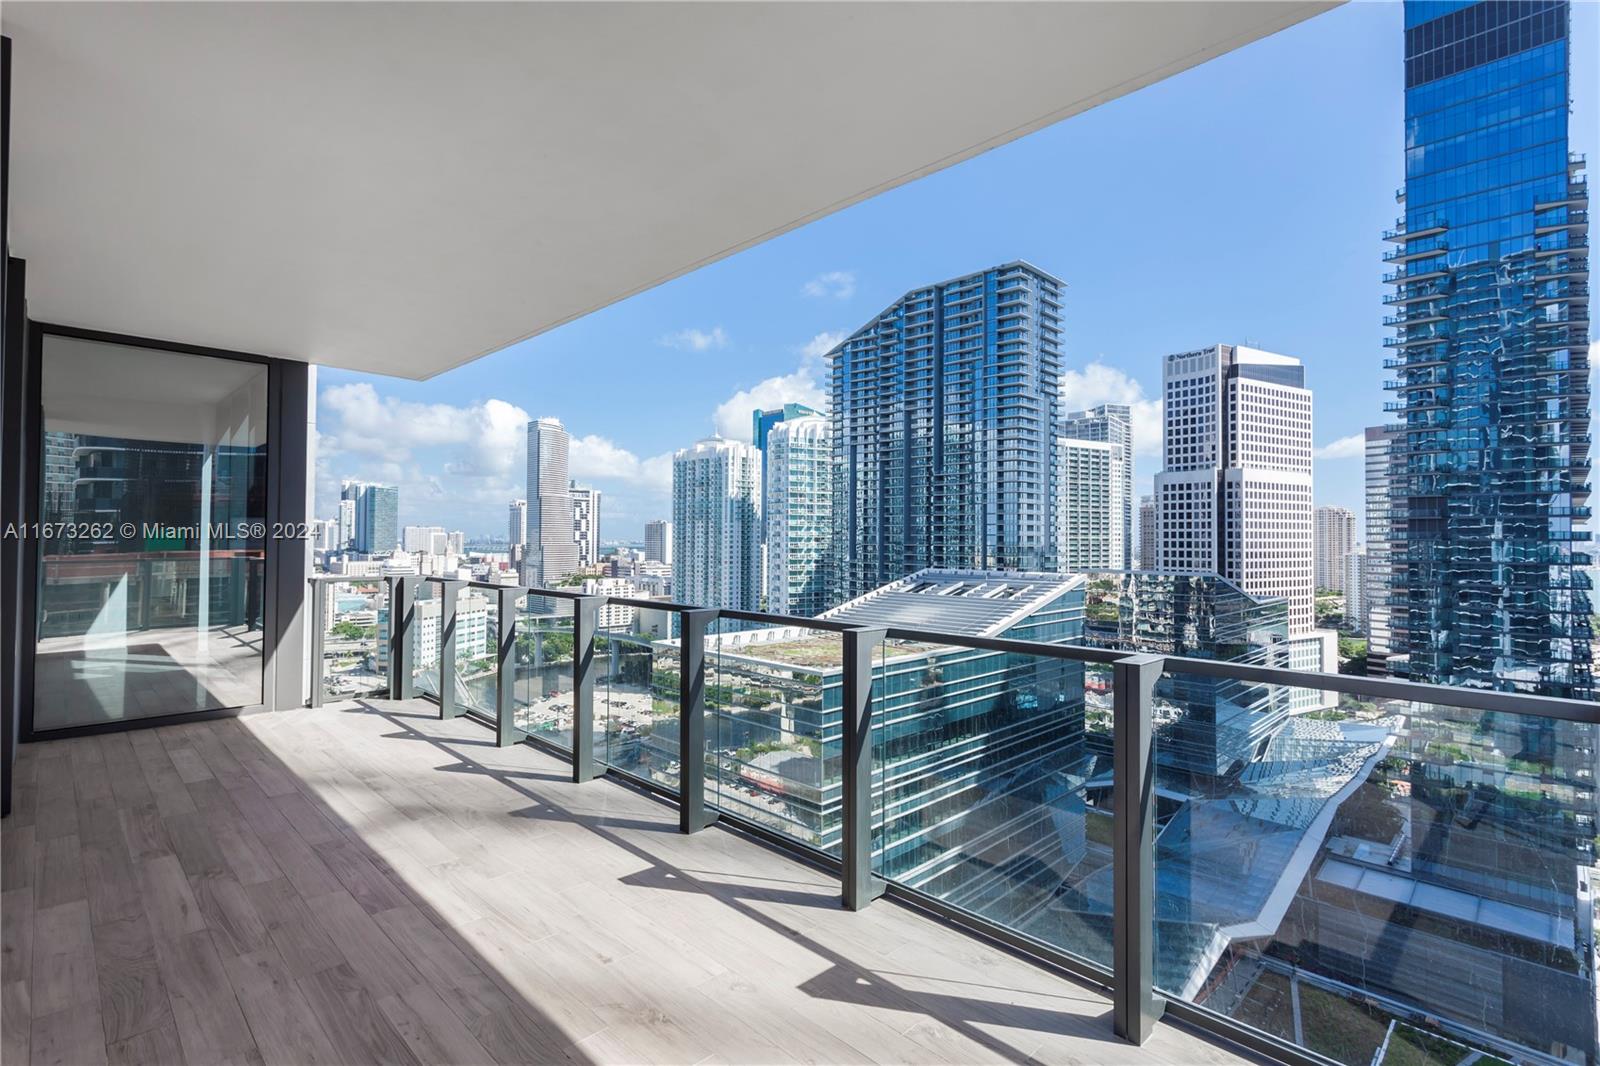
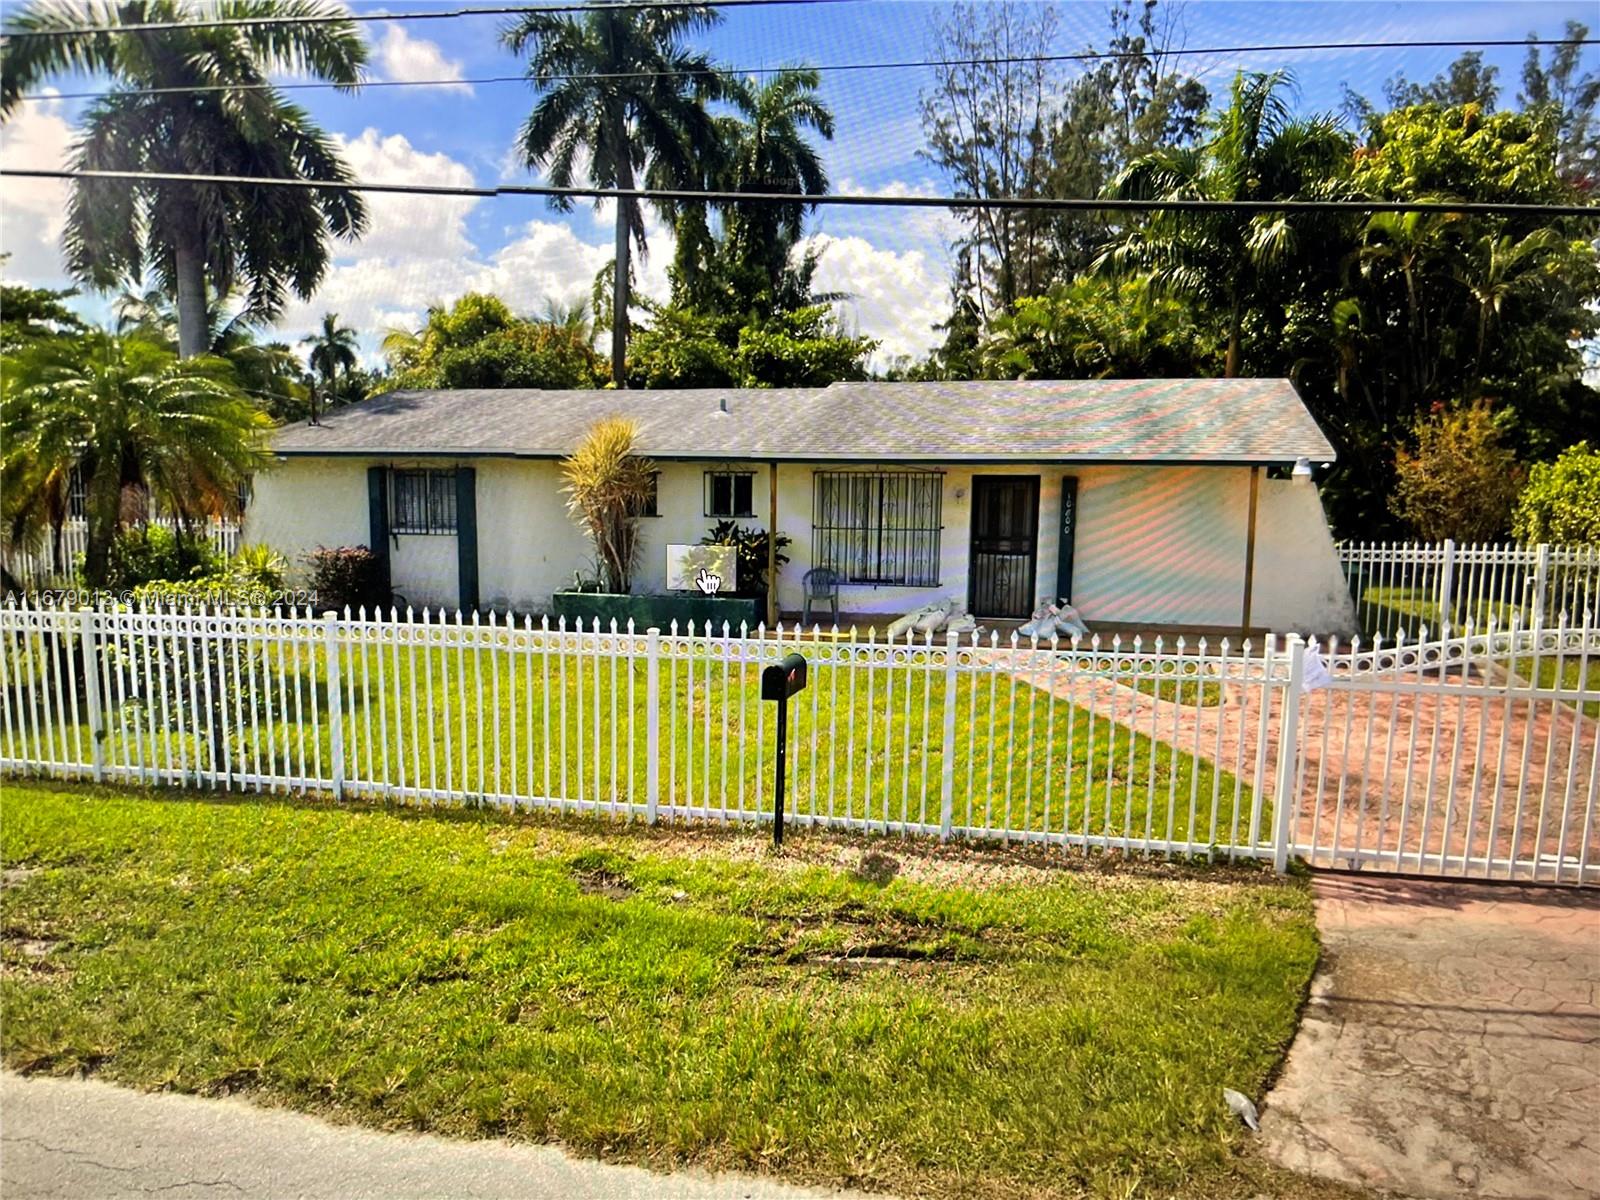
18707 NE 14th Ave, Miami, FL 33179
$187
Cash flow
6.1%
Cash-on-Cash Return
7.7%
Cap rate
1.3%
Rent to Value Ratio

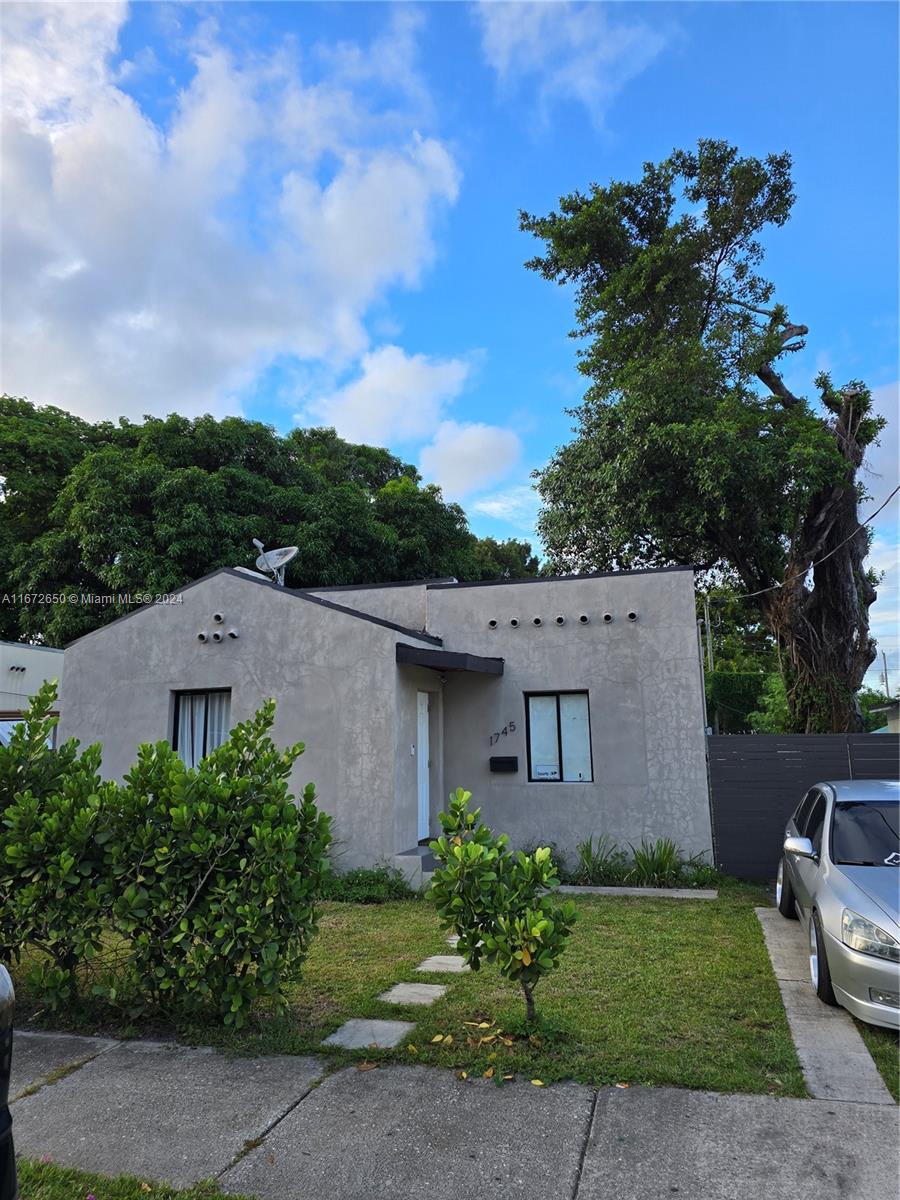
Active
$225,000
2
bds
|
1
ba
|
715
sqft
|
built
1925
1043 NW 2nd St, Miami, FL 33128
$-48
Cash flow
-1.1%
Cash-on-Cash Return
6.0%
Cap rate
1.0%
Rent to Value Ratio
6,163 out of 6,996 properties for sale in Miami, FL
Limited Results Shown
Create a free account, or log in to reveal all property listings and enjoy the complete experience.
Active
$1,250,000
3
bds
|
4
ba
|
1,470
sqft
|
built
2016
1010 SW 2nd Ave, Miami, FL 33130
$-5,182
Cash flow
-21.6%
Cash-on-Cash Return
1.3%
Cap rate
0.5%
Rent to Value Ratio
Active
$570,000
2
bds
|
2
ba
|
1,172
sqft
|
built
2008
90 SW 3rd St, Miami, FL 33130
$-1,735
Cash flow
-15.9%
Cash-on-Cash Return
2.6%
Cap rate
0.8%
Rent to Value Ratio
Active
$475,000
3
bds
|
2
ba
|
1,340
sqft
|
built
1993
12257 SW 144th Ter, Miami, FL 33186
$-618
Cash flow
-6.8%
Cash-on-Cash Return
4.7%
Cap rate
0.7%
Rent to Value Ratio
Active
$425,000
1
bds
|
2
ba
|
800
sqft
|
built
1991
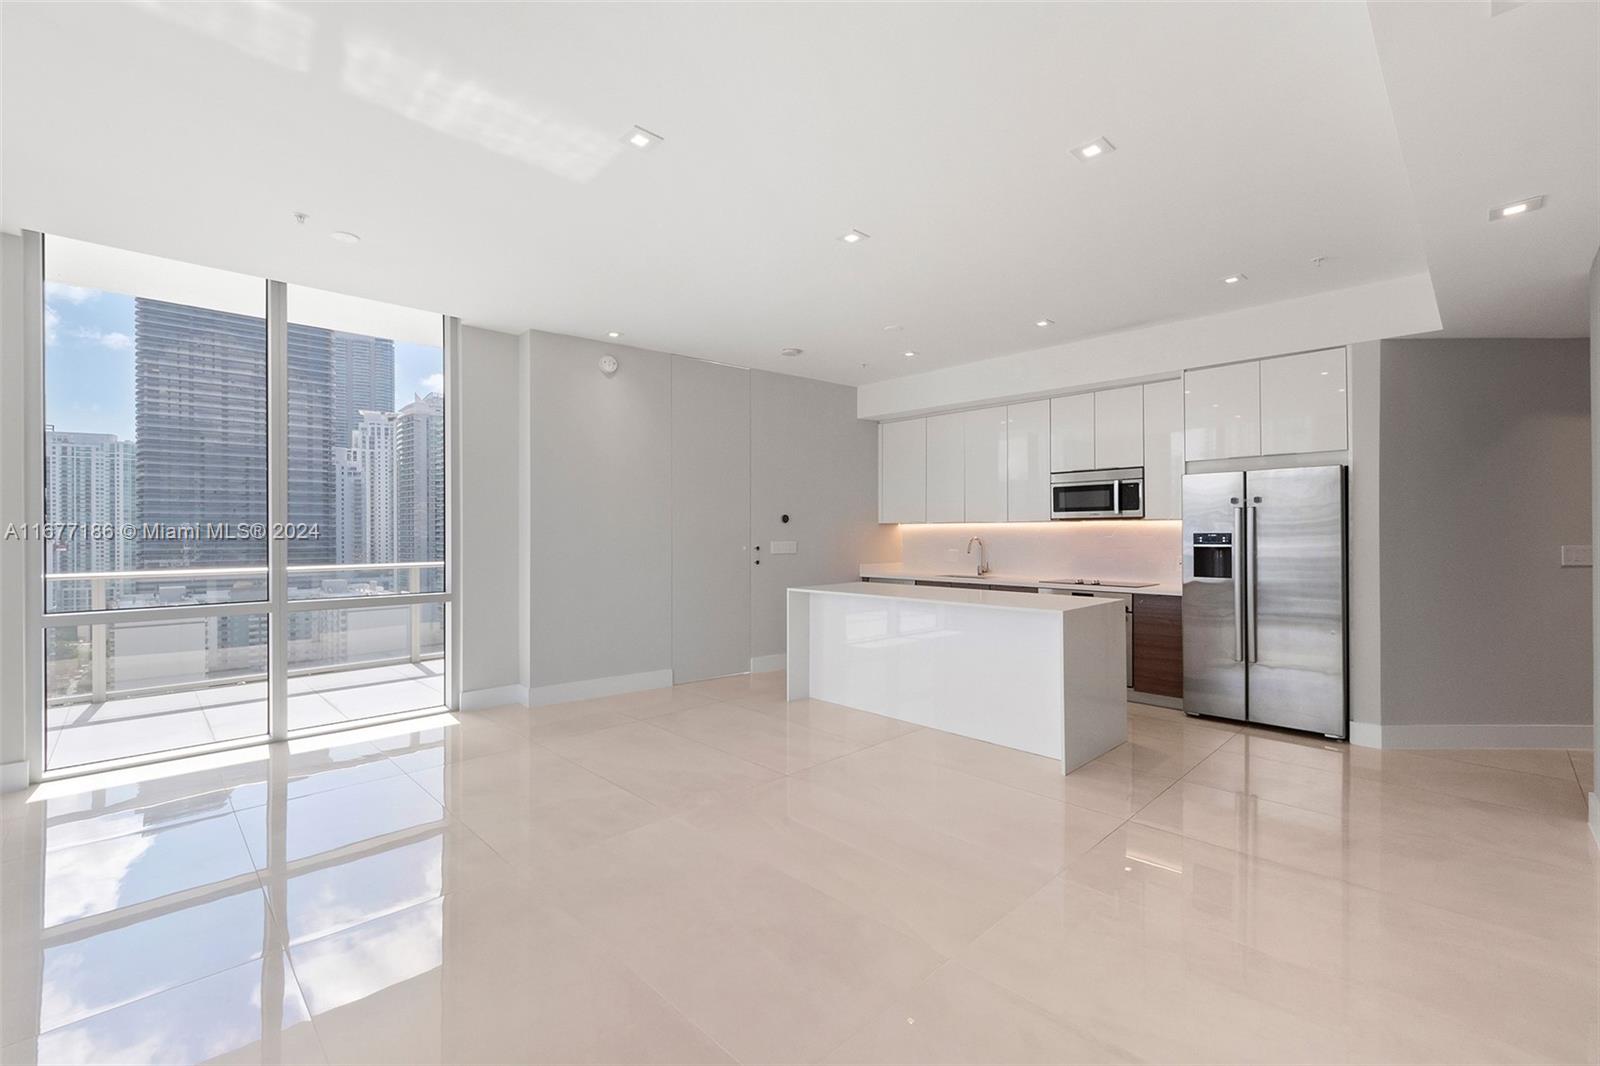
540 Brickell Key Dr, Miami, FL 33131
$-2,040
Cash flow
-25.0%
Cash-on-Cash Return
0.5%
Cap rate
0.6%
Rent to Value Ratio
Active
$745,000
2
bds
|
2
ba
|
1,197
sqft
|
built
2008
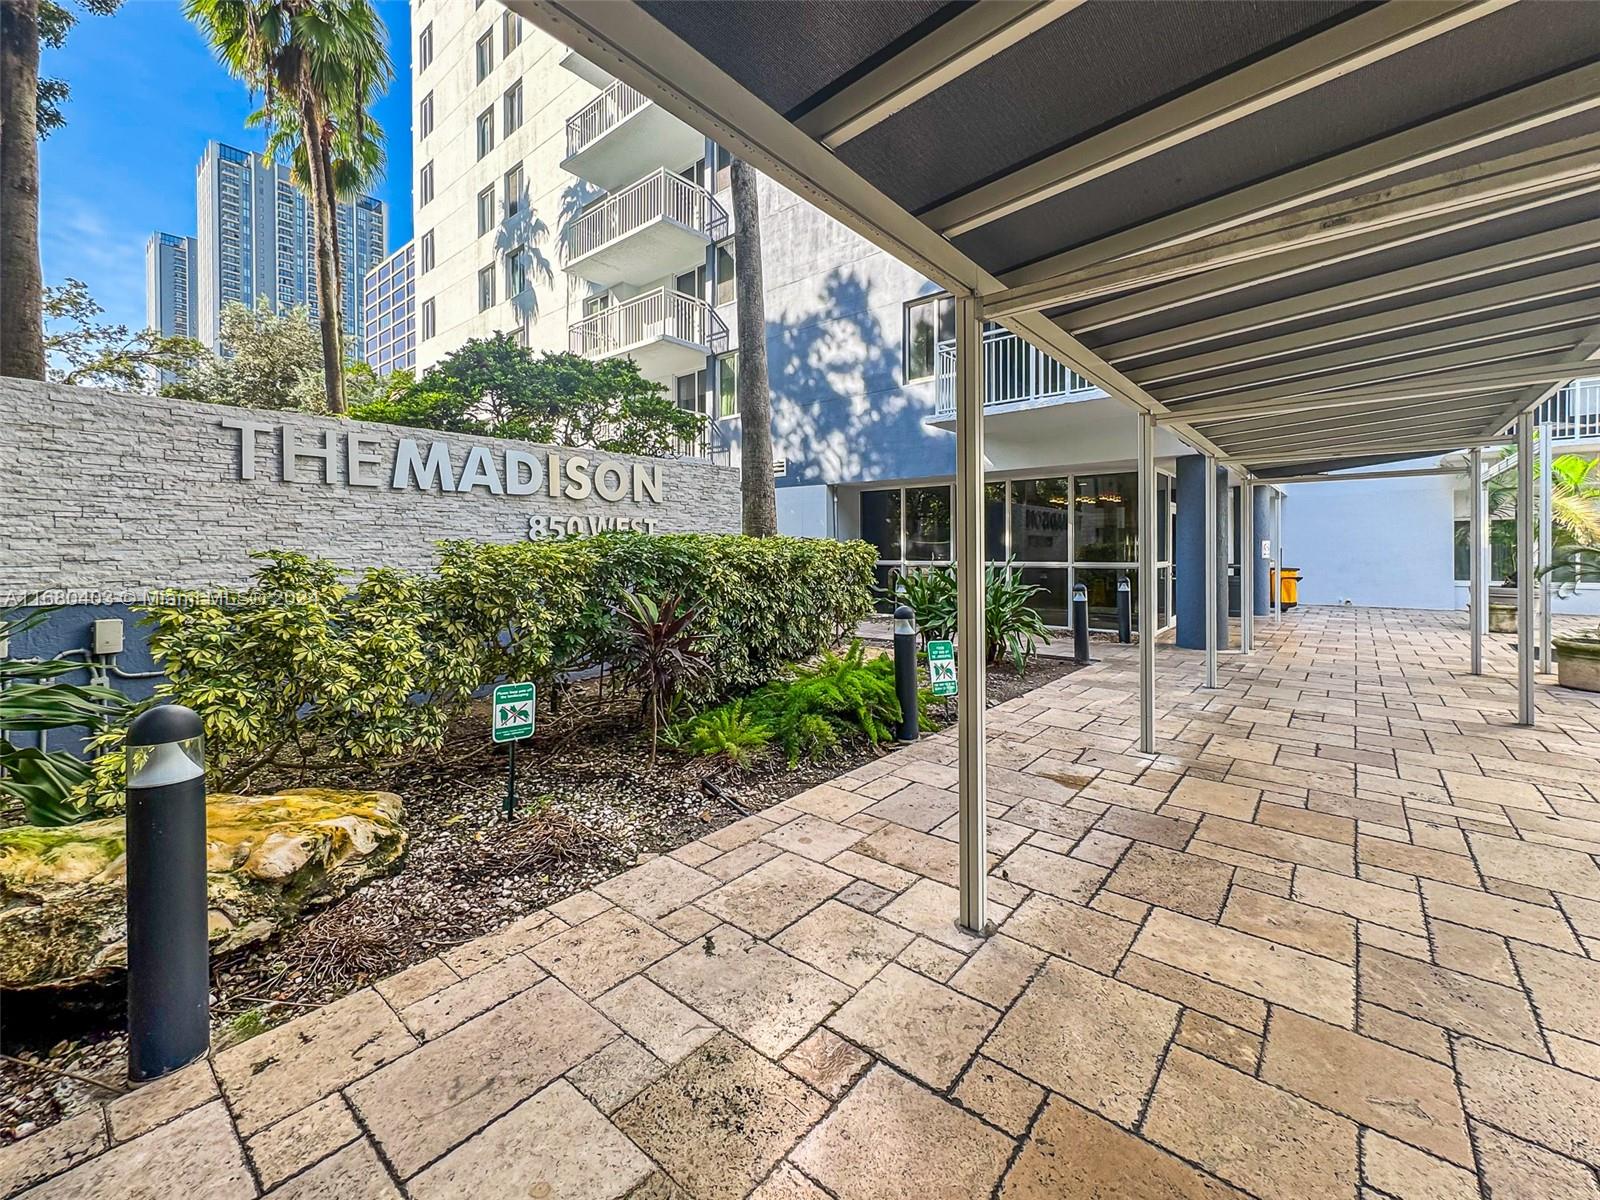
500 Brickell Ave, Miami, FL 33131
$-7,067
Cash flow
-49.5%
Cash-on-Cash Return
-5.1%
Cap rate
0.6%
Rent to Value Ratio
Active
$480,000
2
bds
|
2
ba
|
1,145
sqft
|
built
2003
9021 SW 94th St, Miami, FL 33176
$-1,897
Cash flow
-20.6%
Cash-on-Cash Return
1.5%
Cap rate
0.6%
Rent to Value Ratio
Active
$1,699,000
3
bds
|
4
ba
|
1,698
sqft
|
built
2017
2900 NE 7th Ave, Miami, FL 33137
$-7,458
Cash flow
-22.9%
Cash-on-Cash Return
1.0%
Cap rate
0.5%
Rent to Value Ratio

Active
$600,000
2
bds
|
2
ba
|
1,114
sqft
|
built
2008
90 SW 3rd St, Miami, FL 33130
$-2,513
Cash flow
-21.9%
Cash-on-Cash Return
1.3%
Cap rate
0.6%
Rent to Value Ratio
Active
$1,800,000
3
bds
|
3
ba
|
1,721
sqft
|
built
1968
19390 SW 232nd St, Miami, FL 33170
$-6,572
Cash flow
-19.0%
Cash-on-Cash Return
1.9%
Cap rate
0.4%
Rent to Value Ratio

Active
$805,000
2
bds
|
2
ba
|
970
sqft
|
built
2017
1010 Brickell Ave, Miami, FL 33131
$-2,051
Cash flow
-13.3%
Cash-on-Cash Return
3.2%
Cap rate
0.8%
Rent to Value Ratio
Active
$360,000
2
bds
|
2
ba
|
903
sqft
|
built
1989
850 N Miami Ave, Miami, FL 33136
$-1,245
Cash flow
-18.0%
Cash-on-Cash Return
2.1%
Cap rate
0.8%
Rent to Value Ratio
Active
$1,050,000
5
bds
|
3
ba
|
2,529
sqft
|
built
1961
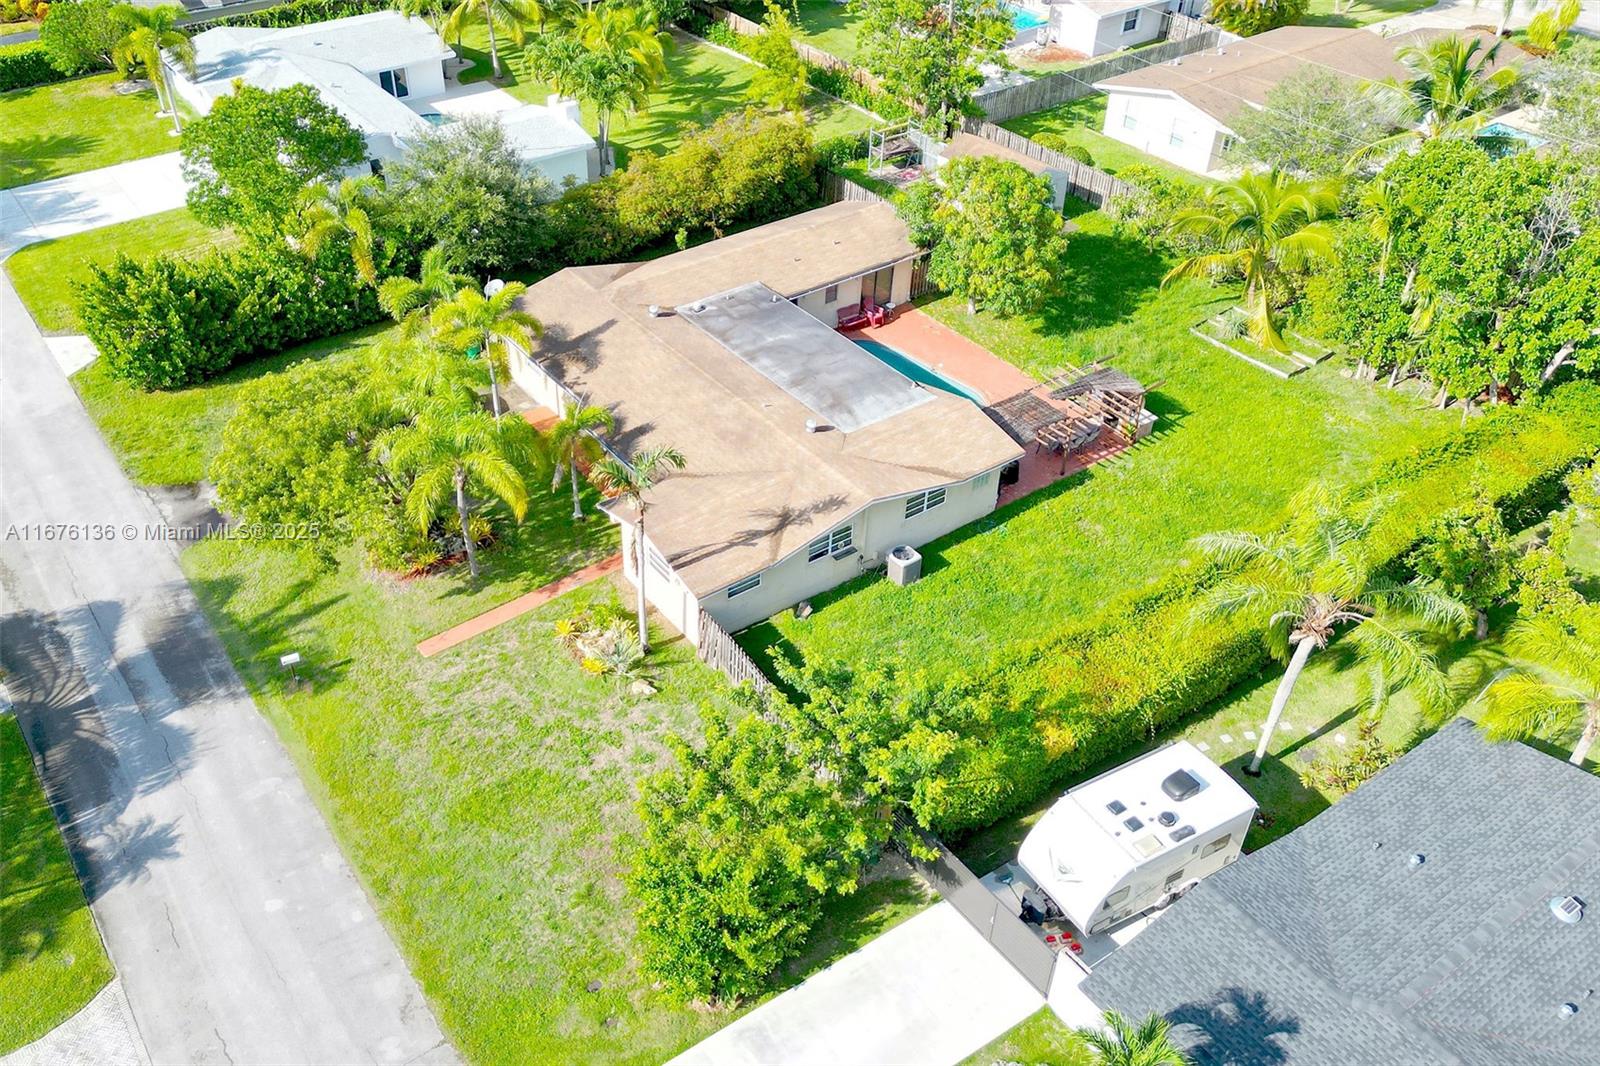
14465 SW 96th Ave, Miami, FL 33176
$-2,967
Cash flow
-14.7%
Cash-on-Cash Return
2.9%
Cap rate
0.5%
Rent to Value Ratio

Active
$480,000
1
bds
|
2
ba
|
746
sqft
|
built
2018
501 NE 31st St, Miami, FL 33137
$-2,015
Cash flow
-21.9%
Cash-on-Cash Return
1.2%
Cap rate
0.6%
Rent to Value Ratio
Active
$995,000
2
bds
|
3
ba
|
1,370
sqft
|
built
2016
88 SW 7th St, Miami, FL 33130
$-4,075
Cash flow
-21.4%
Cash-on-Cash Return
1.4%
Cap rate
0.7%
Rent to Value Ratio
Active
$699,000
2
bds
|
2
ba
|
1,095
sqft
|
built
2015
460 NE 28th St, Miami, FL 33137
$-1,583
Cash flow
-11.8%
Cash-on-Cash Return
3.6%
Cap rate
0.8%
Rent to Value Ratio
Active
$160,000
1
bds
|
2
ba
|
846
sqft
|
built
1967
18707 NE 14th Ave, Miami, FL 33179
$187
Cash flow
6.1%
Cash-on-Cash Return
7.7%
Cap rate
1.3%
Rent to Value Ratio
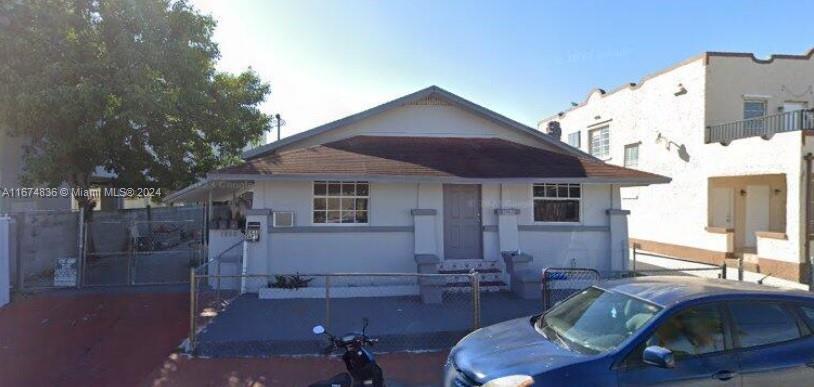
Active
$449,999
3
bds
|
2
ba
|
908
sqft
|
built
1929
1745 NW 49th St, Miami, FL 33142
$-864
Cash flow
-10.0%
Cash-on-Cash Return
4.0%
Cap rate
0.6%
Rent to Value Ratio
Active
$429,900
2
bds
|
2
ba
|
1,185
sqft
|
built
2005
234 NE 3rd St, Miami, FL 33132
$-1,193
Cash flow
-14.5%
Cash-on-Cash Return
3.0%
Cap rate
0.9%
Rent to Value Ratio

Active
$230,000
1
bds
|
1
ba
|
588
sqft
|
built
1989
15551 SW 104th Ter, Miami, FL 33196
$-378
Cash flow
-8.6%
Cash-on-Cash Return
4.3%
Cap rate
0.8%
Rent to Value Ratio
Active
$898,000
4
bds
|
0
ba
|
2,704
sqft
|
built
1920
1838 NW 1st St, Miami, FL 33125
$-3,877
Cash flow
-22.5%
Cash-on-Cash Return
1.1%
Cap rate
0.3%
Rent to Value Ratio
Active
$1,250,000
2
bds
|
3
ba
|
1,270
sqft
|
built
2016
88 SW 7th St, Miami, FL 33130
$-4,992
Cash flow
-20.8%
Cash-on-Cash Return
1.5%
Cap rate
0.5%
Rent to Value Ratio
Active
$759,999
4
bds
|
3
ba
|
2,078
sqft
|
built
1995
9060 SW 168th Ave, Miami, FL 33196
$-585
Cash flow
-4.0%
Cash-on-Cash Return
5.4%
Cap rate
0.7%
Rent to Value Ratio
Active
$1,150,000
2
bds
|
3
ba
|
1,558
sqft
|
built
2005
901 Brickell Key Blvd, Miami, FL 33131
$-4,081
Cash flow
-18.5%
Cash-on-Cash Return
2.0%
Cap rate
0.6%
Rent to Value Ratio
Active
$1,255,000
4
bds
|
3
ba
|
2,502
sqft
|
built
1981
21332 NE 18th Pl, Miami, FL 33179
$-2,770
Cash flow
-11.5%
Cash-on-Cash Return
3.6%
Cap rate
0.6%
Rent to Value Ratio
Active
$615,000
1
bds
|
2
ba
|
866
sqft
|
built
2018
801 S Miami Ave, Miami, FL 33130
$-2,614
Cash flow
-22.2%
Cash-on-Cash Return
1.2%
Cap rate
0.7%
Rent to Value Ratio
Active
$775,000
1
bds
|
2
ba
|
1,294
sqft
|
built
2019
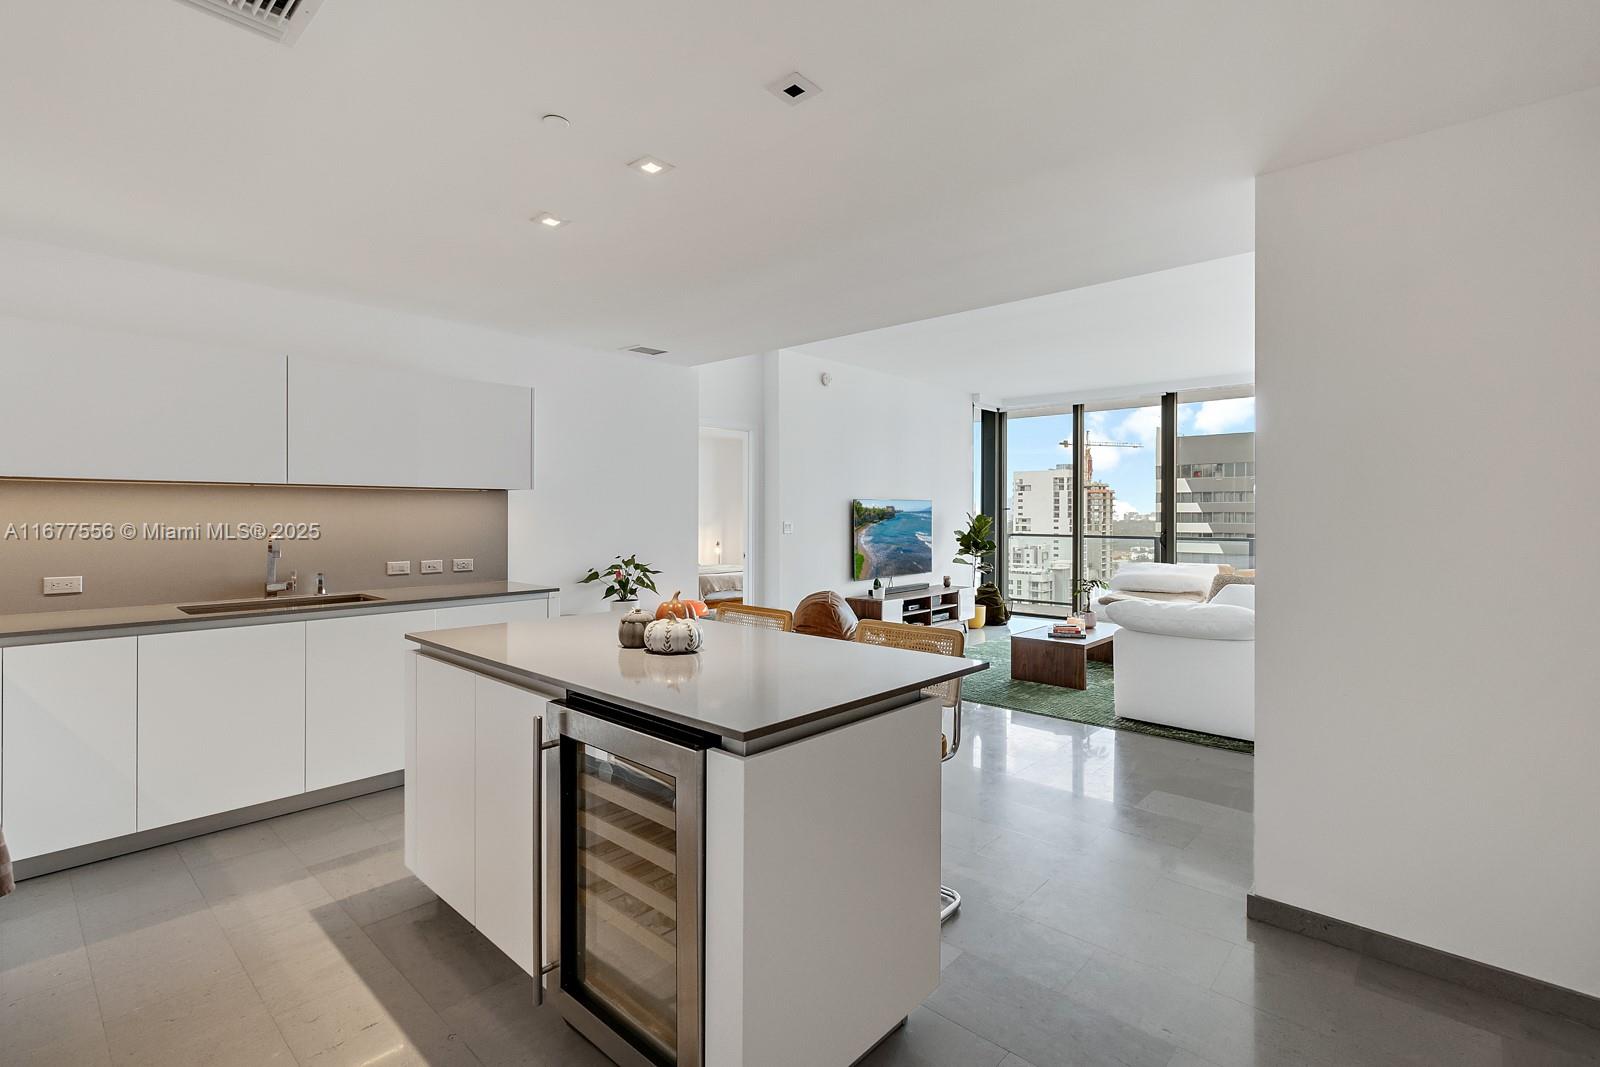
851 NE 1st Ave, Miami, FL 33132
$-2,070
Cash flow
-13.9%
Cash-on-Cash Return
3.1%
Cap rate
0.6%
Rent to Value Ratio
Active
$570,000
1
bds
|
2
ba
|
845
sqft
|
built
2008
888 Biscayne Blvd, Miami, FL 33132
$-1,985
Cash flow
-18.2%
Cash-on-Cash Return
2.1%
Cap rate
0.6%
Rent to Value Ratio
Active
$260,000
1
bds
|
1
ba
|
608
sqft
|
built
1987
670 NW 85th Pl, Miami, FL 33126
$-428
Cash flow
-8.6%
Cash-on-Cash Return
4.3%
Cap rate
0.8%
Rent to Value Ratio

Active
$465,000
2
bds
|
2
ba
|
1,178
sqft
|
built
1930
2320 NW 55th St, Miami, FL 33142
$-154
Cash flow
-1.7%
Cash-on-Cash Return
5.9%
Cap rate
0.8%
Rent to Value Ratio
Active
$650,000
3
bds
|
2
ba
|
1,225
sqft
|
built
1977
10800 NW 18th Ave, Miami, FL 33167
$-1,561
Cash flow
-12.5%
Cash-on-Cash Return
3.4%
Cap rate
0.5%
Rent to Value Ratio

Active
$155,000
1
bds
|
2
ba
|
861
sqft
|
built
1969
1351 NE Miami Gardens Dr, Miami, FL 33179
$-212
Cash flow
-7.1%
Cash-on-Cash Return
4.6%
Cap rate
1.2%
Rent to Value Ratio
Active
$155,000
1
bds
|
1
ba
|
730
sqft
|
built
1970
505 NW 177th St, Miami, FL 33169
$-463
Cash flow
-15.6%
Cash-on-Cash Return
2.7%
Cap rate
1.0%
Rent to Value Ratio
Active
$350,000
bds
|
1
ba
|
580
sqft
|
built
2018
1600 NE 1st Ave, Miami, FL 33132
$-1,203
Cash flow
-17.9%
Cash-on-Cash Return
2.2%
Cap rate
0.7%
Rent to Value Ratio
Active
$649,000
1
bds
|
2
ba
|
944
sqft
|
built
2017
2900 NE 7th Ave, Miami, FL 33137
$-2,728
Cash flow
-21.9%
Cash-on-Cash Return
1.2%
Cap rate
0.6%
Rent to Value Ratio
Active
$589,000
1
bds
|
2
ba
|
713
sqft
|
built
2018
121 NE 34th St, Miami, FL 33137
$-2,541
Cash flow
-22.5%
Cash-on-Cash Return
1.1%
Cap rate
0.6%
Rent to Value Ratio
Active
$359,000
1
bds
|
1
ba
|
710
sqft
|
built
2005
900 SW 8th St, Miami, FL 33130
$-515
Cash flow
-7.5%
Cash-on-Cash Return
4.6%
Cap rate
0.7%
Rent to Value Ratio
Active
$317,000
2
bds
|
2
ba
|
1,262
sqft
|
built
1969
9403 SW 76th St, Miami, FL 33173
$-703
Cash flow
-11.6%
Cash-on-Cash Return
3.6%
Cap rate
0.8%
Rent to Value Ratio

Active
$3,100,000
4
bds
|
5
ba
|
2,743
sqft
|
built
2021
788 NE 23rd St, Miami, FL 33137
$-15,769
Cash flow
-26.5%
Cash-on-Cash Return
0.2%
Cap rate
0.3%
Rent to Value Ratio
Active
$225,000
2
bds
|
1
ba
|
715
sqft
|
built
1925
1043 NW 2nd St, Miami, FL 33128
$-48
Cash flow
-1.1%
Cash-on-Cash Return
6.0%
Cap rate
1.0%
Rent to Value Ratio
Active
$500,000
3
bds
|
1
ba
|
1,120
sqft
|
built
1954
1935 NW 131st St, Miami, FL 33167
$-317
Cash flow
-3.3%
Cash-on-Cash Return
5.5%
Cap rate
0.7%
Rent to Value Ratio