Miami, FL Investment Properties for Sale
Browse homes for sale and investment properties in Miami, FL. Refine your search by price, property type, or more.
Best cash flowing properties in Miami, FL

Active
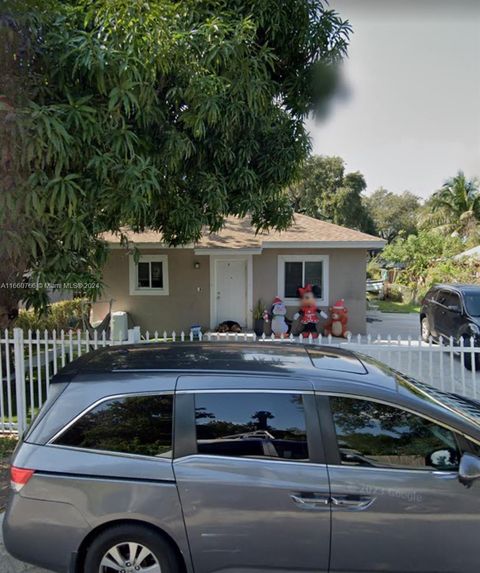
$234,900
1
bds
|
1
ba
|
726
sqft
|
built
1973
900 SW 84th Ave, Miami, FL 33144
$-112
Cash flow
-2.5%
Cash-on-Cash Return
5.6%
Cap rate
0.9%
Rent to Value Ratio
Active
$249,900
2
bds
|
2
ba
|
882
sqft
|
built
1973
5050 NW 7th St, Miami, FL 33126
$-173
Cash flow
-3.6%
Cash-on-Cash Return
5.3%
Cap rate
0.9%
Rent to Value Ratio
6,092 out of 6,920 properties for sale in Miami, FL
Limited Results Shown
Create a free account, or log in to reveal all property listings and enjoy the complete experience.
Active
$2,050,000
3
bds
|
3
ba
|
2,097
sqft
|
built
1958
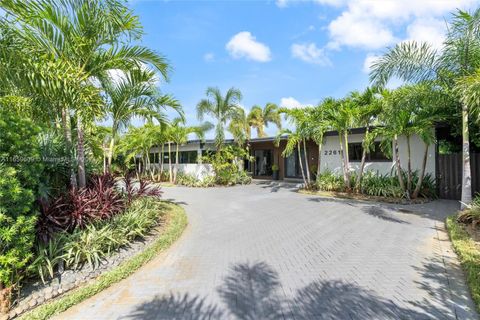
2261 NE 192nd St, Miami, FL 33180
$-5,002
Cash flow
-12.7%
Cash-on-Cash Return
3.2%
Cap rate
0.4%
Rent to Value Ratio
Active
$700,000
1
bds
|
3
ba
|
2,320
sqft
|
built
1975
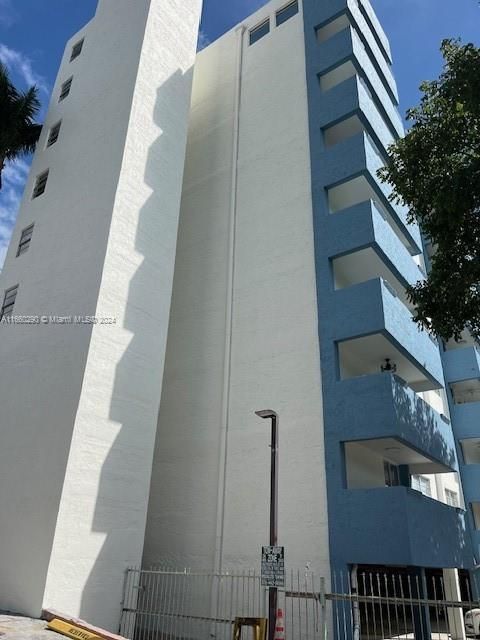
1800 NE 114th St, Miami, FL 33181
$-3,160
Cash flow
-23.6%
Cash-on-Cash Return
0.7%
Cap rate
0.7%
Rent to Value Ratio
Active
$790,000
1
bds
|
2
ba
|
738
sqft
|
built
2017
45 SW 9th St, Miami, FL 33130
$-3,090
Cash flow
-20.4%
Cash-on-Cash Return
1.5%
Cap rate
0.5%
Rent to Value Ratio
Active
$999,999
5
bds
|
4
ba
|
3,415
sqft
|
built
2005
15451 SW 30th St, Miami, FL 33185
$-956
Cash flow
-5.0%
Cash-on-Cash Return
5.0%
Cap rate
0.8%
Rent to Value Ratio

Active under contract
$1,999,000
4
bds
|
3
ba
|
2,837
sqft
|
built
1980
7706 SW 74th Ln, Miami, FL 33143
$-3,903
Cash flow
-10.2%
Cash-on-Cash Return
3.8%
Cap rate
0.5%
Rent to Value Ratio
Active
$650,000
1
bds
|
2
ba
|
866
sqft
|
built
2018
801 S Miami Ave, Miami, FL 33130
$-2,299
Cash flow
-18.5%
Cash-on-Cash Return
1.9%
Cap rate
0.8%
Rent to Value Ratio

Active
$889,000
5
bds
|
3
ba
|
2,417
sqft
|
built
1958
3327 NW 101st St, Miami, FL 33147
$-2,378
Cash flow
-14.0%
Cash-on-Cash Return
2.9%
Cap rate
0.5%
Rent to Value Ratio

Active
$349,500
2
bds
|
2
ba
|
840
sqft
|
built
1987
15235 SW 64th Ter, Miami, FL 33193
$-720
Cash flow
-10.7%
Cash-on-Cash Return
3.7%
Cap rate
0.7%
Rent to Value Ratio

Active
$289,999
2
bds
|
3
ba
|
1,415
sqft
|
built
1972
9371 Fontainebleau Blvd, Miami, FL 33172
$-318
Cash flow
-5.7%
Cash-on-Cash Return
4.8%
Cap rate
0.9%
Rent to Value Ratio

Active
$410,000
bds
|
1
ba
|
446
sqft
|
built
2022
227 NE 2nd St, Miami, FL 33132
$-1,223
Cash flow
-15.6%
Cash-on-Cash Return
2.6%
Cap rate
0.7%
Rent to Value Ratio
Active
$220,000
2
bds
|
3
ba
|
1,950
sqft
|
built
1975
1800 NE 114th St, Miami, FL 33181
$-1,599
Cash flow
-37.9%
Cash-on-Cash Return
-2.6%
Cap rate
1.6%
Rent to Value Ratio

Active
$575,000
6
bds
|
3
ba
|
2,250
sqft
|
built
1970
11836 SW 203rd Ter, Miami, FL 33177
$-896
Cash flow
-8.1%
Cash-on-Cash Return
4.3%
Cap rate
0.6%
Rent to Value Ratio

Active
$1,350,000
4
bds
|
0
ba
|
1,800
sqft
|
built
1948
635 SW 16th Ave, Miami, FL 33135
$-5,503
Cash flow
-21.3%
Cash-on-Cash Return
1.3%
Cap rate
0.3%
Rent to Value Ratio
Active
$1,050,000
2
bds
|
3
ba
|
1,265
sqft
|
built
2016
68 SE 6th St, Miami, FL 33131
$-5,253
Cash flow
-26.1%
Cash-on-Cash Return
0.1%
Cap rate
0.5%
Rent to Value Ratio
Active
$390,000
bds
|
1
ba
|
551
sqft
|
built
2008
1060 Brickell Ave, Miami, FL 33131
$-1,407
Cash flow
-18.8%
Cash-on-Cash Return
1.8%
Cap rate
0.6%
Rent to Value Ratio

Active
$514,000
1
bds
|
1
ba
|
755
sqft
|
built
2007
3250 NE 1st Ave, Miami, FL 33137
$-1,886
Cash flow
-19.1%
Cash-on-Cash Return
1.7%
Cap rate
0.7%
Rent to Value Ratio

Active
$190,000
1
bds
|
2
ba
|
861
sqft
|
built
1968
1301 NE Miami Gardens Dr, Miami, FL 33179
$-384
Cash flow
-10.5%
Cash-on-Cash Return
3.7%
Cap rate
0.9%
Rent to Value Ratio

Active
$628,000
2
bds
|
2
ba
|
1,129
sqft
|
built
2008
90 SW 3rd St, Miami, FL 33130
$-2,181
Cash flow
-18.1%
Cash-on-Cash Return
2.0%
Cap rate
0.6%
Rent to Value Ratio
Active
$710,000
3
bds
|
2
ba
|
1,222
sqft
|
built
1979
11921 SW 122nd Ave, Miami, FL 33186
$-1,084
Cash flow
-8.0%
Cash-on-Cash Return
4.3%
Cap rate
0.5%
Rent to Value Ratio
Active
$330,000
2
bds
|
2
ba
|
1,170
sqft
|
built
1983
1350 SW 122nd Ave, Miami, FL 33184
$-489
Cash flow
-7.7%
Cash-on-Cash Return
4.4%
Cap rate
0.8%
Rent to Value Ratio
Active
$670,000
2
bds
|
2
ba
|
1,214
sqft
|
built
1982
520 Brickell Key Dr, Miami, FL 33131
$-2,558
Cash flow
-19.9%
Cash-on-Cash Return
1.6%
Cap rate
0.7%
Rent to Value Ratio
Active
$460,000
4
bds
|
2
ba
|
1,400
sqft
|
built
2020
8020 NW 9th Ave, Miami, FL 33150
$-557
Cash flow
-6.3%
Cash-on-Cash Return
4.7%
Cap rate
0.7%
Rent to Value Ratio

Active
$2,225,000
4
bds
|
5
ba
|
1,871
sqft
|
built
2019
480 NE 31st St, Miami, FL 33137
$-8,423
Cash flow
-19.8%
Cash-on-Cash Return
1.6%
Cap rate
0.5%
Rent to Value Ratio
Active
$249,900
2
bds
|
2
ba
|
882
sqft
|
built
1973
5050 NW 7th St, Miami, FL 33126
$-173
Cash flow
-3.6%
Cash-on-Cash Return
5.3%
Cap rate
0.9%
Rent to Value Ratio
Active
$234,900
1
bds
|
1
ba
|
726
sqft
|
built
1973
900 SW 84th Ave, Miami, FL 33144
$-112
Cash flow
-2.5%
Cash-on-Cash Return
5.6%
Cap rate
0.9%
Rent to Value Ratio

Active
$1,190,000
2
bds
|
3
ba
|
1,202
sqft
|
built
2016
88 SW 7th St, Miami, FL 33130
$-4,322
Cash flow
-18.9%
Cash-on-Cash Return
1.8%
Cap rate
0.6%
Rent to Value Ratio
Active
$1,250,000
1
bds
|
2
ba
|
1,022
sqft
|
built
2019
1000 Brickell Ave, Miami, FL 33131
$-5,293
Cash flow
-22.1%
Cash-on-Cash Return
1.1%
Cap rate
0.4%
Rent to Value Ratio

Pending
$755,000
4
bds
|
3
ba
|
2,060
sqft
|
built
2002
14028 SW 156th Ave, Miami, FL 33196
$-1,757
Cash flow
-12.1%
Cash-on-Cash Return
3.4%
Cap rate
0.5%
Rent to Value Ratio

Active
$829,990
6
bds
|
0
ba
|
2,300
sqft
|
built
2004
1330 NE 117th Ter, Miami, FL 33161
$-3,063
Cash flow
-19.3%
Cash-on-Cash Return
1.7%
Cap rate
0.3%
Rent to Value Ratio
Active
$1,890,000
2
bds
|
3
ba
|
1,747
sqft
|
built
2003
1435 Brickell Ave, Miami, FL 33131
$-9,281
Cash flow
-25.6%
Cash-on-Cash Return
0.3%
Cap rate
0.4%
Rent to Value Ratio

Active
$359,000
2
bds
|
2
ba
|
848
sqft
|
built
1989
850 N Miami Ave, Miami, FL 33136
$-1,245
Cash flow
-18.1%
Cash-on-Cash Return
2.0%
Cap rate
0.8%
Rent to Value Ratio

Active
$850,000
4
bds
|
3
ba
|
1,554
sqft
|
built
1957
685 NE 172nd St, Miami, FL 33162
$-1,478
Cash flow
-9.1%
Cash-on-Cash Return
4.1%
Cap rate
0.6%
Rent to Value Ratio

Active
$715,000
2
bds
|
3
ba
|
1,123
sqft
|
built
2007
1040 Biscayne Blvd, Miami, FL 33132
$-3,312
Cash flow
-24.2%
Cash-on-Cash Return
0.6%
Cap rate
0.6%
Rent to Value Ratio

Active
$830,000
3
bds
|
2
ba
|
1,373
sqft
|
built
1955
650 NE 178th St, Miami, FL 33162
$-2,438
Cash flow
-15.3%
Cash-on-Cash Return
2.6%
Cap rate
0.5%
Rent to Value Ratio
Active
$545,000
2
bds
|
2
ba
|
1,049
sqft
|
built
2004
2000 N Bayshore Dr, Miami, FL 33137
$-2,150
Cash flow
-20.6%
Cash-on-Cash Return
1.4%
Cap rate
0.6%
Rent to Value Ratio

Active
$3,250,000
5
bds
|
4
ba
|
3,702
sqft
|
built
2007
433 NW 127th Ave, Miami, FL 33182
$-10,536
Cash flow
-16.9%
Cash-on-Cash Return
2.3%
Cap rate
0.3%
Rent to Value Ratio

Active
$2,675,000
4
bds
|
4
ba
|
4,849
sqft
|
built
1979
4020 SW 129th Ave, Miami, FL 33175
$-8,219
Cash flow
-16.0%
Cash-on-Cash Return
2.5%
Cap rate
0.4%
Rent to Value Ratio

Active
$400,000
bds
|
1
ba
|
638
sqft
|
built
2006
690 SW 1st Ct, Miami, FL 33130
$-539
Cash flow
-7.0%
Cash-on-Cash Return
4.5%
Cap rate
0.7%
Rent to Value Ratio

Active
$595,000
2
bds
|
2
ba
|
1,560
sqft
|
built
1984
20281 E Country Club Dr, Miami, FL 33180
$-992
Cash flow
-8.7%
Cash-on-Cash Return
4.1%
Cap rate
0.7%
Rent to Value Ratio

Active
$775,000
4
bds
|
2
ba
|
1,057
sqft
|
built
1951
280 NW 51st St, Miami, FL 33127
$-1,955
Cash flow
-13.2%
Cash-on-Cash Return
3.1%
Cap rate
0.5%
Rent to Value Ratio