Miami, FL Investment Properties for Sale
Browse homes for sale and investment properties in Miami, FL. Refine your search by price, property type, or more.
Best cash flowing properties in Miami, FL
Active
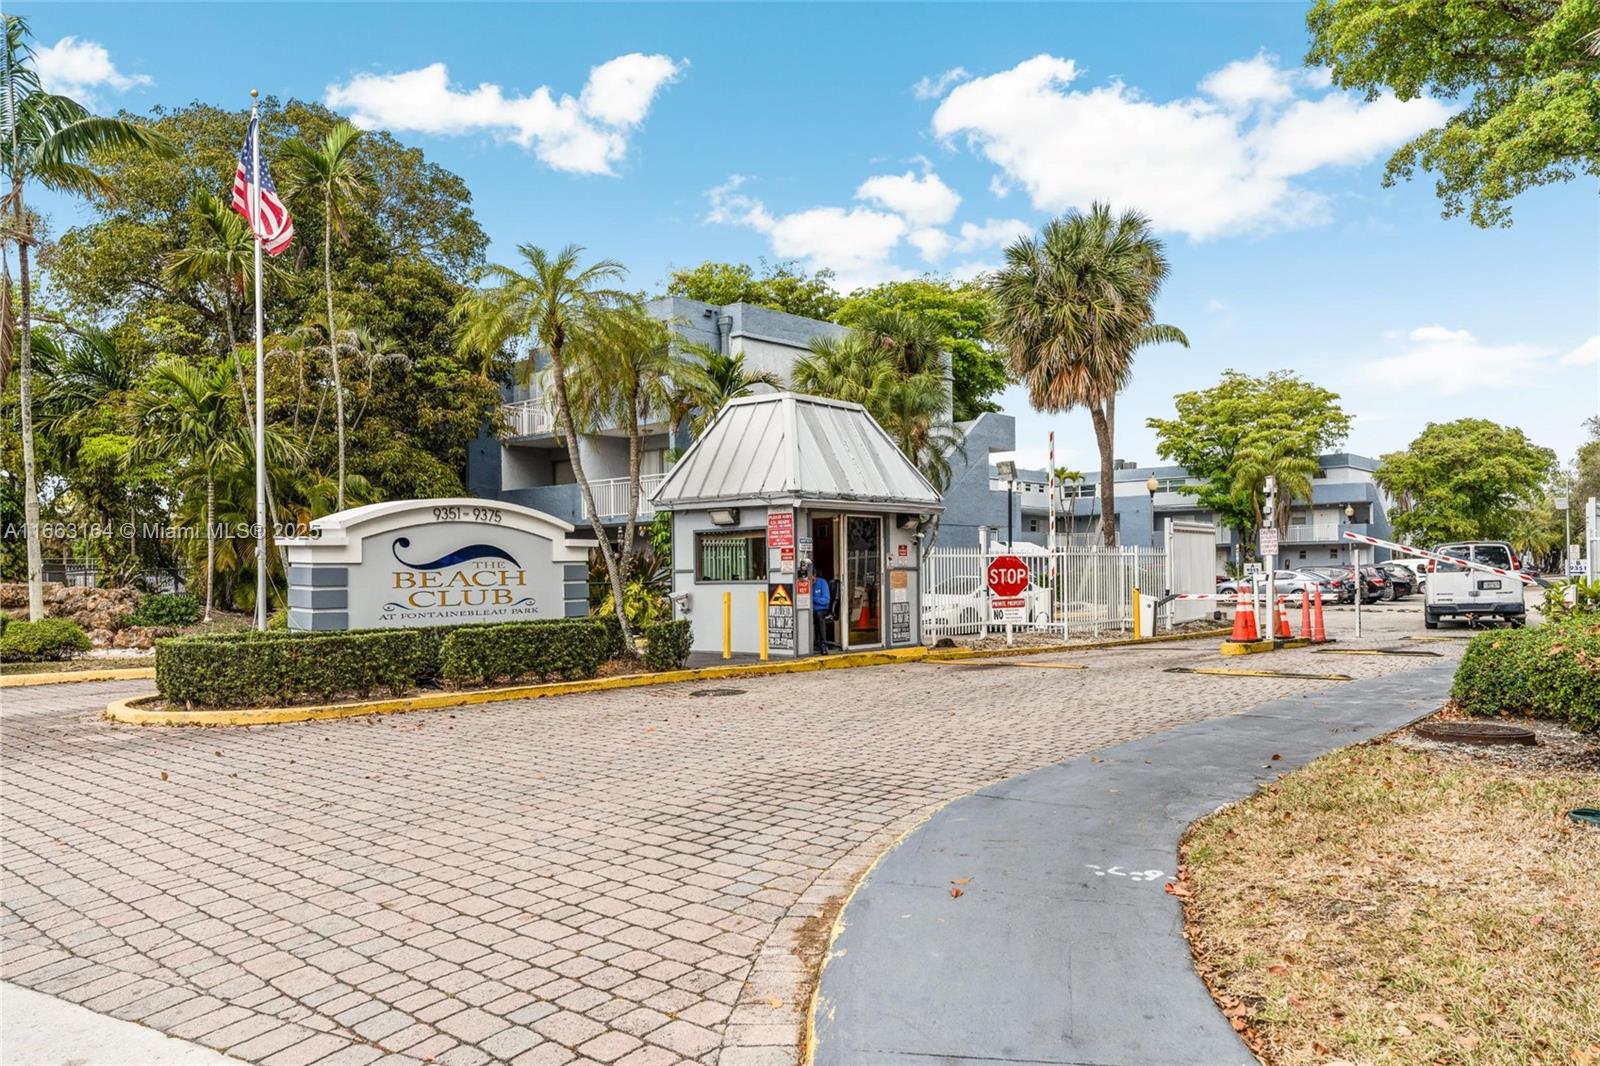
$289,999
2
bds
|
3
ba
|
1,415
sqft
|
built
1972
9371 Fontainebleau Blvd, Miami, FL 33172
$-318
Cash flow
-5.7%
Cash-on-Cash Return
4.8%
Cap rate
0.9%
Rent to Value Ratio

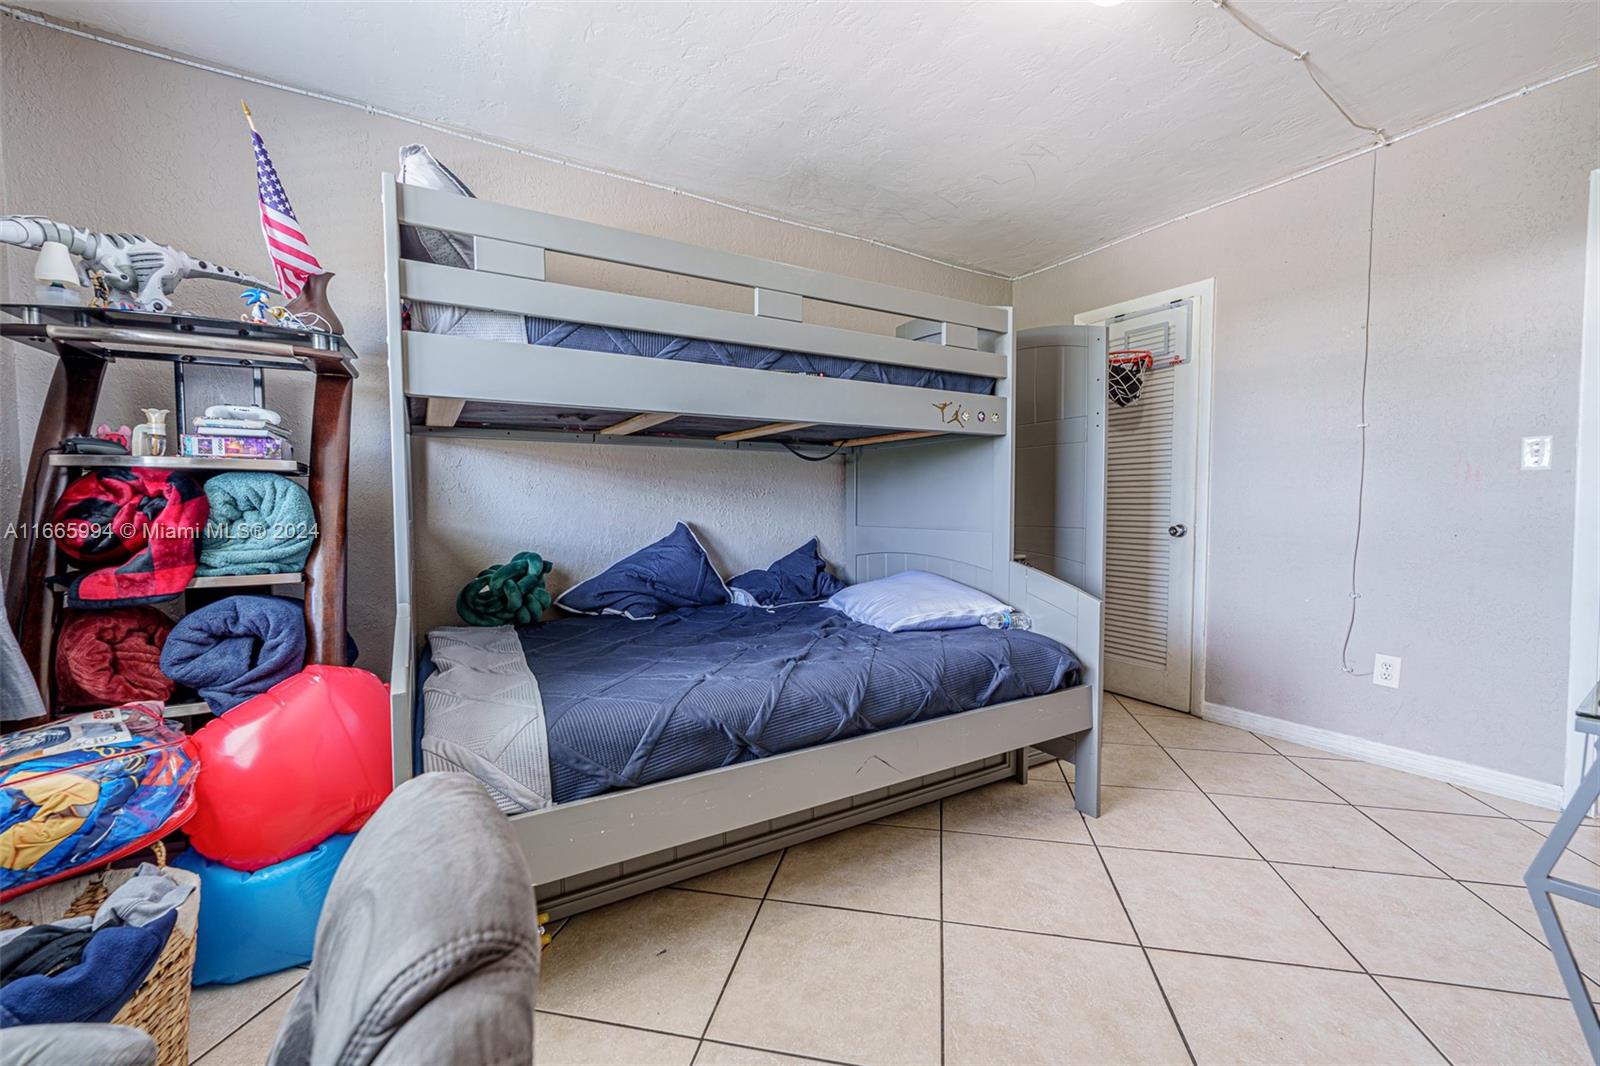
Active
$190,000
1
bds
|
2
ba
|
861
sqft
|
built
1968
1301 NE Miami Gardens Dr, Miami, FL 33179
$-384
Cash flow
-10.5%
Cash-on-Cash Return
3.7%
Cap rate
0.9%
Rent to Value Ratio
6,163 out of 6,996 properties for sale in Miami, FL
Limited Results Shown
Create a free account, or log in to reveal all property listings and enjoy the complete experience.
Active
$355,000
3
bds
|
2
ba
|
0
sqft
|
built
1981
8600 SW 133rd Avenue Rd, Miami, FL 33183
$-621
Cash flow
-9.1%
Cash-on-Cash Return
4.0%
Cap rate
0.8%
Rent to Value Ratio
Active
$260,000
1
bds
|
1
ba
|
611
sqft
|
built
1971
2496 SW 17th Ave, Miami, FL 33145
$-391
Cash flow
-7.8%
Cash-on-Cash Return
4.3%
Cap rate
0.8%
Rent to Value Ratio
Active
$839,000
3
bds
|
3
ba
|
1,432
sqft
|
built
2015
600 NE 27th St, Miami, FL 33137
$-2,400
Cash flow
-14.9%
Cash-on-Cash Return
2.7%
Cap rate
0.7%
Rent to Value Ratio
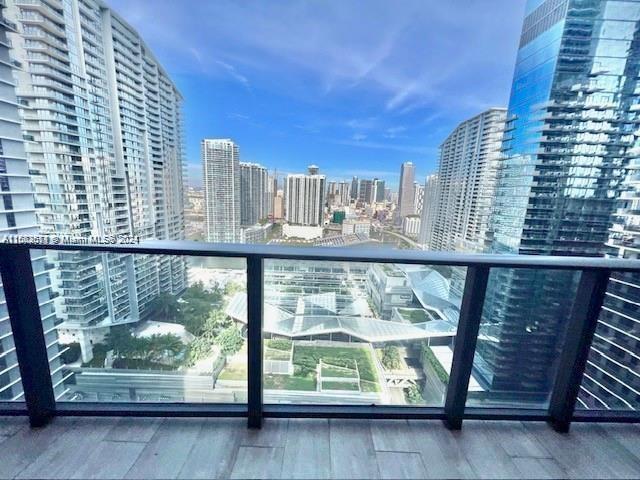
Active
$618,000
1
bds
|
1
ba
|
816
sqft
|
built
2008
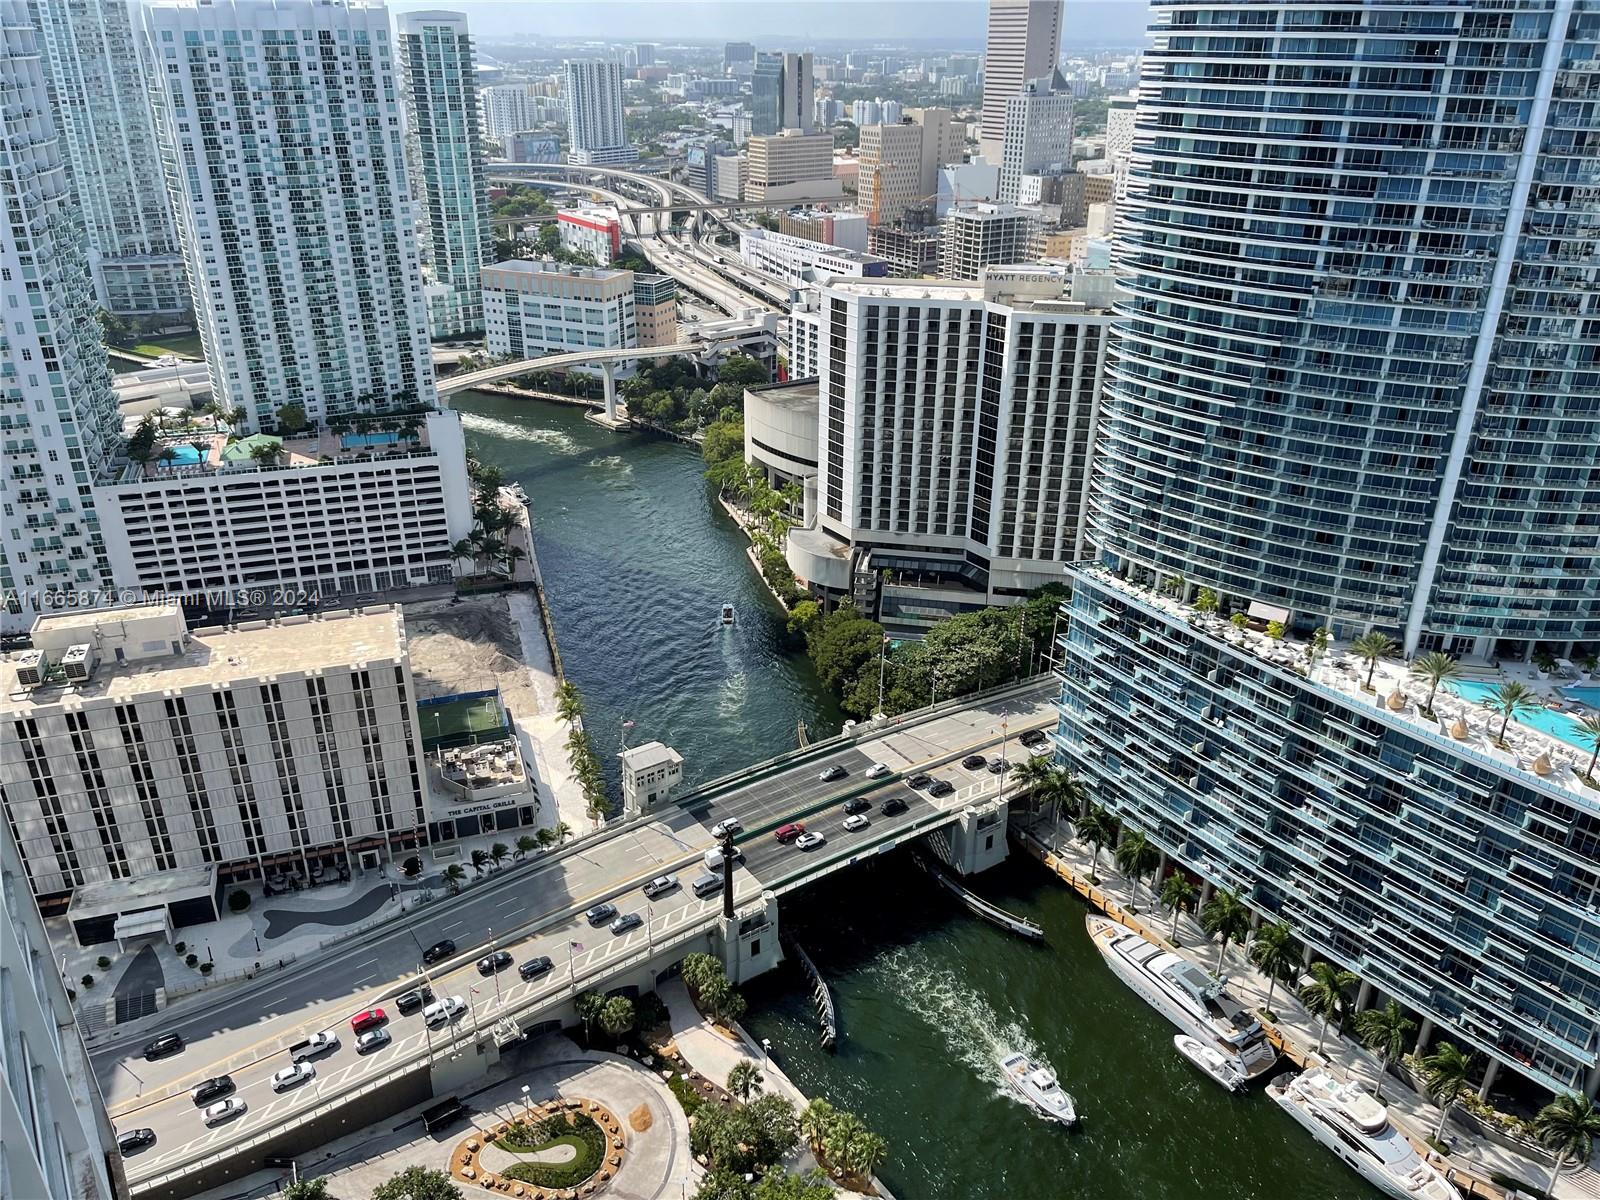
465 Brickell Ave, Miami, FL 33131
$-1,690
Cash flow
-14.3%
Cash-on-Cash Return
2.9%
Cap rate
0.7%
Rent to Value Ratio
Active
$250,000
1
bds
|
1
ba
|
718
sqft
|
built
2007
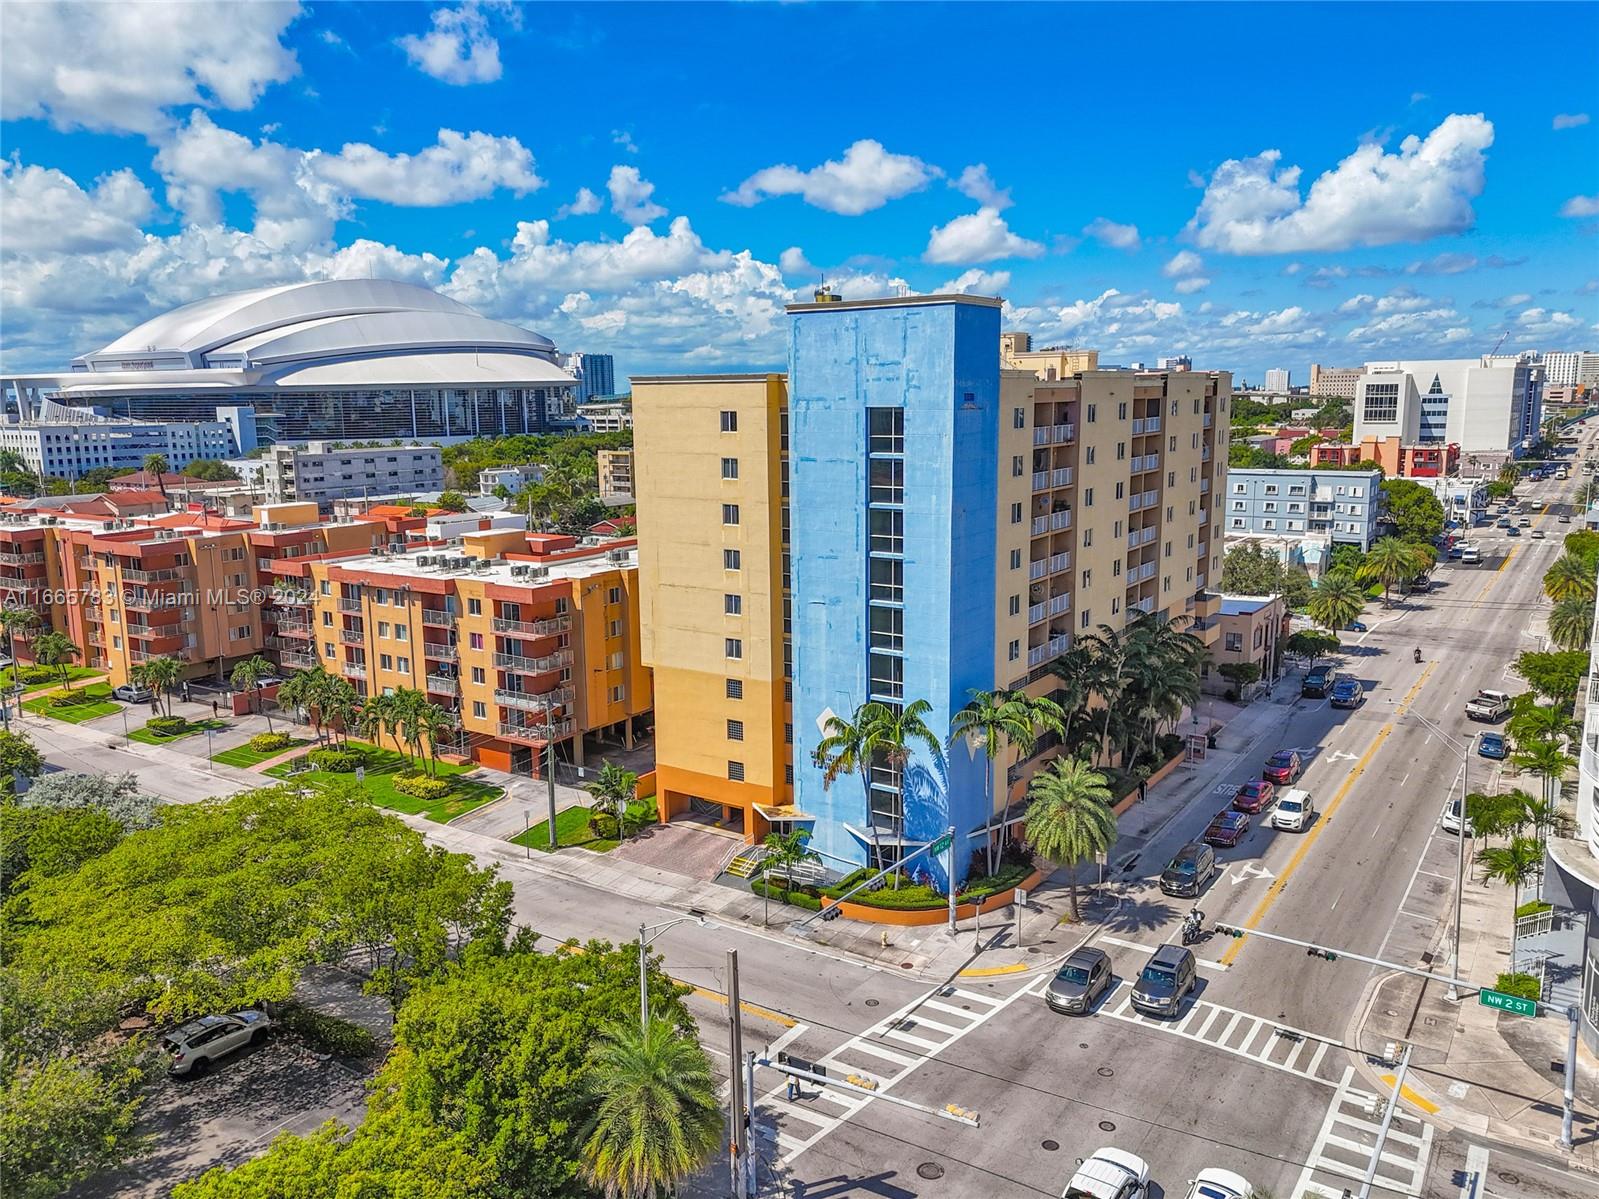
218 NW 12th Ave, Miami, FL 33128
$-629
Cash flow
-13.1%
Cash-on-Cash Return
3.1%
Cap rate
0.8%
Rent to Value Ratio
Active
$329,000
2
bds
|
1
ba
|
752
sqft
|
built
1970
444 SW 4th St, Miami, FL 33130
$-478
Cash flow
-7.6%
Cash-on-Cash Return
4.4%
Cap rate
0.8%
Rent to Value Ratio
Active
$795,000
3
bds
|
3
ba
|
1,492
sqft
|
built
1977
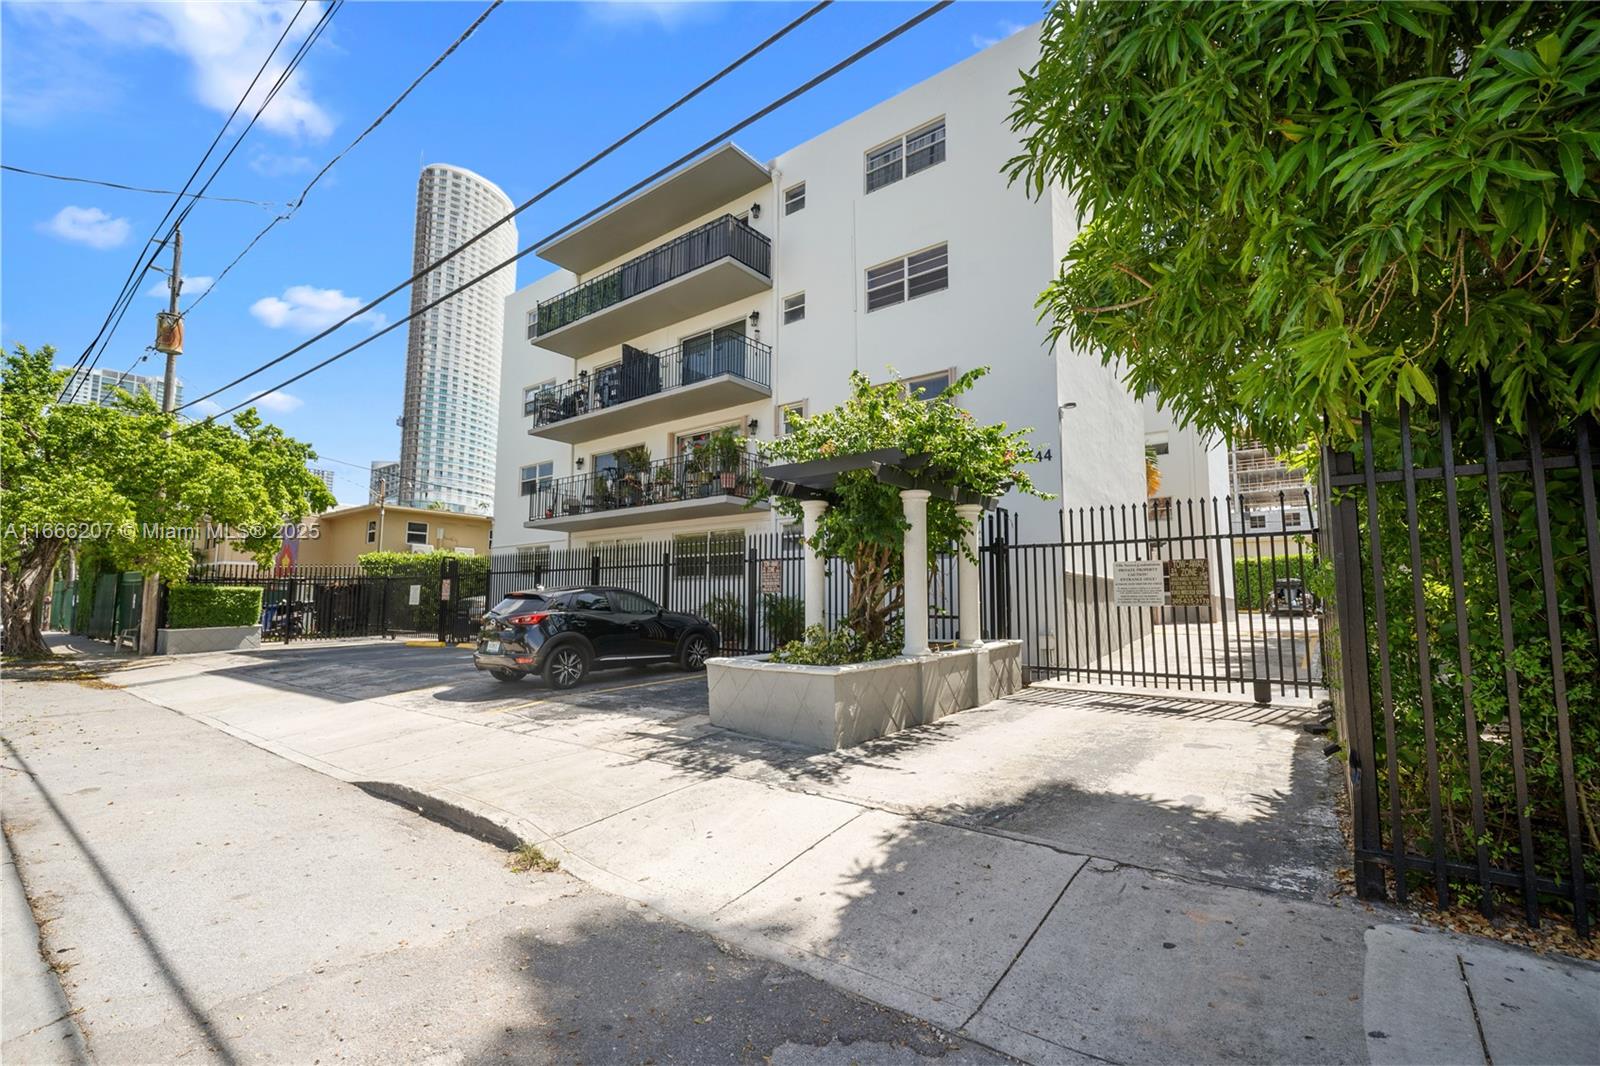
1359 SW 11th St, Miami, FL 33135
$-1,978
Cash flow
-13.0%
Cash-on-Cash Return
3.2%
Cap rate
0.5%
Rent to Value Ratio
Active
$310,000
3
bds
|
2
ba
|
1,200
sqft
|
built
1968
7410 SW 82nd St, Miami, FL 33143
$-1,165
Cash flow
-19.6%
Cash-on-Cash Return
1.6%
Cap rate
0.7%
Rent to Value Ratio
Active
$350,000
1
bds
|
2
ba
|
768
sqft
|
built
1973
600 NE 36th St, Miami, FL 33137
$-1,298
Cash flow
-19.3%
Cash-on-Cash Return
1.7%
Cap rate
0.7%
Rent to Value Ratio
Active
$289,900
2
bds
|
2
ba
|
1,140
sqft
|
built
1968
1301 NE Miami Gardens Dr, Miami, FL 33179
$-786
Cash flow
-14.1%
Cash-on-Cash Return
2.9%
Cap rate
0.8%
Rent to Value Ratio

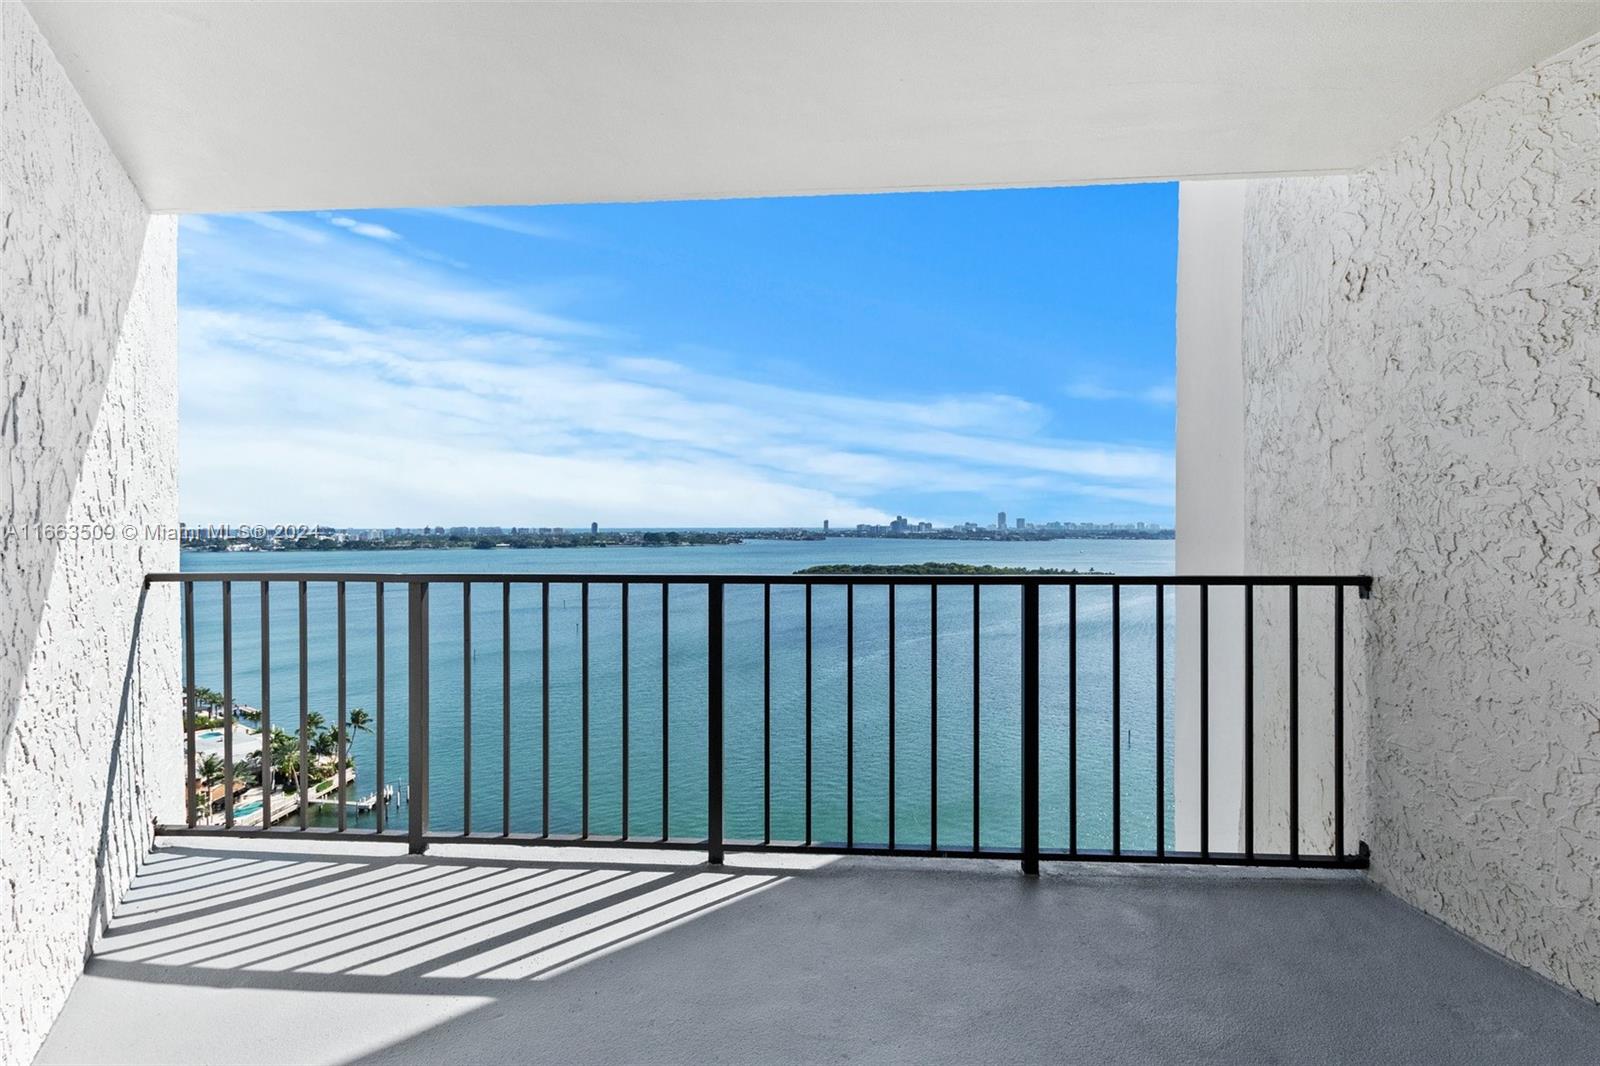
Active
$340,000
bds
|
1
ba
|
503
sqft
|
built
2007
1750 N Bayshore Dr, Miami, FL 33132
$-983
Cash flow
-15.1%
Cash-on-Cash Return
2.7%
Cap rate
0.7%
Rent to Value Ratio

Active
$760,000
2
bds
|
3
ba
|
1,171
sqft
|
built
2018
488 NE 18th St, Miami, FL 33132
$-2,021
Cash flow
-13.9%
Cash-on-Cash Return
3.0%
Cap rate
0.7%
Rent to Value Ratio

Active
$475,000
1
bds
|
2
ba
|
850
sqft
|
built
2019
1600 NE 1st Ave, Miami, FL 33132
$-1,692
Cash flow
-18.6%
Cash-on-Cash Return
1.9%
Cap rate
0.7%
Rent to Value Ratio
Active
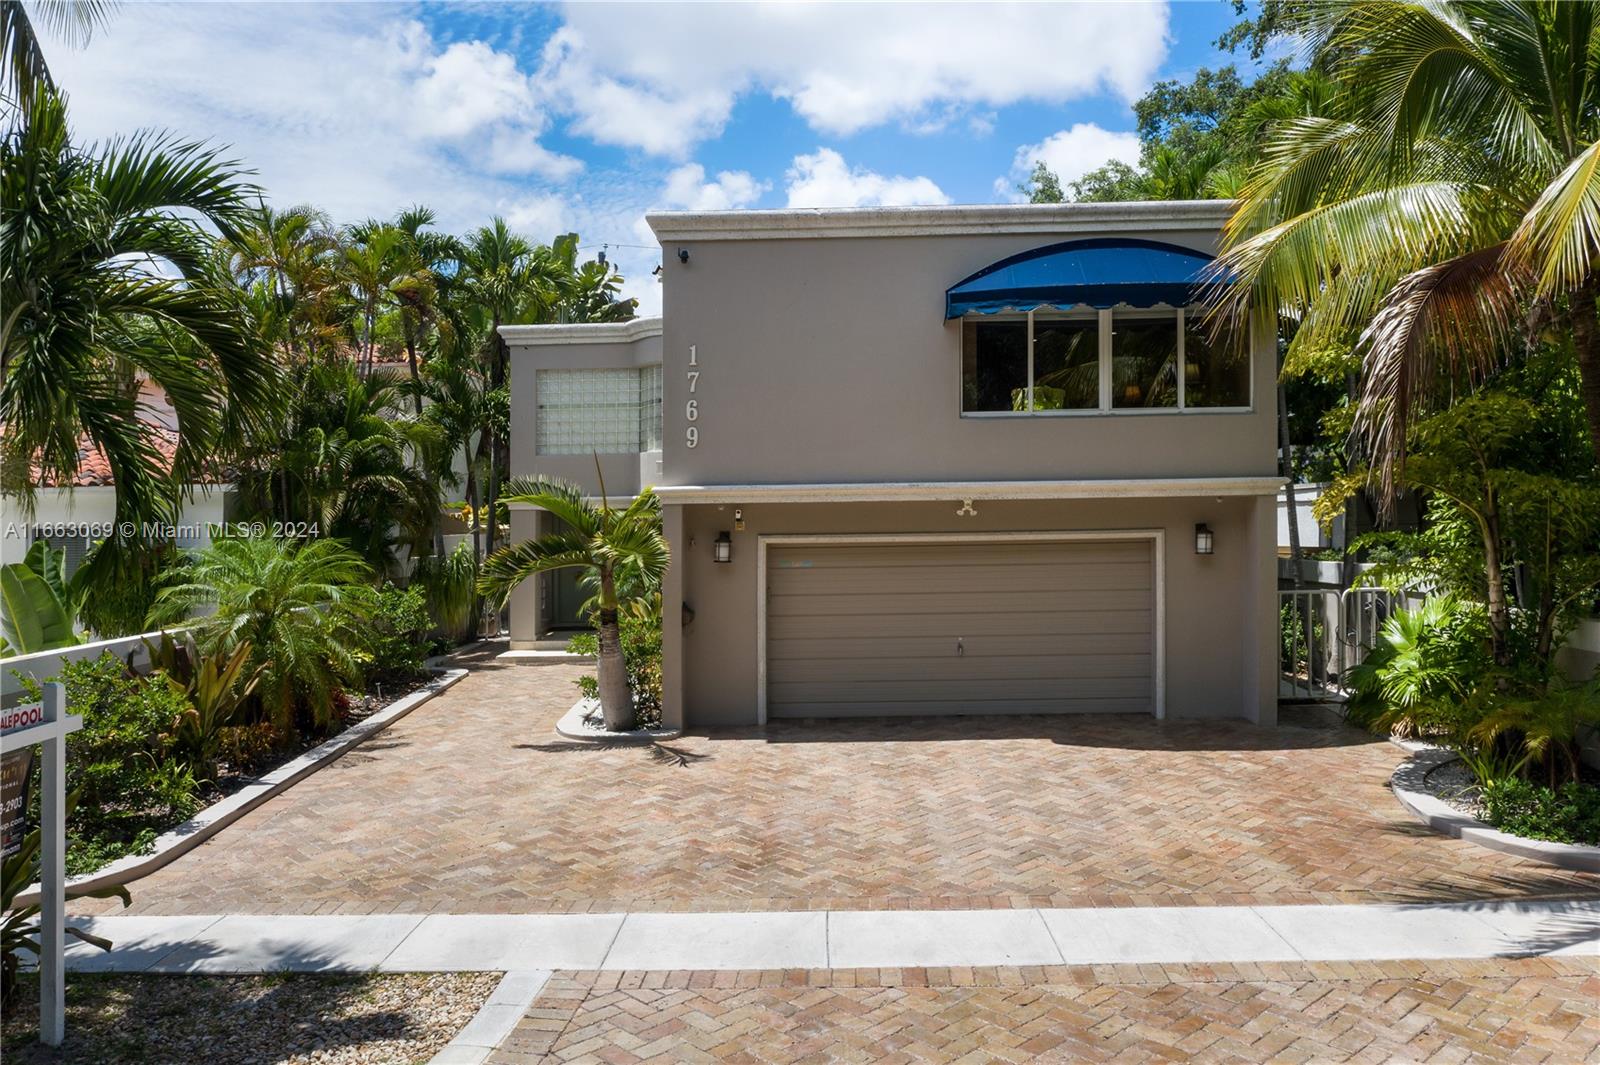
$2,500,000
4
bds
|
5
ba
|
2,945
sqft
|
built
1986
1769 Wa Kee Na Dr, Miami, FL 33133
$-7,131
Cash flow
-14.9%
Cash-on-Cash Return
2.7%
Cap rate
0.4%
Rent to Value Ratio
Active
$1,399,995
2
bds
|
2
ba
|
972
sqft
|
built
1924
46 NE 43rd St, Miami, FL 33137
$-4,343
Cash flow
-16.2%
Cash-on-Cash Return
2.4%
Cap rate
0.5%
Rent to Value Ratio
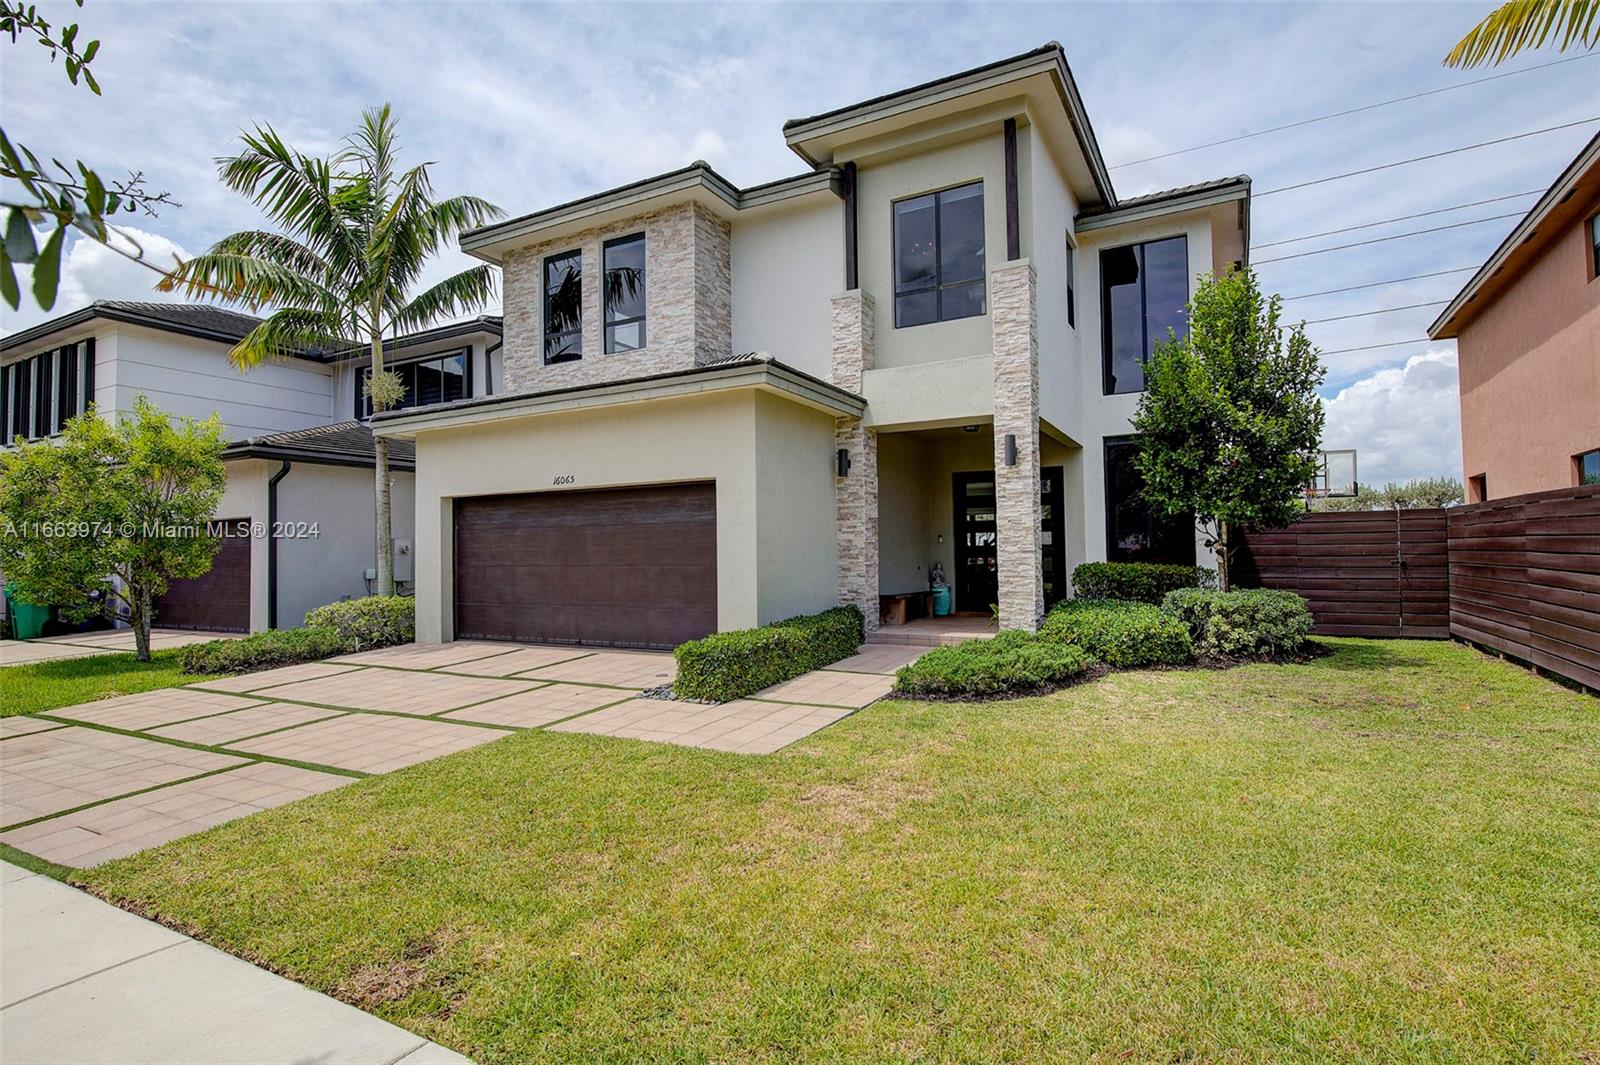
Active
$889,000
4
bds
|
3
ba
|
2,597
sqft
|
built
2016
16065 SW 136th Ter, Miami, FL 33196
$-1,479
Cash flow
-8.7%
Cash-on-Cash Return
4.2%
Cap rate
0.7%
Rent to Value Ratio
Active
$625,000
2
bds
|
2
ba
|
1,267
sqft
|
built
2006
41 SE 5th St, Miami, FL 33131
$-2,350
Cash flow
-19.6%
Cash-on-Cash Return
1.6%
Cap rate
0.6%
Rent to Value Ratio
Active
$659,000
2
bds
|
1
ba
|
2,128
sqft
|
built
1937
1143 NW 27th St, Miami, FL 33127
$-1,812
Cash flow
-14.3%
Cash-on-Cash Return
2.8%
Cap rate
0.5%
Rent to Value Ratio
Active
$1,100,000
2
bds
|
2
ba
|
1,290
sqft
|
built
2008
475 Brickell Ave, Miami, FL 33131
$-4,603
Cash flow
-21.8%
Cash-on-Cash Return
1.1%
Cap rate
0.5%
Rent to Value Ratio
Active
$359,900
3
bds
|
3
ba
|
1,950
sqft
|
built
1975
1800 NE 114th St, Miami, FL 33181
$-3,093
Cash flow
-44.8%
Cash-on-Cash Return
-4.2%
Cap rate
0.9%
Rent to Value Ratio
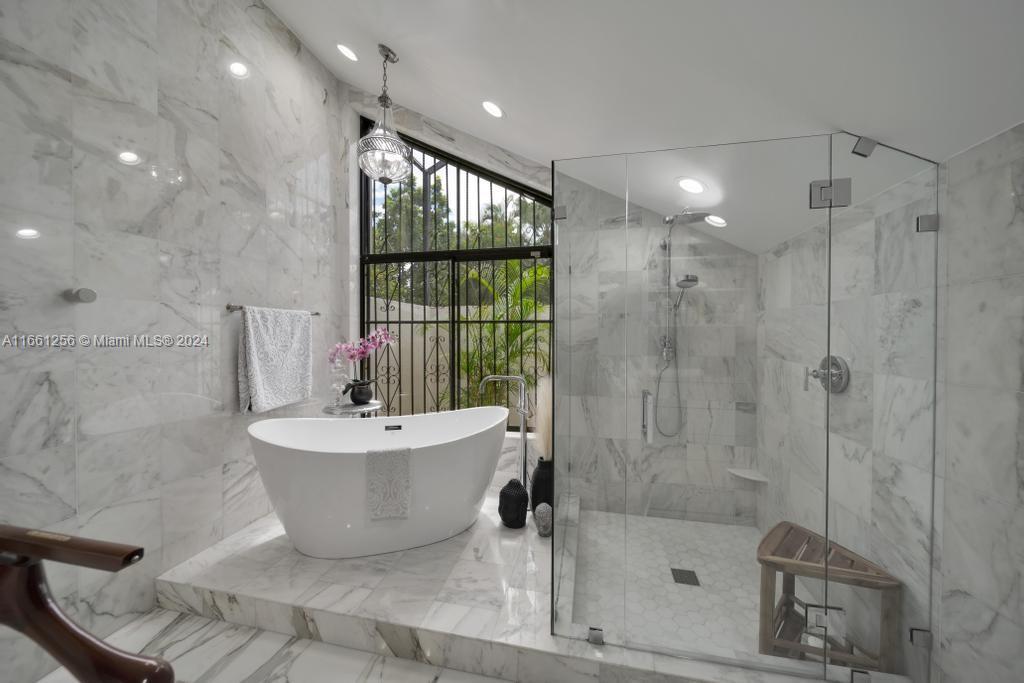
Active
$695,000
3
bds
|
2
ba
|
1,294
sqft
|
built
1944
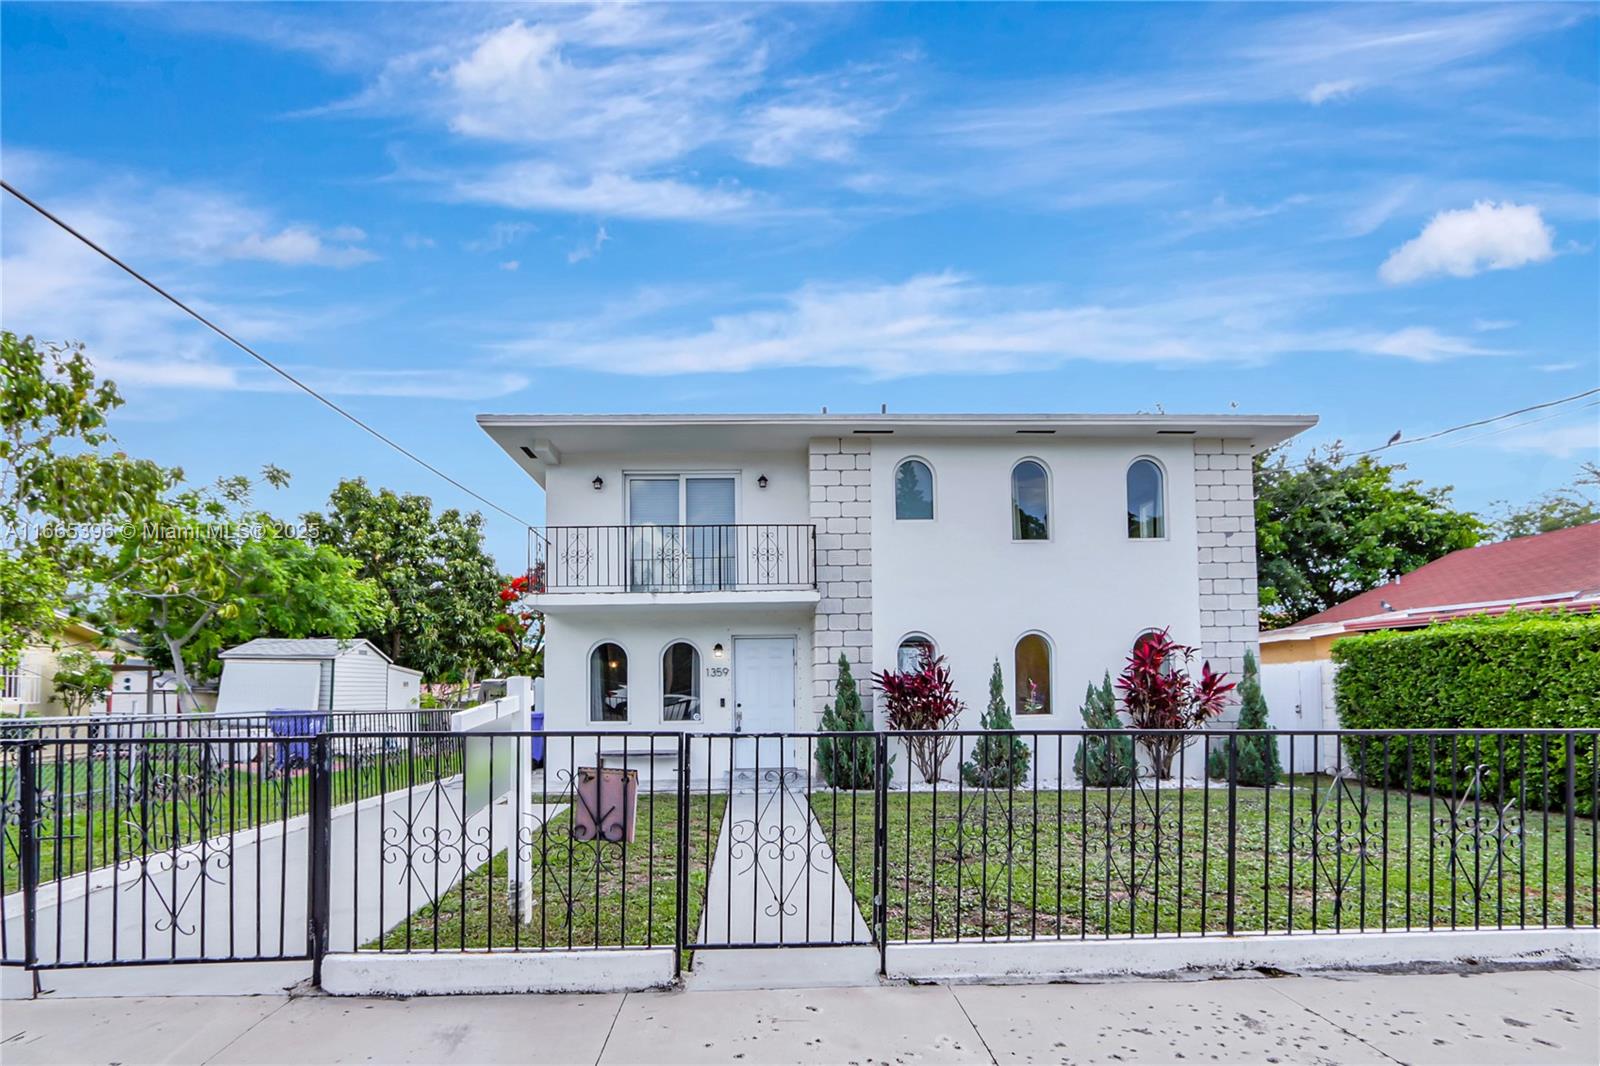
521 NW 32nd Pl, Miami, FL 33125
$-1,335
Cash flow
-10.0%
Cash-on-Cash Return
3.8%
Cap rate
0.5%
Rent to Value Ratio
Active
$749,500
4
bds
|
2
ba
|
1,737
sqft
|
built
1951
2380 SW 7th St, Miami, FL 33135
$-1,026
Cash flow
-7.1%
Cash-on-Cash Return
4.5%
Cap rate
0.6%
Rent to Value Ratio

Active
$390,000
2
bds
|
2
ba
|
948
sqft
|
built
2010
1861 NW South River Dr, Miami, FL 33125
$-1,434
Cash flow
-19.2%
Cash-on-Cash Return
1.7%
Cap rate
0.8%
Rent to Value Ratio
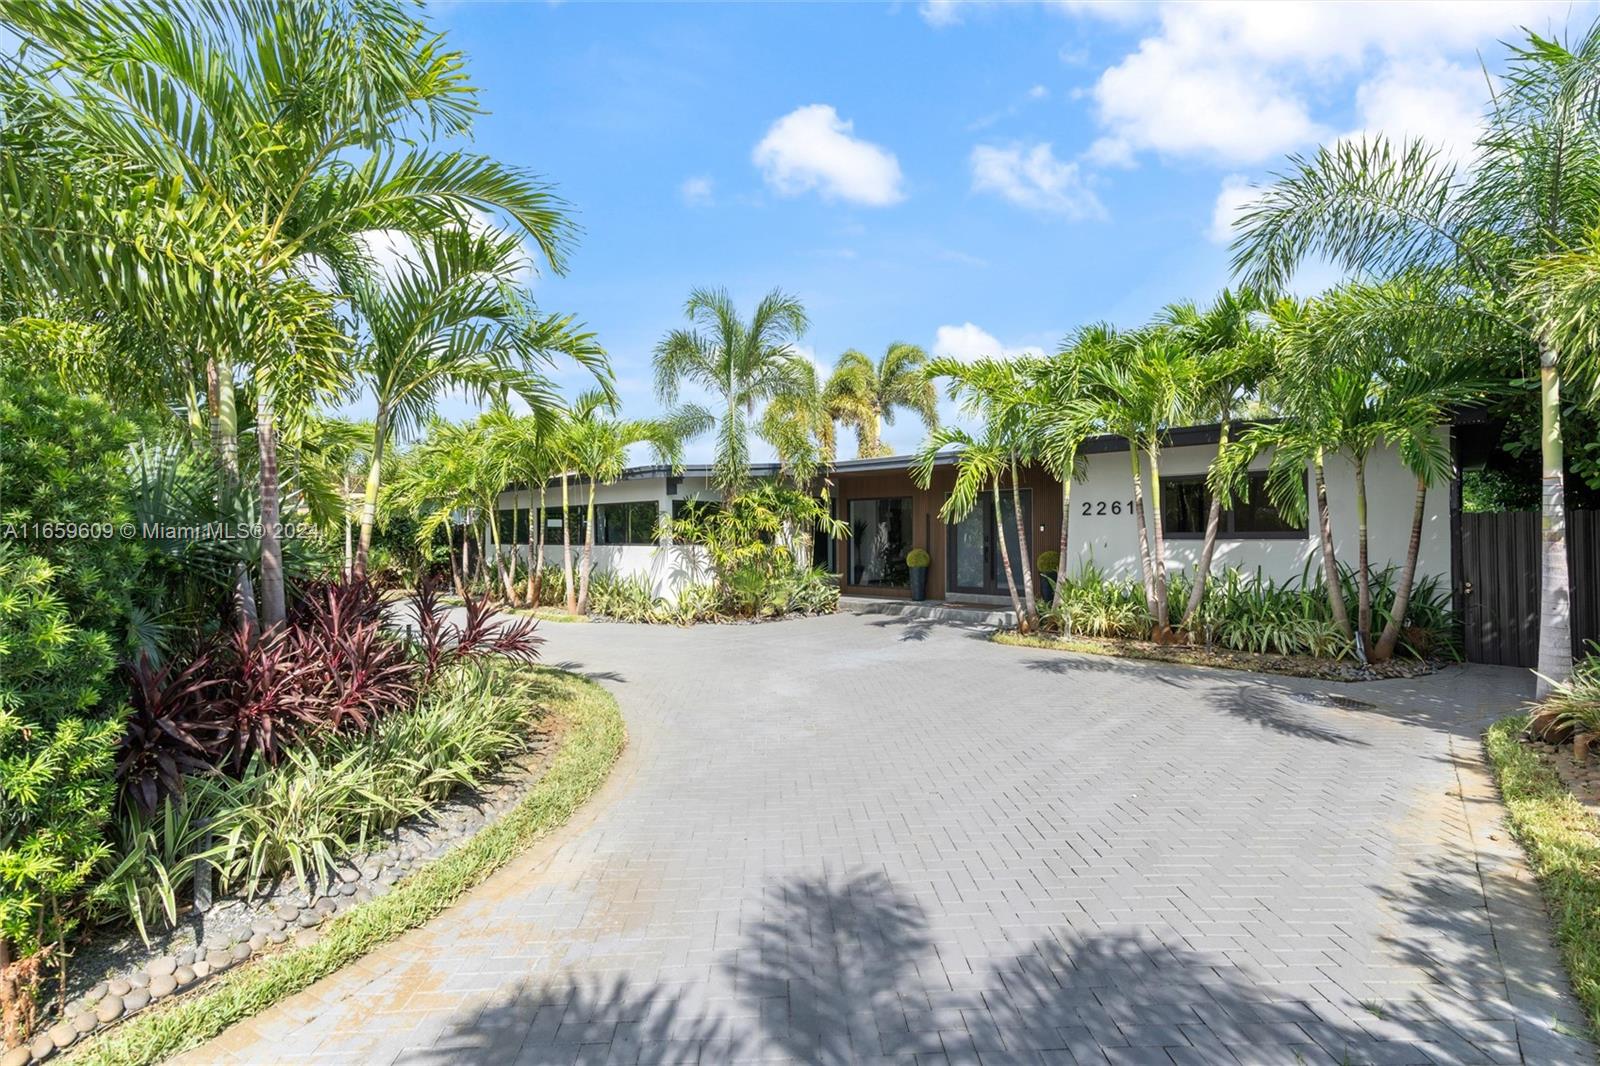
Active
$2,050,000
3
bds
|
3
ba
|
2,097
sqft
|
built
1958
2261 NE 192nd St, Miami, FL 33180
$-5,002
Cash flow
-12.7%
Cash-on-Cash Return
3.2%
Cap rate
0.4%
Rent to Value Ratio
Active
$700,000
1
bds
|
3
ba
|
2,320
sqft
|
built
1975
1800 NE 114th St, Miami, FL 33181
$-3,160
Cash flow
-23.6%
Cash-on-Cash Return
0.7%
Cap rate
0.7%
Rent to Value Ratio
Active
$790,000
1
bds
|
2
ba
|
738
sqft
|
built
2017
45 SW 9th St, Miami, FL 33130
$-3,090
Cash flow
-20.4%
Cash-on-Cash Return
1.5%
Cap rate
0.5%
Rent to Value Ratio

Active
$999,999
5
bds
|
4
ba
|
3,415
sqft
|
built
2005
15451 SW 30th St, Miami, FL 33185
$-956
Cash flow
-5.0%
Cash-on-Cash Return
5.0%
Cap rate
0.8%
Rent to Value Ratio
Active under contract
$1,999,000
4
bds
|
3
ba
|
2,837
sqft
|
built
1980
7706 SW 74th Ln, Miami, FL 33143
$-3,903
Cash flow
-10.2%
Cash-on-Cash Return
3.8%
Cap rate
0.5%
Rent to Value Ratio

Active
$650,000
1
bds
|
2
ba
|
866
sqft
|
built
2018
801 S Miami Ave, Miami, FL 33130
$-2,299
Cash flow
-18.5%
Cash-on-Cash Return
1.9%
Cap rate
0.8%
Rent to Value Ratio
Active
$889,000
5
bds
|
3
ba
|
2,417
sqft
|
built
1958
3327 NW 101st St, Miami, FL 33147
$-2,378
Cash flow
-14.0%
Cash-on-Cash Return
2.9%
Cap rate
0.5%
Rent to Value Ratio
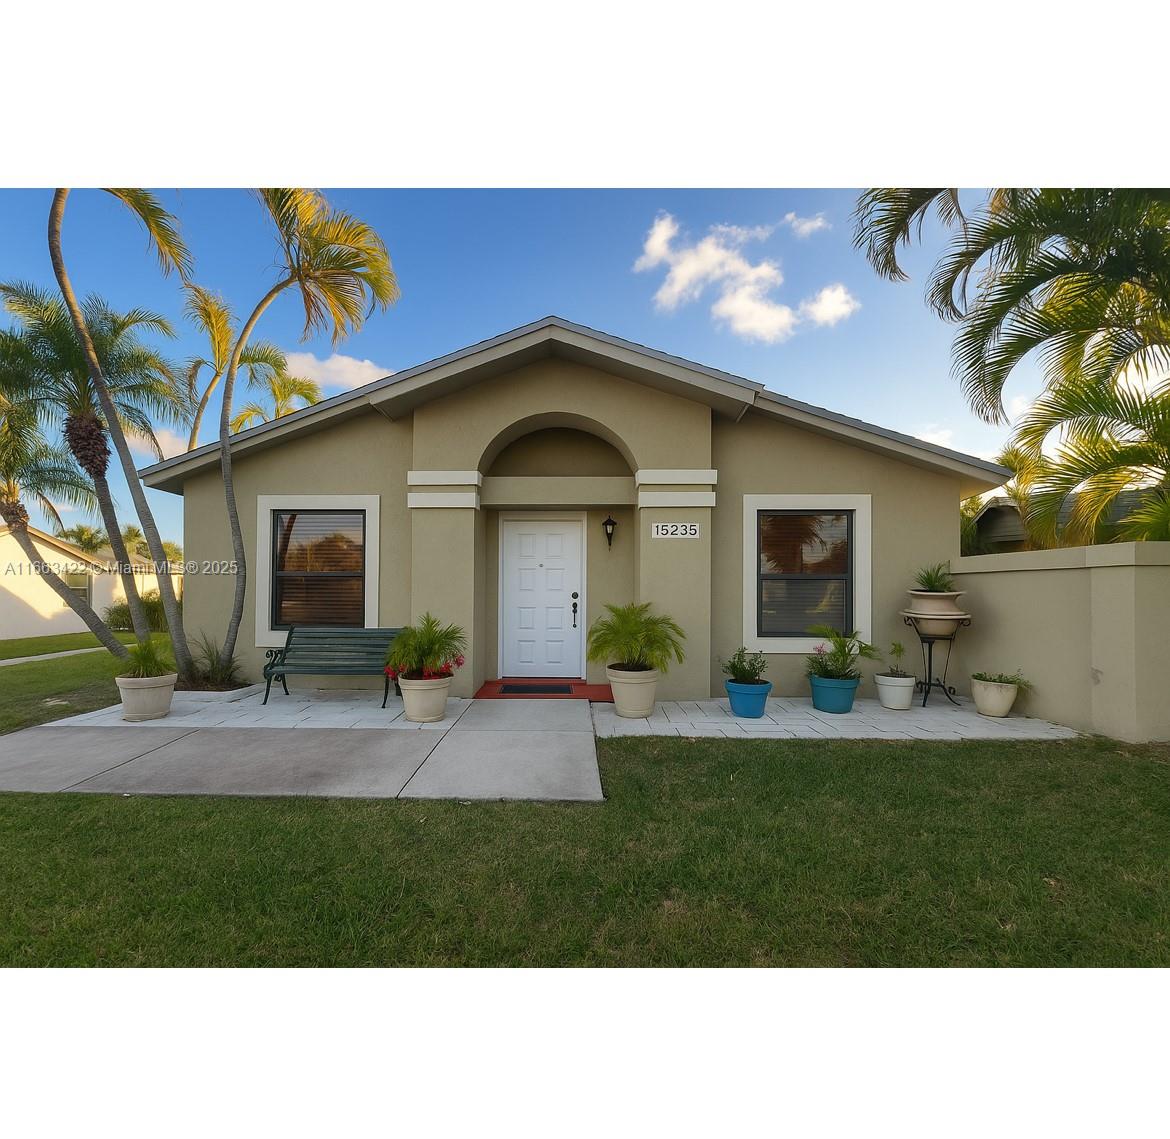
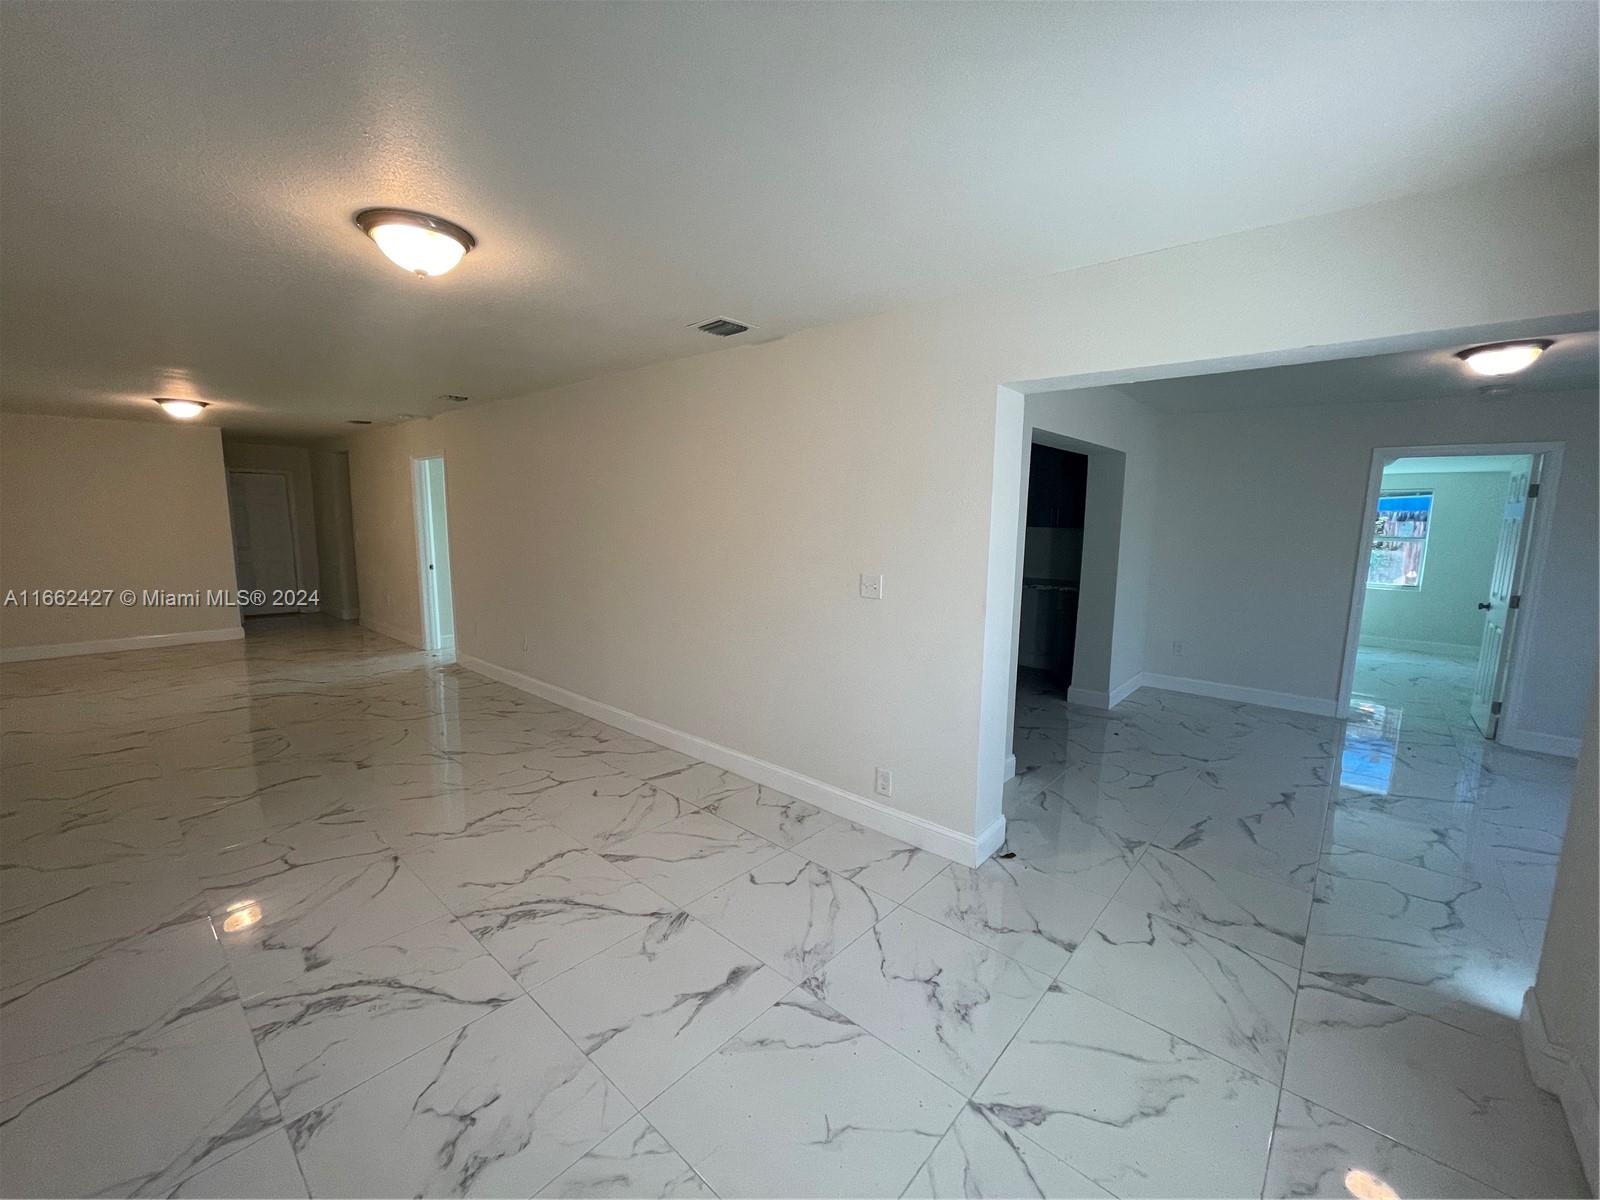
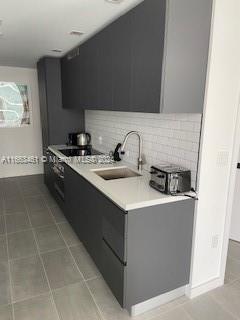
Active
$349,500
2
bds
|
2
ba
|
840
sqft
|
built
1987
15235 SW 64th Ter, Miami, FL 33193
$-720
Cash flow
-10.7%
Cash-on-Cash Return
3.7%
Cap rate
0.7%
Rent to Value Ratio
Active
$289,999
2
bds
|
3
ba
|
1,415
sqft
|
built
1972
9371 Fontainebleau Blvd, Miami, FL 33172
$-318
Cash flow
-5.7%
Cash-on-Cash Return
4.8%
Cap rate
0.9%
Rent to Value Ratio
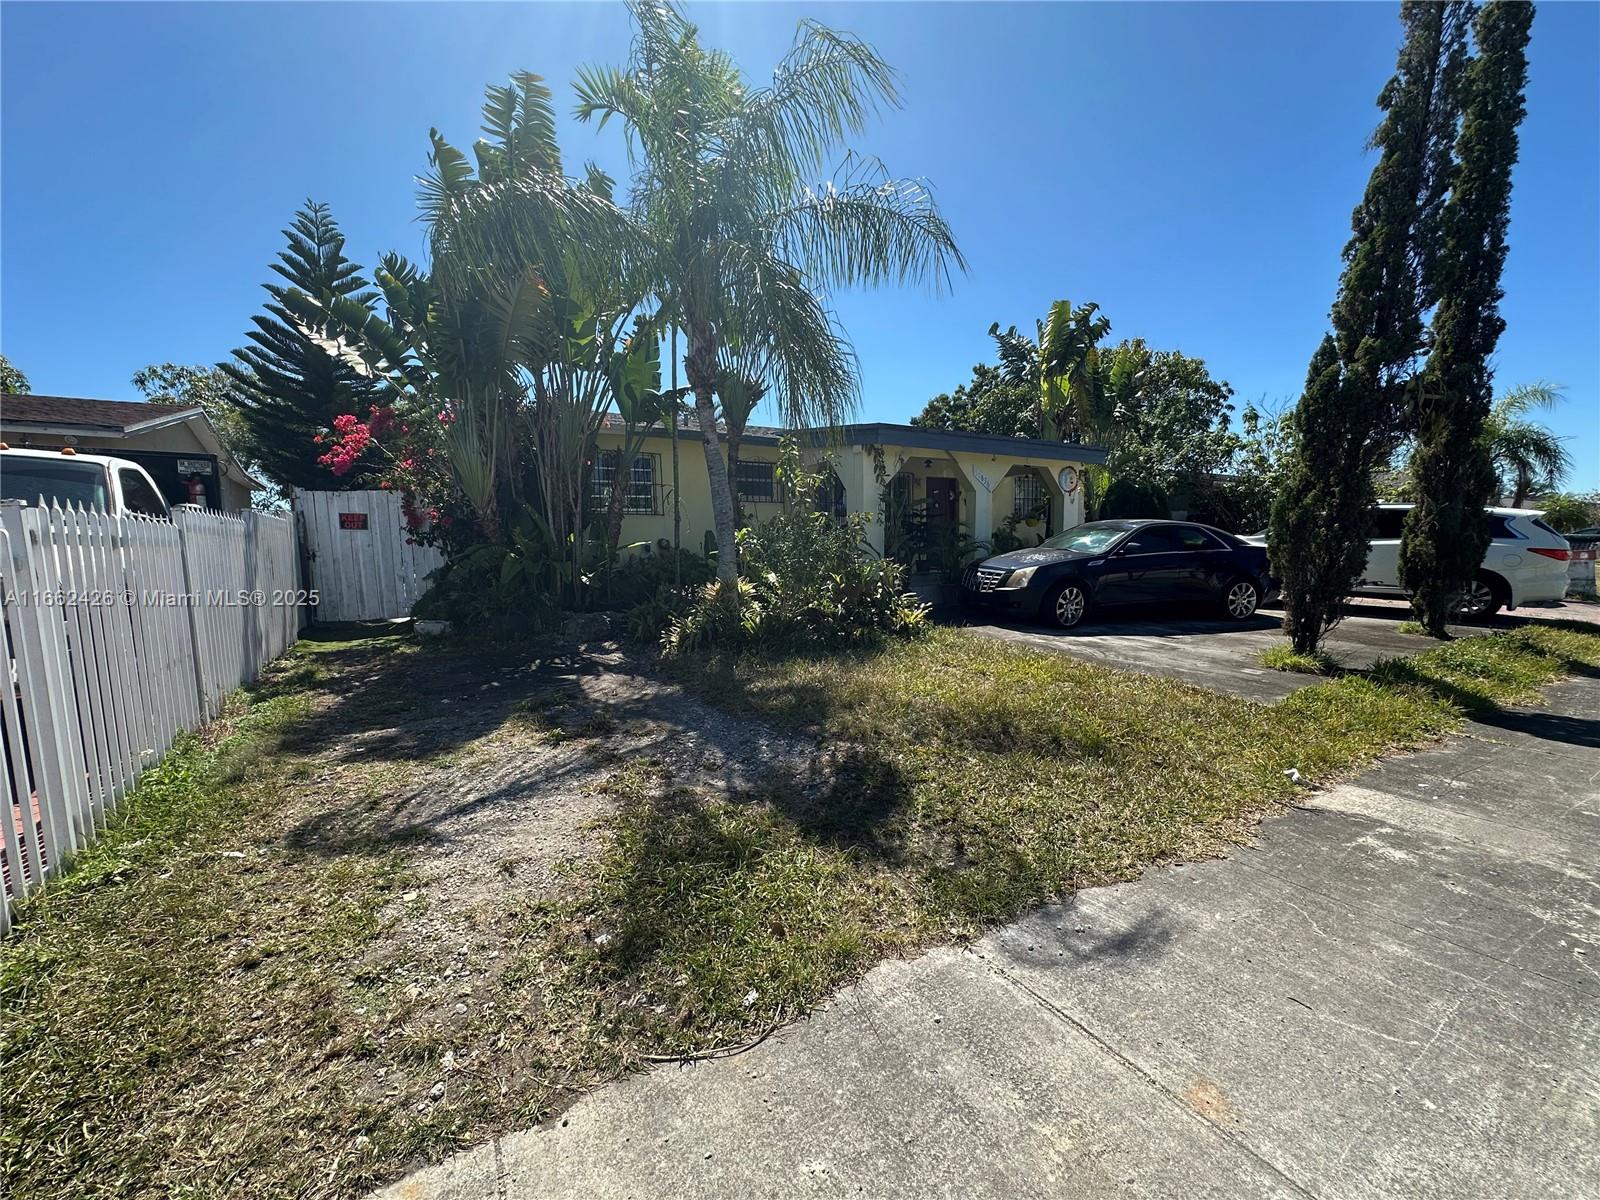
Active
$410,000
bds
|
1
ba
|
446
sqft
|
built
2022
227 NE 2nd St, Miami, FL 33132
$-1,223
Cash flow
-15.6%
Cash-on-Cash Return
2.6%
Cap rate
0.7%
Rent to Value Ratio

Active
$220,000
2
bds
|
3
ba
|
1,950
sqft
|
built
1975
1800 NE 114th St, Miami, FL 33181
$-1,599
Cash flow
-37.9%
Cash-on-Cash Return
-2.6%
Cap rate
1.6%
Rent to Value Ratio
Active
$575,000
6
bds
|
3
ba
|
2,250
sqft
|
built
1970
11836 SW 203rd Ter, Miami, FL 33177
$-896
Cash flow
-8.1%
Cash-on-Cash Return
4.3%
Cap rate
0.6%
Rent to Value Ratio

Active
$1,350,000
4
bds
|
0
ba
|
1,800
sqft
|
built
1948
635 SW 16th Ave, Miami, FL 33135
$-5,503
Cash flow
-21.3%
Cash-on-Cash Return
1.3%
Cap rate
0.3%
Rent to Value Ratio

Active
$1,050,000
2
bds
|
3
ba
|
1,265
sqft
|
built
2016
68 SE 6th St, Miami, FL 33131
$-5,253
Cash flow
-26.1%
Cash-on-Cash Return
0.1%
Cap rate
0.5%
Rent to Value Ratio
Active
$390,000
bds
|
1
ba
|
551
sqft
|
built
2008
1060 Brickell Ave, Miami, FL 33131
$-1,407
Cash flow
-18.8%
Cash-on-Cash Return
1.8%
Cap rate
0.6%
Rent to Value Ratio
Active
$190,000
1
bds
|
2
ba
|
861
sqft
|
built
1968
1301 NE Miami Gardens Dr, Miami, FL 33179
$-384
Cash flow
-10.5%
Cash-on-Cash Return
3.7%
Cap rate
0.9%
Rent to Value Ratio

Active
$514,000
1
bds
|
1
ba
|
755
sqft
|
built
2007
3250 NE 1st Ave, Miami, FL 33137
$-1,886
Cash flow
-19.1%
Cash-on-Cash Return
1.7%
Cap rate
0.7%
Rent to Value Ratio